Home > Analyses > Technology > NXP Semiconductors N.V.
NXP Semiconductors drives innovation at the heart of modern connectivity and smart technology. Its chips power everything from automotive safety systems to seamless wireless communications, shaping how billions interact with devices daily. Renowned for cutting-edge microcontrollers and secure wireless solutions, NXP commands a strong position in the semiconductor industry. As markets evolve rapidly, I explore whether NXP’s robust product lineup and global reach still justify its premium valuation and long-term growth prospects.

Table of contents
Business Model & Company Overview
NXP Semiconductors N.V., founded in 2006 and headquartered in Eindhoven, Netherlands, commands a leading position in the semiconductor industry. Its ecosystem integrates microcontrollers, application processors, wireless connectivity solutions, and sensors, powering innovations across automotive, industrial IoT, mobile, and communication infrastructure sectors. This cohesive product suite drives the company’s core mission to enable secure and intelligent connected devices globally.
The company’s revenue engine balances sales from hardware components like analog and interface devices with software-enabled wireless and security solutions. NXP’s strategic footprint spans key markets including the Americas, Europe, and Asia, serving OEMs, contract manufacturers, and distributors. Its strong economic moat derives from diversified product offerings and entrenched relationships in fast-growing, technology-critical industries shaping tomorrow’s digital landscape.
Financial Performance & Fundamental Metrics
I analyze NXP Semiconductors’ income statement, key financial ratios, and dividend payout policy to reveal its core financial health and shareholder value approach.
Income Statement
The following table summarizes NXP Semiconductors N.V.’s key income statement items from 2021 to 2025, reflecting revenue, expenses, profitability, and earnings per share.

| 2021 | 2022 | 2023 | 2024 | 2025 | |
|---|---|---|---|---|---|
| Revenue | 11.1B | 13.2B | 13.3B | 12.6B | 12.3B |
| Cost of Revenue | 5.0B | 5.7B | 5.7B | 5.5B | 5.6B |
| Operating Expenses | 3.5B | 3.7B | 3.9B | 3.7B | 3.4B |
| Gross Profit | 6.1B | 7.5B | 7.6B | 7.1B | 6.7B |
| EBITDA | 3.8B | 5.0B | 4.9B | 4.4B | 3.9B |
| EBIT | 2.5B | 3.8B | 3.8B | 3.5B | 3.1B |
| Interest Expense | 369M | 427M | 438M | 398M | 384M |
| Net Income | 1.9B | 2.8B | 2.8B | 2.5B | 2.0B |
| EPS | 6.91 | 10.64 | 10.83 | 9.84 | 8.00 |
| Filing Date | 2022-02-24 | 2023-03-01 | 2024-02-22 | 2025-02-20 | 2026-02-19 |
Income Statement Evolution
From 2021 to 2025, NXP Semiconductors’ revenue grew modestly by 10.9%. However, revenue and gross profit declined by 2.7% and 6.2% respectively in 2025 alone. Margins remain solid with a gross margin near 54%, though net margin fell 17% last year, indicating margin pressure despite overall positive trends over the full period.
Is the Income Statement Favorable?
The 2025 income statement shows a net income of $2.0B and a net margin of 16.5%, both down from 2024. EBIT margin at 24.9% and interest expense ratio at 3.1% remain favorable, reflecting efficient operations and manageable debt costs. Despite recent declines, overall fundamentals are favorable, supported by consistent margin strength and positive growth over several years.
Financial Ratios
The table below summarizes key financial ratios for NXP Semiconductors N.V. across recent fiscal years, offering insight into profitability, liquidity, leverage, and market valuation:
| Ratios | 2021 | 2022 | 2023 | 2024 | 2025 |
|---|---|---|---|---|---|
| Net Margin | 17% | 21% | 21% | 20% | 16% |
| ROE | 29% | 37% | 32% | 27% | 20% |
| ROIC | 12% | 16% | 15% | 13% | 11% |
| P/E | 33 | 15 | 21 | 21 | 27 |
| P/B | 9.4 | 5.6 | 6.9 | 5.8 | 5.5 |
| Current Ratio | 2.13 | 2.12 | 1.91 | 2.36 | 2.05 |
| Quick Ratio | 1.65 | 1.58 | 1.39 | 1.60 | 1.38 |
| D/E | 1.62 | 1.50 | 1.29 | 1.18 | 1.22 |
| Debt-to-Assets | 51% | 48% | 46% | 45% | 46% |
| Interest Coverage | 7.0 | 8.9 | 8.4 | 8.6 | 8.6 |
| Asset Turnover | 0.53 | 0.57 | 0.55 | 0.52 | 0.46 |
| Fixed Asset Turnover | 4.20 | 4.25 | 4.00 | 3.86 | 4.12 |
| Dividend Yield | 0.9% | 2.0% | 1.7% | 2.0% | 1.9% |
All figures are rounded for clarity.
Evolution of Financial Ratios
Return on Equity (ROE) showed a peak around 2023 at 32.4% before declining to 20.1% in 2025, indicating reduced profitability momentum. The Current Ratio remained stable near 2.0, signaling steady liquidity. Debt-to-Equity Ratio trended downward from 1.62 in 2021 to 1.22 in 2025, reflecting moderate deleveraging and improved capital structure stability.
Are the Financial Ratios Favorable?
In 2025, profitability ratios like net margin (16.5%) and ROE (20.1%) are favorable, exceeding sector averages. Liquidity ratios, including current (2.05) and quick (1.38), are solid, supporting short-term obligations. However, leverage remains elevated with a debt-to-equity of 1.22, marked unfavorable, and asset turnover at 0.46 is low, signaling efficiency concerns. Market valuation ratios (PE 27.1, PB 5.45) appear stretched. Overall, ratios are slightly favorable but warrant cautious interpretation.
Shareholder Return Policy
NXP Semiconductors maintains a dividend payout ratio around 41-51%, with a steady dividend per share rising from $2.08 in 2021 to $4.06 in 2025. The annual dividend yield hovers near 1.9%, supported by free cash flow coverage close to 86%, indicating disciplined capital allocation.
The company also engages in share buybacks, complementing dividends in returning value to shareholders. This balanced approach suggests a sustainable policy, aligning dividend growth and buybacks with cash flow generation, supporting long-term shareholder value without overextending financial resources.
Score analysis
The radar chart below summarizes key financial scores evaluating NXP Semiconductors N.V.’s valuation and profitability metrics:
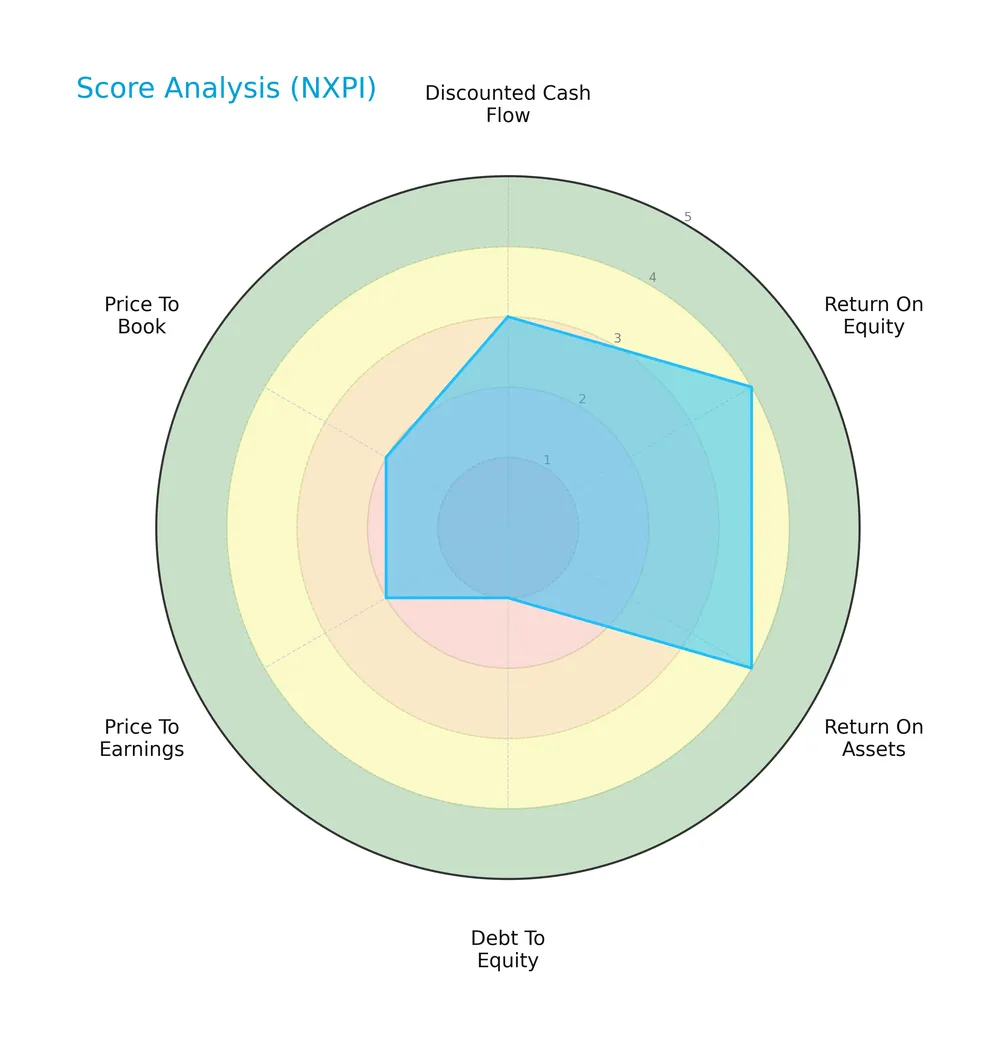
The company shows favorable returns on equity and assets with scores of 4 each, indicating operational efficiency. However, its debt-to-equity ratio scores very unfavorably at 1, signaling high leverage risk. Valuation metrics like price-to-earnings and price-to-book are also unfavorable, reflecting market caution.
Analysis of the company’s bankruptcy risk
The Altman Z-Score places NXP Semiconductors in the safe zone, indicating low bankruptcy risk and financial stability:

Is the company in good financial health?
The Piotroski Score diagram offers insight into the company’s current financial strength and operating performance:

With a Piotroski Score of 5, NXP Semiconductors shows average financial health. This score suggests moderate strength but also room for improvement in profitability, leverage, or efficiency metrics.
Competitive Landscape & Sector Positioning
This section examines NXP Semiconductors N.V.’s strategic positioning within the semiconductor industry. We will analyze its revenue breakdown, key products, and main competitors. I will assess whether NXP holds a competitive advantage over its peers.
Strategic Positioning
NXP Semiconductors concentrates primarily on high-performance mixed signal products, generating over $9B in 2018. Its geographic exposure is diversified, with significant revenue from the US, China, Germany, Japan, and Korea, reflecting a balanced presence across major semiconductor markets.
Revenue by Segment
This pie chart illustrates NXP Semiconductors’ revenue distribution by segment for fiscal year 2018, highlighting the relative contribution of each business unit.

High Performance Mixed Signal dominates NXP’s revenue with $9B in 2018, showing steady growth from $3.5B in 2013. Standard Products have declined sharply, reaching zero in 2018, signaling strategic exit or reclassification. Corporate and Other remains a minor but stable revenue source around $385M. The 2018 data confirms an increasing concentration in High Performance Mixed Signal, raising potential concentration risk despite strong top-line momentum.
Key Products & Brands
The following table outlines NXP Semiconductors’ main product lines and their descriptions:
| Product | Description |
|---|---|
| Microcontrollers | Integrated circuits controlling electronic devices, foundational in automotive and industrial systems. |
| Application Processors | Includes i.MX family (i.MX 8 and 9), powering multimedia, automotive, and IoT applications. |
| Communication Processors | Chips enabling data processing and communication functionalities in connected devices. |
| Wireless Connectivity Solutions | Technologies such as NFC, ultra-wideband, Bluetooth low-energy, Zigbee, Wi-Fi, and combined Wi-Fi/Bluetooth SoCs. |
| Analog and Interface Devices | Components that manage signal conversion and device interfacing, crucial for sensor integration and system control. |
| Radio Frequency Power Amplifiers | Amplify wireless signals, essential for communication infrastructure and mobile devices. |
| Security Controllers | Hardware ensuring device and data security through encryption and secure authentication. |
| Environmental and Inertial Sensors | Semiconductor sensors measuring pressure, magnetic fields, gyroscopic movement, aiding automotive and industrial systems. |
NXP’s product portfolio centers on high-performance mixed-signal semiconductors, generating over $9B annually by 2018. The company emphasizes automotive, industrial, mobile, and IoT markets, leveraging diversified semiconductor technologies for broad application coverage.
Main Competitors
NXP Semiconductors N.V. competes in a field of 38 companies; here are the top 10 leaders by market capitalization:
| Competitor | Market Cap. |
|---|---|
| NVIDIA Corporation | 4.6T |
| Broadcom Inc. | 1.6T |
| Taiwan Semiconductor Manufacturing Company Limited | 1.6T |
| ASML Holding N.V. | 415B |
| Advanced Micro Devices, Inc. | 363B |
| Micron Technology, Inc. | 353B |
| Lam Research Corporation | 232B |
| Applied Materials, Inc. | 214B |
| QUALCOMM Incorporated | 185B |
| Intel Corporation | 173B |
NXP Semiconductors ranks 16th among 38 peers, with a market cap just 1.27% of the leader, NVIDIA. It sits below the $975B average of the top 10 but above the sector median of $31B. The company maintains a 25.34% market cap gap over its closest competitor above, reflecting a moderate scale advantage.
Comparisons with competitors
Check out how we compare the company to its competitors:
Does NXPI have a competitive advantage?
NXP Semiconductors currently lacks a strong competitive advantage, as its ROIC falls below WACC by 1.79%, indicating value destruction. The company’s declining ROIC trend further signals weakening profitability and efficiency.
Looking ahead, NXPI’s diverse semiconductor portfolio spans automotive, industrial, IoT, and communication sectors across multiple markets. Opportunities exist in expanding wireless connectivity and advanced application processors, potentially supporting future growth despite recent margin pressures.
SWOT Analysis
This SWOT analysis highlights NXP Semiconductors’ core competitive position and challenges to guide strategic investment decisions.
Strengths
- strong gross margin at 54%
- favorable ROE at 20%
- diversified product portfolio in automotive and IoT
Weaknesses
- declining revenue growth recently
- high debt-to-equity ratio of 1.22
- unfavorable valuation multiples (PE 27, PB 5.45)
Opportunities
- growth in automotive electronics
- expanding 5G and IoT markets
- geographic expansion in US and Germany
Threats
- intense semiconductor industry competition
- exposure to geopolitical risks in China
- cyclicality in semiconductor demand
NXP’s robust profitability and product diversification provide a solid foundation. However, recent revenue softness and leverage signal caution. The firm must leverage growth in automotive and 5G sectors while managing geopolitical and market cyclicality risks.
Stock Price Action Analysis
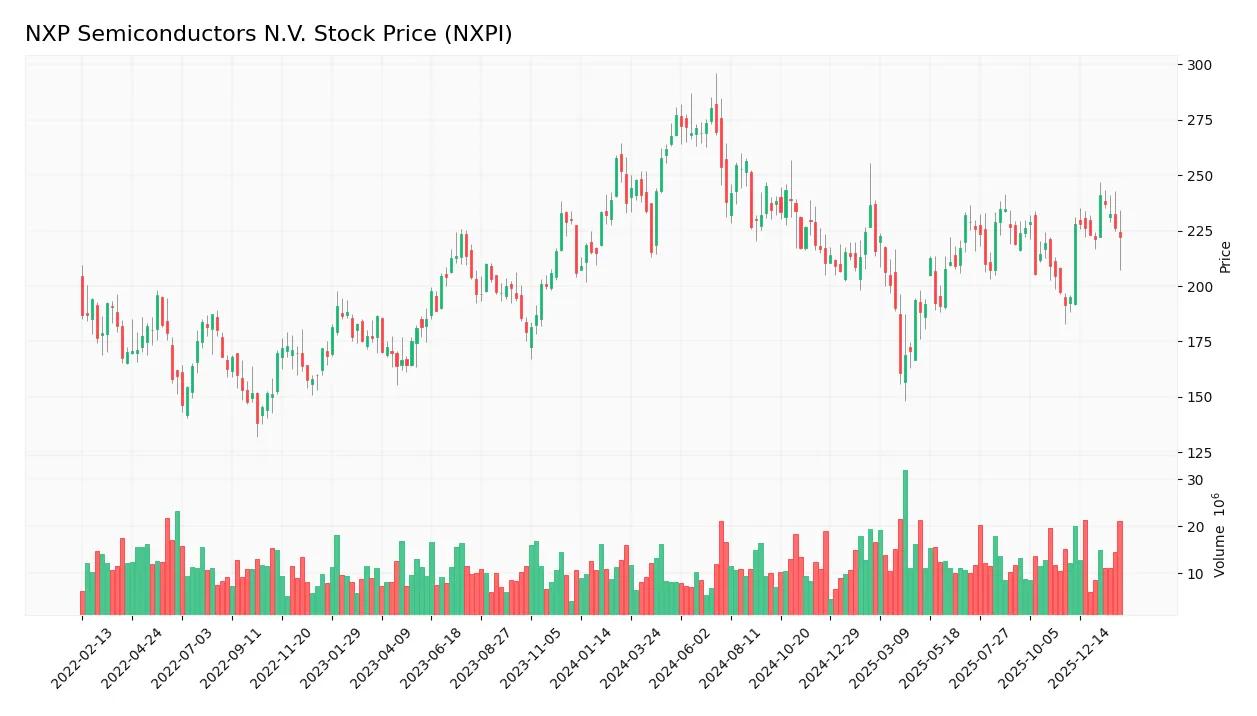
The weekly chart illustrates NXP Semiconductors N.V.’s stock price movement over the past 12 months, highlighting key highs and lows:
Trend Analysis
NXPI’s stock declined 6.26% over the past year, confirming a bearish trend with accelerating downward momentum. The price fluctuated between 280.19 and 160.81, showing high volatility with a standard deviation of 24.08. Short-term data shows a recent 1.9% gain, indicating a neutral trend with moderate upward slope.
Volume Analysis
Trading volume for NXPI is increasing overall, but recent activity is seller-driven, with sellers accounting for 63% of volume since December 2025. This suggests cautious investor sentiment and reduced buying enthusiasm amid persistent price pressure.
Target Prices
Analysts set a solid target consensus for NXP Semiconductors N.V. reflecting bullish expectations.
| Target Low | Target High | Consensus |
|---|---|---|
| 215 | 280 | 250 |
The target range from 215 to 280 shows confidence in NXPI’s growth potential. The consensus at 250 aligns with sector momentum and robust fundamentals.

Don’t Let Luck Decide Your Entry Point
Optimize your entry points with our advanced ProRealTime indicators. You’ll get efficient buy signals with precise price targets for maximum performance. Start outperforming now!
Analyst & Consumer Opinions
This section reviews analyst ratings and consumer feedback to provide a comprehensive view of NXP Semiconductors N.V.’s market perception.
Stock Grades
Here are the latest verified stock grades for NXP Semiconductors N.V. from reputable financial institutions:
| Grading Company | Action | New Grade | Date |
|---|---|---|---|
| Citigroup | Maintain | Buy | 2026-02-04 |
| B of A Securities | Maintain | Buy | 2026-02-04 |
| Mizuho | Maintain | Outperform | 2026-02-04 |
| Evercore ISI Group | Maintain | Outperform | 2026-02-04 |
| Truist Securities | Maintain | Buy | 2026-02-04 |
| JP Morgan | Maintain | Neutral | 2026-02-04 |
| Needham | Maintain | Buy | 2026-02-03 |
| Wells Fargo | Maintain | Overweight | 2026-01-15 |
The consensus leans clearly positive, with most firms maintaining Buy or Outperform ratings. Only JP Morgan holds a Neutral stance, indicating moderate confidence amid broad optimism.
Consumer Opinions
NXP Semiconductors N.V. garners a mix of praise and criticism from its user base, reflecting its complex role in a highly technical industry.
| Positive Reviews | Negative Reviews |
|---|---|
| “Excellent product reliability and performance.” | “Customer service response times are too slow.” |
| “Strong innovation in semiconductor technology.” | “Pricing is higher compared to competitors.” |
| “Robust supply chain ensures timely deliveries.” | “Occasional issues with software integration.” |
Overall, consumers appreciate NXP’s product quality and innovation. However, service responsiveness and pricing remain consistent pain points. These insights highlight where management can focus improvement efforts.
Risk Analysis
Below is a summary table outlining the key risks facing NXP Semiconductors N.V.:
| Category | Description | Probability | Impact |
|---|---|---|---|
| Market Valuation | Elevated P/E (27.14) and P/B (5.45) ratios indicate rich valuation | High | High |
| Leverage | High debt-to-equity ratio (1.22) raises financial risk | Moderate | Moderate |
| Industry Cyclicality | Semiconductor sector volatility could affect earnings | High | High |
| Geopolitical | Exposure to China and global supply chain disruptions | Moderate | High |
| Operational Efficiency | Below-average asset turnover (0.46) signals potential inefficiency | Moderate | Moderate |
Among these, valuation risk is most pronounced. The P/E and P/B ratios exceed industry norms, suggesting the stock trades at a premium. I note the semiconductor sector’s inherent cyclicality and geopolitical tensions, especially with China, could sharply impact NXP’s performance. While the Altman Z-Score places NXP in the safe zone, its moderate Piotroski score and high debt levels warrant caution.
Should You Buy NXP Semiconductors N.V.?
NXP Semiconductors appears to show robust profitability but an eroding competitive moat, indicating declining value creation. Despite a manageable leverage profile, valuation metrics seem unfavorable. Overall, the company suggests a moderate financial profile with a B rating.
Strength & Efficiency Pillars
NXP Semiconductors N.V. delivers solid profitability with a net margin of 16.47% and a return on equity of 20.1%. The return on invested capital (ROIC) stands at 11.03%, exceeding the weighted average cost of capital (WACC) at 9.24%, marking the company as a value creator. Its gross margin of 54.43% and operating margin near 25% affirm operational efficiency. The firm maintains a favorable interest coverage ratio of 7.97, signaling sound earnings relative to debt costs.
Weaknesses and Drawbacks
Despite operational strengths, NXP faces valuation headwinds with a high P/E ratio of 27.14 and a P/B ratio of 5.45, suggesting premium pricing that could pressure future returns. Leverage is a concern, with a debt-to-equity ratio of 1.22 flagged as very unfavorable, raising financial risk. The stock also contends with bearish market pressure; recent periods show seller dominance at 37.21%, undermining short-term momentum. Additionally, asset turnover is weak at 0.46, indicating less efficient use of assets.
Our Final Verdict about NXP Semiconductors N.V.
NXP Semiconductors exhibits a fundamentally sound profile with value-creating profitability and a stable solvency position, reinforced by its Altman Z-Score in the safe zone at 3.21. However, recent bearish price trends and seller dominance suggest caution. Despite long-term operational strength, the current market environment may warrant a wait-and-see approach for a more favorable entry point. The profile might appear suitable for investors with a tolerance for moderate valuation and leverage risks.
Disclaimer: This content is for informational purposes only and does not constitute financial, investment, or other professional advice. Investing in financial markets involves a significant risk of loss, and past performance is not indicative of future results.
Additional Resources
- NXP Semiconductors (NXPI) slides 3.4% as investors digest post-earnings outlook and recent run-up – Quiver Quantitative (Feb 19, 2026)
- NXP Semiconductors N.V. SEC 10-K Report – TradingView (Feb 19, 2026)
- Decoding NXP Semiconductors NV (NXPI): A Strategic SWOT Insight – GuruFocus (Feb 20, 2026)
- NXP Semiconductors Insiders Sell US$4.0m Of Stock, Possibly Signalling Caution – Yahoo Finance (Feb 17, 2026)
- Assessing NXP Semiconductors (NXPI) Valuation After Q4 Beat And AI‑Focused Growth Guidance – Sahm (Feb 14, 2026)
For more information about NXP Semiconductors N.V., please visit the official website: nxp.com