NVIDIA Corporation, a leader in the semiconductor industry, has made significant strides in recent years, particularly in the fields of graphics processing units (GPUs) and artificial intelligence (AI). With a market capitalization exceeding $4 trillion, NVIDIA’s innovative products and strategic partnerships position it as a formidable player in the tech sector. This article will help you determine if NVIDIA is a good investment opportunity by analyzing its financial performance, market position, and potential risks.
 Table of Contents
Company Description
NVIDIA Corporation is a global leader in graphics processing technology, providing innovative solutions for gaming, professional visualization, data centers, and automotive markets. Founded in 1993 and headquartered in Santa Clara, California, NVIDIA has expanded its reach to international markets, including Taiwan and China. The company is renowned for its GeForce GPUs, which power gaming and PC experiences, as well as its AI-driven data center solutions. NVIDIA’s strategic collaborations, such as with Kroger Co., further enhance its market presence and product offerings.
Key Products of NVIDIA
NVIDIA’s diverse product portfolio includes cutting-edge technologies that cater to various sectors.
| Product |
Description |
| GeForce GPUs |
High-performance graphics cards for gaming and PCs. |
| GeForce NOW |
Cloud gaming service that allows users to stream games. |
| NVIDIA RTX |
Advanced GPUs for professional visualization and enterprise graphics. |
| Data Center Solutions |
Platforms for AI, high-performance computing, and accelerated computing. |
| Jetson |
Embedded platforms for robotics and AI applications. |
Revenue Evolution
NVIDIA has experienced significant revenue growth over the past few years, reflecting its strong market position and product demand.
| Year |
Revenue (in millions) |
EBITDA (in millions) |
EBIT (in millions) |
Net Income (in millions) |
EPS |
| 2021 |
16,675 |
5,691 |
4,532 |
4,332 |
0.18 |
| 2022 |
26,914 |
11,351 |
10,041 |
9,752 |
0.39 |
| 2023 |
26,974 |
5,987 |
4,224 |
4,368 |
0.18 |
| 2024 |
60,922 |
35,583 |
32,972 |
29,760 |
1.21 |
| 2025 |
130,497 |
86,137 |
81,453 |
72,880 |
2.97 |
NVIDIA’s revenue has shown a remarkable upward trend, with a significant increase from $16.7 billion in 2021 to $130.5 billion in 2025. This growth is accompanied by a corresponding rise in net income and earnings per share (EPS), indicating strong operational efficiency and market demand.
Financial Ratios Analysis
The financial ratios provide insight into NVIDIA’s operational efficiency and profitability.
| Year |
Net Margin |
ROE |
ROIC |
P/E |
P/B |
Current Ratio |
D/E |
| 2021 |
25.79% |
25.64% |
18.23% |
75.43 |
19.34 |
4.09 |
0.46 |
| 2022 |
36.62% |
36.65% |
25.20% |
62.68 |
22.97 |
6.65 |
0.44 |
| 2023 |
16.18% |
19.76% |
12.20% |
109.09 |
21.56 |
3.52 |
0.54 |
| 2024 |
48.49% |
69.24% |
59.84% |
51.83 |
35.89 |
4.17 |
0.26 |
| 2025 |
55.48% |
91.87% |
87.07% |
39.90 |
36.66 |
4.44 |
0.13 |
Interpretation of Financial Ratios
In 2025, NVIDIA’s net margin stands at an impressive 55.48%, indicating strong profitability. The return on equity (ROE) is exceptionally high at 91.87%, showcasing effective management of shareholder equity. The return on invested capital (ROIC) is also robust at 87.07%, reflecting efficient use of capital. The price-to-earnings (P/E) ratio of 39.90 suggests that investors are willing to pay a premium for NVIDIA’s earnings, while the price-to-book (P/B) ratio of 36.66 indicates high market expectations for future growth. The current ratio of 4.44 demonstrates strong liquidity, and the debt-to-equity (D/E) ratio of 0.13 indicates low financial leverage.
Evolution of Financial Ratios
Over the past five years, NVIDIA’s financial ratios have shown a favorable trend. The net margin has increased significantly, reflecting improved operational efficiency. The ROE and ROIC have also risen, indicating effective management and capital utilization. The current ratio remains strong, suggesting that NVIDIA is well-positioned to meet its short-term obligations. Overall, the latest year’s ratios are generally favorable, indicating a solid financial position.
Distribution Policy
NVIDIA has a low payout ratio of 1.14%, indicating that it retains most of its earnings for reinvestment rather than distributing them as dividends. The annual dividend yield is minimal at 0.0286%, and while the company has engaged in share buybacks, it is essential to note that these buybacks are not excessively covered by cash flow. This strategy suggests a focus on growth and expansion rather than immediate shareholder returns.
Sector Analysis
NVIDIA operates in the highly competitive semiconductor industry, where it holds a significant market share in the GPU segment. The company faces competitive pressure from other major players, including AMD and Intel, but its technological advancements and product innovations provide a competitive edge. The rapid growth of AI and machine learning applications presents opportunities for NVIDIA to expand its market presence further.
Main Competitors
The following table outlines NVIDIA’s main competitors and their respective market shares.
| Company |
Market Share |
| NVIDIA |
80% |
| AMD |
15% |
| Intel |
5% |
NVIDIA dominates the GPU market with an 80% share, significantly outpacing its closest competitors, AMD and Intel. This strong market position allows NVIDIA to leverage its brand and technology to maintain a competitive advantage.
Competitive Advantages
NVIDIA’s competitive advantages stem from its strong brand recognition, innovative technology, and extensive product portfolio. The company’s focus on research and development enables it to stay ahead of competitors in terms of performance and efficiency. Additionally, NVIDIA’s strategic partnerships and collaborations, such as with Kroger Co., enhance its market reach and product offerings. Looking ahead, NVIDIA is well-positioned to capitalize on emerging trends in AI and machine learning, further solidifying its market leadership.
Stock Analysis
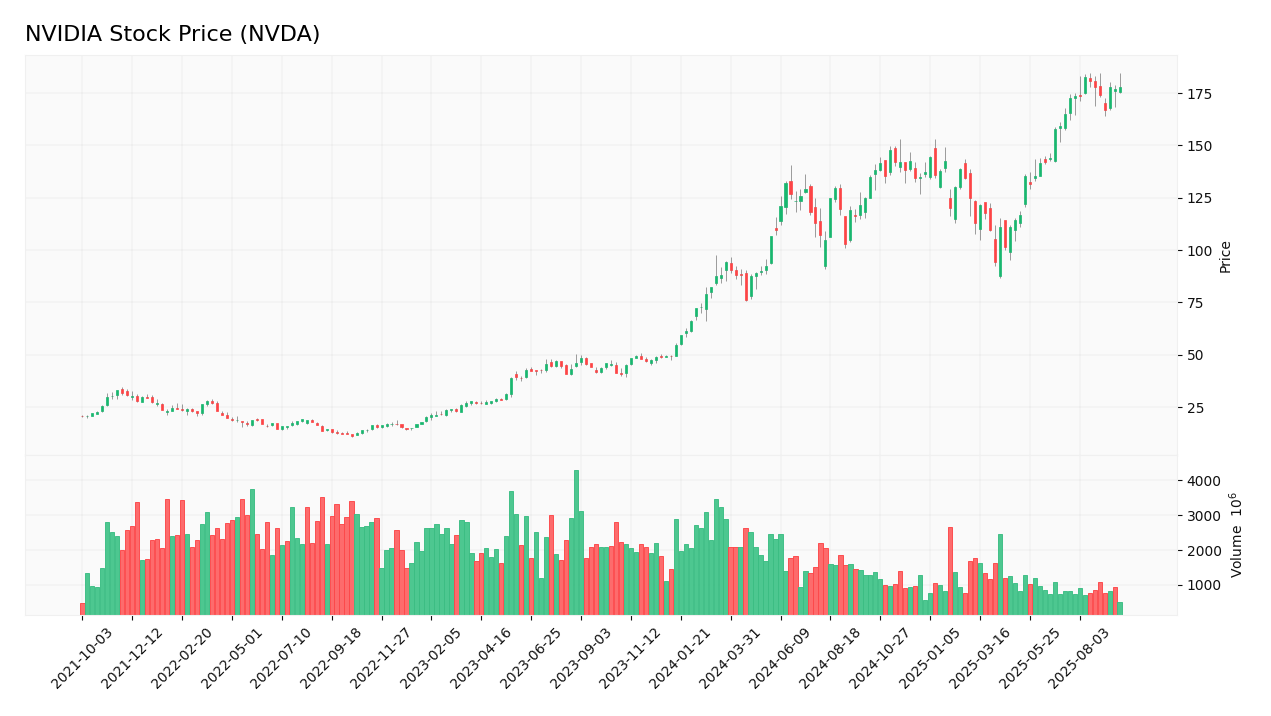
The following chart illustrates NVIDIA’s stock price trend over the past year.
Trend Analysis
NVIDIA’s stock has shown a bullish trend over the past year, with a significant increase in price from $14.85 in January 2023 to $177.57 in September 2025. This represents a remarkable percentage increase of approximately 1,090% over the period. The stock has experienced some volatility, with a 52-week range of $86.62 to $184.55, indicating fluctuations in investor sentiment. Overall, the long-term trend appears positive, supported by strong financial performance and market demand.
Volume Analysis
Over the last three months, NVIDIA’s average trading volume has been approximately 189 million shares per day. This high volume indicates strong investor interest and suggests that the stock is primarily buyer-driven. The volume has been increasing, reflecting growing confidence in NVIDIA’s future prospects and market position.
Analyst Opinions
Recent analyst recommendations for NVIDIA have been predominantly positive, with many analysts rating the stock as a “buy.” The main arguments for this consensus include the company’s strong financial performance, innovative product offerings, and favorable market conditions for AI and gaming technologies. As of 2025, the consensus remains a “buy,” indicating confidence in NVIDIA’s growth potential.
Consumer Opinions
Consumer feedback on NVIDIA products has been largely positive, with many praising the performance and reliability of its GPUs. However, some users have expressed concerns regarding pricing and availability.
| Positive Reviews |
Negative Reviews |
| Exceptional performance in gaming |
High prices for GPUs |
| Reliable for professional applications |
Limited availability during peak demand |
| Strong support and updates from NVIDIA |
Compatibility issues with some software |
Risk Analysis
The following table outlines the main risks faced by NVIDIA.
| Risk Category |
Description |
Probability |
Potential Impact |
Recent Example / Fact |
| Financial |
High dependency on GPU sales for revenue. |
Medium |
High |
N/A |
| Operational |
Supply chain disruptions affecting production. |
High |
Moderate |
COVID-19 impact on semiconductor supply. |
| Sector |
Intense competition from AMD and Intel. |
High |
High |
N/A |
| Regulatory |
Potential antitrust scrutiny in the tech sector. |
Medium |
High |
N/A |
| Geopolitical |
Trade tensions affecting international sales. |
Medium |
High |
N/A |
| Technological |
Rapid technological changes requiring constant innovation. |
High |
High |
N/A |
The most critical risks for investors include operational risks related to supply chain disruptions and sector risks due to intense competition.
Summary
In summary, NVIDIA’s flagship products, strong financial ratios, and competitive advantages position it favorably in the semiconductor industry. However, the company faces risks related to competition and supply chain disruptions.
The following table summarizes NVIDIA’s strengths and weaknesses.
| Strengths |
Weaknesses |
| Market leader in GPUs |
High dependency on GPU sales |
| Strong brand recognition |
Vulnerability to supply chain issues |
| Innovative technology and products |
Intense competition in the sector |
Should You Buy NVIDIA?
Given NVIDIA’s strong net margin of 55.48%, a positive long-term trend, and increasing buyer volumes, the stock presents a favorable signal for long-term investment. However, investors should remain cautious of the risks associated with competition and supply chain disruptions.
Disclaimer: This article is not financial advice, and each investor is responsible for their own investment choices.
Additional Resources
For more information, visit NVIDIA’s official website:
NVIDIA Corporation.

 Table of Contents