Home > Analyses > Technology > NVIDIA Corporation
NVIDIA transforms how we experience digital worlds, powering everything from cutting-edge gaming to AI-driven data centers. Its flagship GeForce GPUs and AI platforms define industry standards, blending innovation with relentless quality. I’ve observed that NVIDIA’s ability to expand into autonomous vehicles and virtual simulations strengthens its competitive moat. Yet, with a lofty valuation, the key question remains: does NVIDIA’s growth potential still justify its premium price in 2026?
Table of contents
Business Model & Company Overview
NVIDIA Corporation, founded in 1993 and headquartered in Santa Clara, CA, leads the semiconductors industry with a broad ecosystem spanning gaming, professional visualization, and AI computing. Its portfolio integrates high-performance GPUs, AI platforms, and software like Omniverse, creating a seamless core mission to advance computing power and virtual experiences worldwide.
The company’s revenue engine balances hardware sales—including GeForce and Quadro GPUs—with growing software and service streams such as cloud gaming and AI enterprise solutions. NVIDIA commands a strategic presence across the Americas, Europe, and Asia, supporting diverse markets from datacenters to automotive. This diversified model fuels an enduring competitive advantage that solidifies its role in shaping the future of computing.
Financial Performance & Fundamental Metrics
I will analyze NVIDIA Corporation’s income statement, key financial ratios, and dividend payout policy to assess its profitability and capital efficiency.
Income Statement
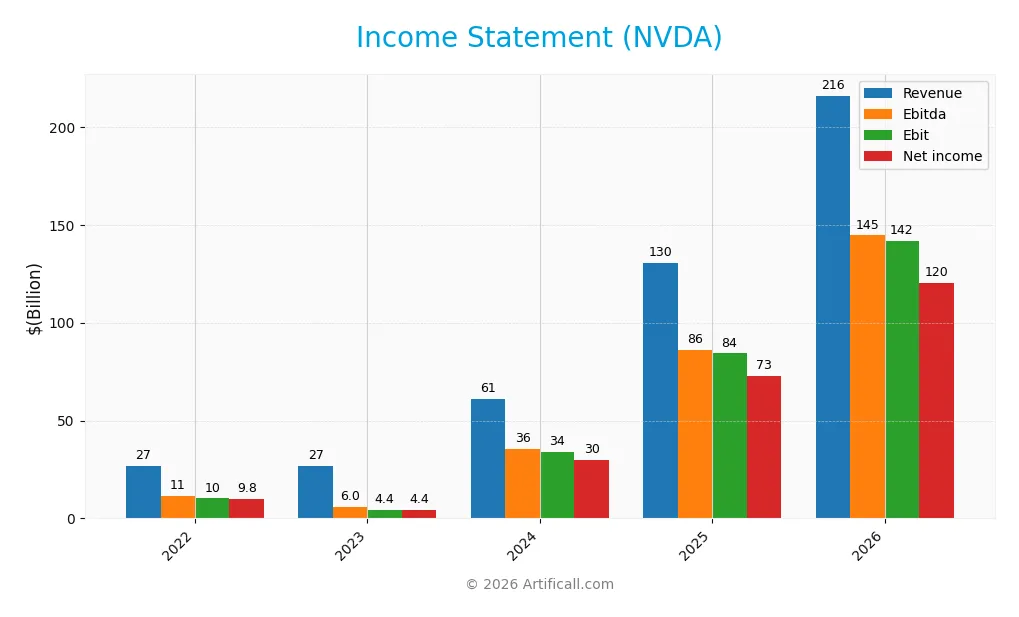
The table below summarizes NVIDIA Corporation’s annual income statement figures from fiscal years 2022 to 2026, reflecting key profitability and expense metrics.
| 2022 | 2023 | 2024 | 2025 | 2026 | |
|---|---|---|---|---|---|
| Revenue | 26.9B | 27.0B | 60.9B | 130.5B | 215.9B |
| Cost of Revenue | 9.4B | 11.6B | 16.6B | 32.6B | 62.5B |
| Operating Expenses | 7.4B | 11.1B | 11.3B | 16.4B | 23.1B |
| Gross Profit | 17.5B | 15.4B | 44.3B | 97.9B | 153.5B |
| EBITDA | 11.4B | 6.0B | 35.6B | 86.1B | 144.6B |
| EBIT | 10.2B | 4.4B | 34.1B | 84.3B | 141.7B |
| Interest Expense | 236M | 262M | 257M | 247M | 260M |
| Net Income | 9.8B | 4.4B | 29.8B | 72.9B | 120.1B |
| EPS | 0.39 | 0.18 | 1.21 | 2.97 | 4.93 |
| Filing Date | 2022-03-18 | 2023-02-24 | 2024-02-21 | 2025-02-26 | 2026-02-25 |
Income Statement Evolution
NVIDIA’s revenue surged from 27B in 2022 to 216B in 2026, marking a 702% growth. Net income expanded even faster, rising over 11-fold to 120B. Gross and EBIT margins remained robust, above 65%, reflecting scalable profitability amid rapid revenue gains. Margins improved steadily, supporting strong operational leverage throughout the period.
Is the Income Statement Favorable?
In 2026, NVIDIA posted a net margin of 55.6%, signaling high profitability. Operating expenses grew in line with revenue, preserving margin quality. Interest expense remains negligible at 0.12% of revenue, enhancing net income reliability. Despite a slight dip in net margin growth last year, overall fundamentals show a highly favorable income statement with sustained efficiency and strong bottom-line expansion.
Financial Ratios
The table below presents key financial ratios for NVIDIA Corporation over the last five fiscal years, illustrating profitability, valuation, liquidity, leverage, and efficiency metrics:
| Ratios | 2022 | 2023 | 2024 | 2025 | 2026 |
|---|---|---|---|---|---|
| Net Margin | 36% | 16% | 49% | 56% | 56% |
| ROE | 37% | 20% | 69% | 92% | 76% |
| ROIC | 25% | 12% | 51% | 75% | 66% |
| P/E | 63 | 109 | 52 | 40 | 38 |
| P/B | 23 | 22 | 36 | 37 | 29 |
| Current Ratio | 6.7 | 3.5 | 4.2 | 4.4 | 3.9 |
| Quick Ratio | 6.0 | 2.7 | 3.7 | 3.9 | 3.2 |
| D/E | 0.44 | 0.54 | 0.26 | 0.13 | 0.07 |
| Debt-to-Assets | 27% | 29% | 17% | 9% | 5% |
| Interest Coverage | 43 | 16 | 128 | 330 | 501 |
| Asset Turnover | 0.61 | 0.65 | 0.93 | 1.17 | 1.04 |
| Fixed Asset Turnover | 7.5 | 5.6 | 11.6 | 16.2 | 20.8 |
| Dividend Yield | 0.07% | 0.08% | 0.03% | 0.03% | 0.02% |
Evolution of Financial Ratios
NVIDIA’s Return on Equity (ROE) surged from 19.76% in 2023 to 76.33% in 2026, signaling robust profitability improvement. The Current Ratio remained elevated but declined slightly from 6.65 in 2022 to 3.91 in 2026, indicating still strong liquidity. Debt-to-Equity dropped sharply from 0.54 to 0.07, reflecting a significant deleveraging trend.
Are the Financial Ratios Fovorable?
In 2026, profitability ratios such as ROE (76.33%) and net margin (55.6%) are highly favorable, outperforming typical sector benchmarks. Liquidity shows mixed signals: quick ratio is favorable at 3.24, but current ratio slightly unfavorable at 3.91, suggesting cautious working capital management. Leverage ratios are low and favorable, with debt-to-equity at 0.07 and debt-to-assets at 5.34%. Market valuation ratios, including P/E (37.75) and P/B (28.81), are unfavorable, indicating a premium valuation. Overall, 64% of ratios are favorable, supporting a generally positive financial profile with some valuation risks.
Shareholder Return Policy
NVIDIA maintains a low dividend payout ratio around 0.8%, with a modest dividend per share rising steadily to $0.04 in 2026. The annual dividend yield remains below 0.03%, supported by free cash flow coverage and complemented by active share buybacks.
This conservative distribution policy aligns with NVIDIA’s focus on sustainable long-term value creation. The low payout and continued buybacks suggest prudent capital allocation, balancing shareholder returns with reinvestment in growth opportunities.
Score analysis
Here is a radar chart illustrating NVIDIA Corporation’s key financial scores for a balanced overview:
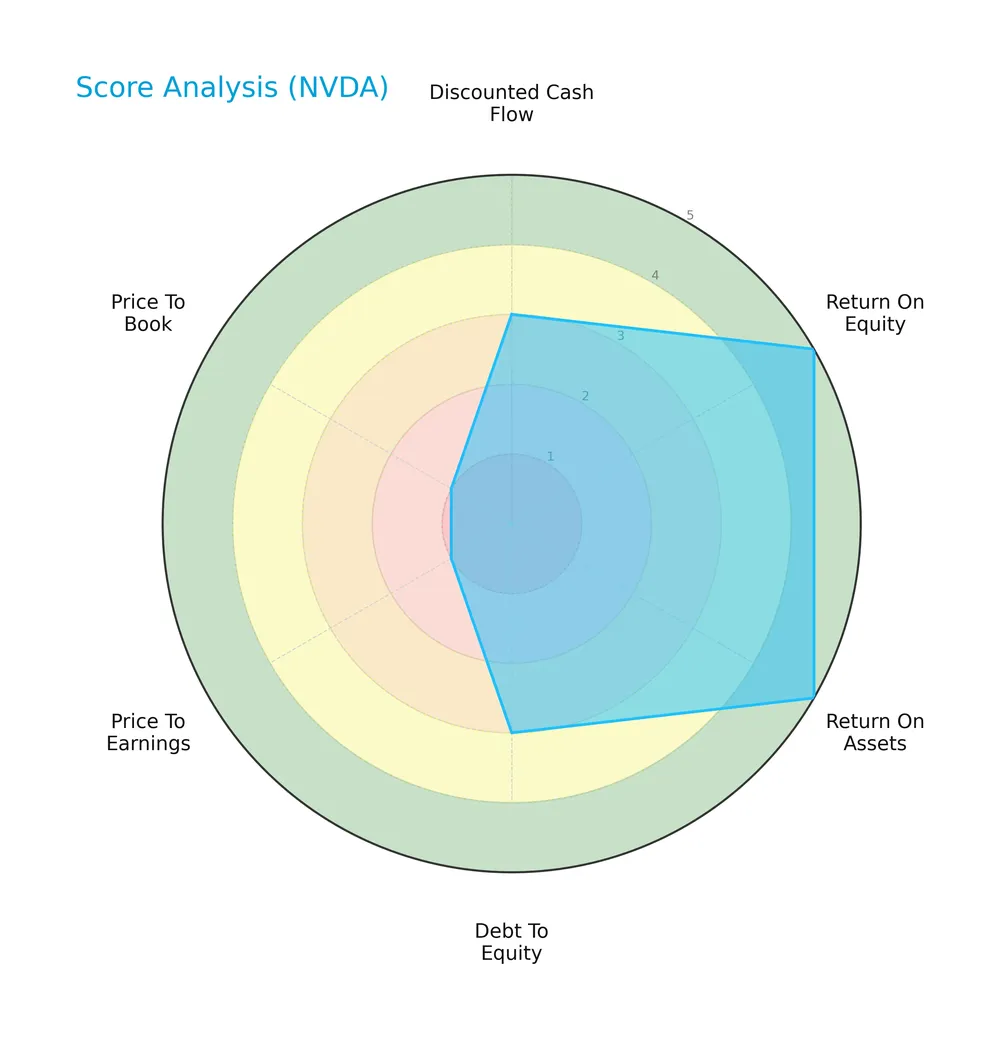
NVIDIA scores very favorably in return on equity and assets, indicating strong profitability. Debt-to-equity and discounted cash flow scores are moderate. However, valuation metrics like price-to-earnings and price-to-book are very unfavorable.
Analysis of the company’s bankruptcy risk
The Altman Z-Score places NVIDIA securely in the safe zone, indicating a very low risk of bankruptcy currently:

Is the company in good financial health?
The Piotroski Score diagram below provides insight into NVIDIA’s financial strength based on nine criteria:

With a score of 6, NVIDIA demonstrates average financial health, signaling reasonable strength but room for improvement in operational efficiency or balance sheet quality.
Competitive Landscape & Sector Positioning
This analysis explores NVIDIA Corporation’s sector positioning, revenue segments, key products, and main competitors. I will evaluate if NVIDIA holds a competitive advantage within the semiconductor industry.
Strategic Positioning
NVIDIA concentrates its portfolio in high-growth segments like Data Center ($194B) and Gaming ($16B) while maintaining exposure to Automotive ($2.35B) and Professional Visualization ($3.2B). Geographically, it focuses heavily on the U.S. ($150B) and Taiwan ($42B), with significant sales in China ($20B), reflecting a diversified yet targeted global footprint.
Revenue by Segment
This pie chart displays NVIDIA Corporation’s revenue breakdown by business segment for fiscal year 2026, illustrating which areas contribute most to the company’s top line.
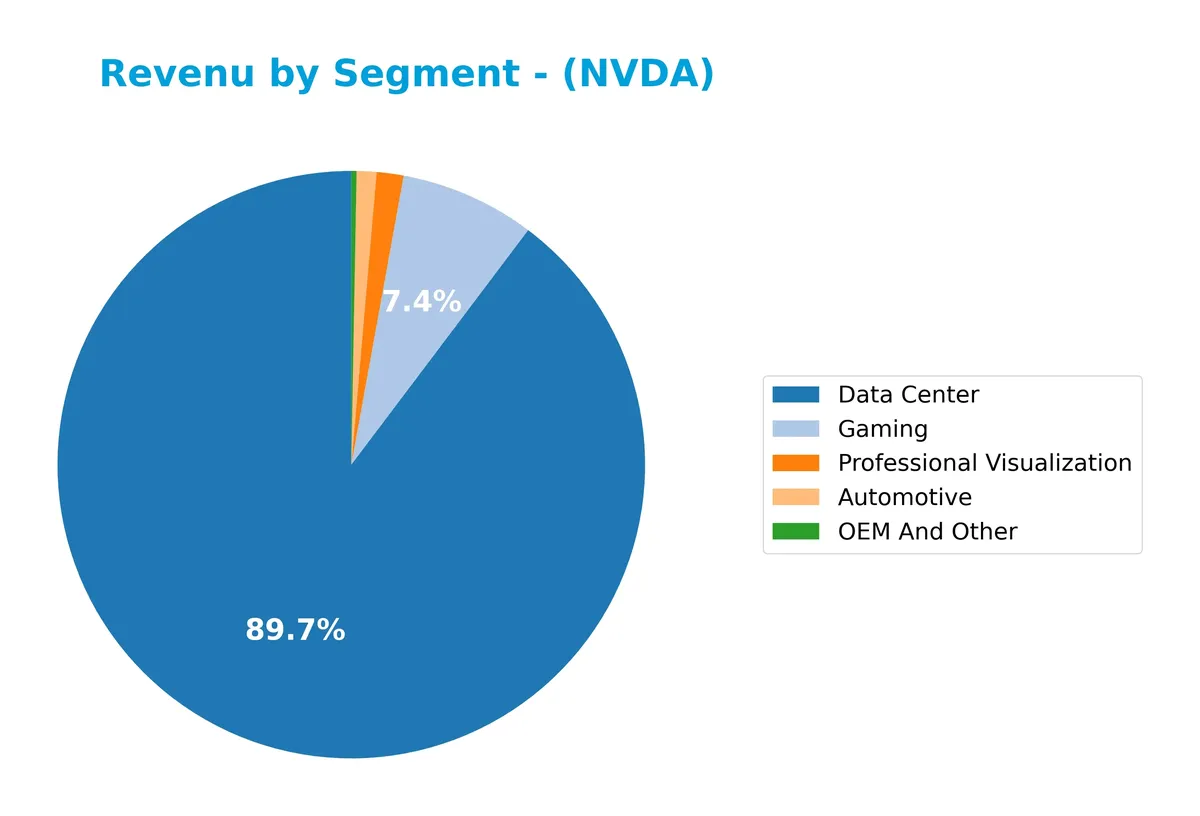
NVIDIA’s Data Center segment dominates with $194B, reflecting its critical role in driving growth amid AI and cloud demand. Gaming remains a strong contributor at $16B, though smaller by comparison. Automotive revenue surged to $2.35B, signaling expansion in autonomous vehicle tech. Professional Visualization at $3.19B also grew robustly. OEM and Other is minimal at $619M, indicating a concentrated revenue base focused on high-growth tech sectors.
Key Products & Brands
The table below details NVIDIA Corporation’s key products and brands along with their core descriptions:
| Product | Description |
|---|---|
| GeForce GPUs | Graphics processing units designed for gaming PCs and the GeForce NOW game streaming service. |
| Quadro/NVIDIA RTX GPUs | GPUs targeted at enterprise workstation graphics markets. |
| vGPU Software | Virtual GPU software enabling cloud-based visual and virtual computing. |
| Automotive Platforms | Solutions for infotainment systems and AI Cockpit, autonomous driving, and vehicle technologies. |
| Omniverse Software | Platform for building 3D designs and virtual worlds. |
| Data Center Platforms | Systems for AI, high-performance computing (HPC), and accelerated computing applications. |
| Mellanox Networking | Networking and interconnect solutions for data centers and cloud infrastructure. |
| Cryptocurrency Mining Processors | Specialized processors designed for cryptocurrency mining. |
| Jetson Platforms | Embedded AI solutions for robotics and autonomous machines. |
| NVIDIA AI Enterprise | AI software suite supporting enterprise AI workloads and deployment. |
NVIDIA’s product lineup spans gaming, professional visualization, data center, and automotive sectors. Their offerings combine hardware and software, targeting high-growth markets like AI, autonomous driving, and cloud computing.
Main Competitors
NVIDIA Corporation competes among 38 companies, with the table below listing the top 10 leaders by market capitalization:
| Competitor | Market Cap. |
|---|---|
| NVIDIA Corporation | 4.6T |
| Broadcom Inc. | 1.6T |
| Taiwan Semiconductor Manufacturing Company Limited | 1.6T |
| ASML Holding N.V. | 415B |
| Advanced Micro Devices, Inc. | 363B |
| Micron Technology, Inc. | 353B |
| Lam Research Corporation | 232B |
| Applied Materials, Inc. | 214B |
| QUALCOMM Incorporated | 185B |
| Intel Corporation | 173B |
NVIDIA ranks 1st among 38 competitors in the semiconductor industry. Its market cap exceeds the next closest rival by 190.67%, highlighting its dominant scale. The company sits well above both the average market cap of the top 10 peers (975B) and the sector median (31B). This positioning underscores NVIDIA’s leadership and robust market capitalization relative to its peers.
Comparisons with competitors
Check out how we compare the company to its competitors:
Does NVIDIA have a competitive advantage?
NVIDIA exhibits a very favorable competitive advantage, demonstrated by a ROIC exceeding WACC by over 51%, indicating strong value creation and efficient capital use. The company’s ROIC trend shows significant growth, confirming sustainable profitability and a robust economic moat.
Looking ahead, NVIDIA’s diverse product portfolio spans gaming GPUs, AI data center platforms, automotive AI, and 3D virtual world software. Expanding revenues across key global markets, including the US, Taiwan, and China, support continued growth opportunities in emerging tech sectors.
SWOT Analysis
This SWOT analysis highlights NVIDIA’s core competitive position and strategic challenges to guide investment decisions.
Strengths
- dominant AI and gaming GPU market
- superior ROIC well above WACC
- rapid revenue and earnings growth
Weaknesses
- high valuation multiples (PE 37.75, PB 28.81)
- modest dividend yield (0.02%)
- elevated beta indicating volatility
Opportunities
- expanding AI and data center demand
- growth in automotive AI and autonomous driving
- increasing international market penetration
Threats
- semiconductor supply chain risks
- intense competition from AMD and Intel
- geopolitical tensions impacting China and Taiwan markets
NVIDIA’s robust moat and accelerating profitability underpin a strong competitive advantage. However, rich valuation and external risks require cautious position sizing. The company should leverage growth in AI and automotive while managing geopolitical exposure.
Stock Price Action Analysis
The weekly chart displays NVIDIA Corporation’s stock price movements over the past 12 months, highlighting key price points and trend shifts:
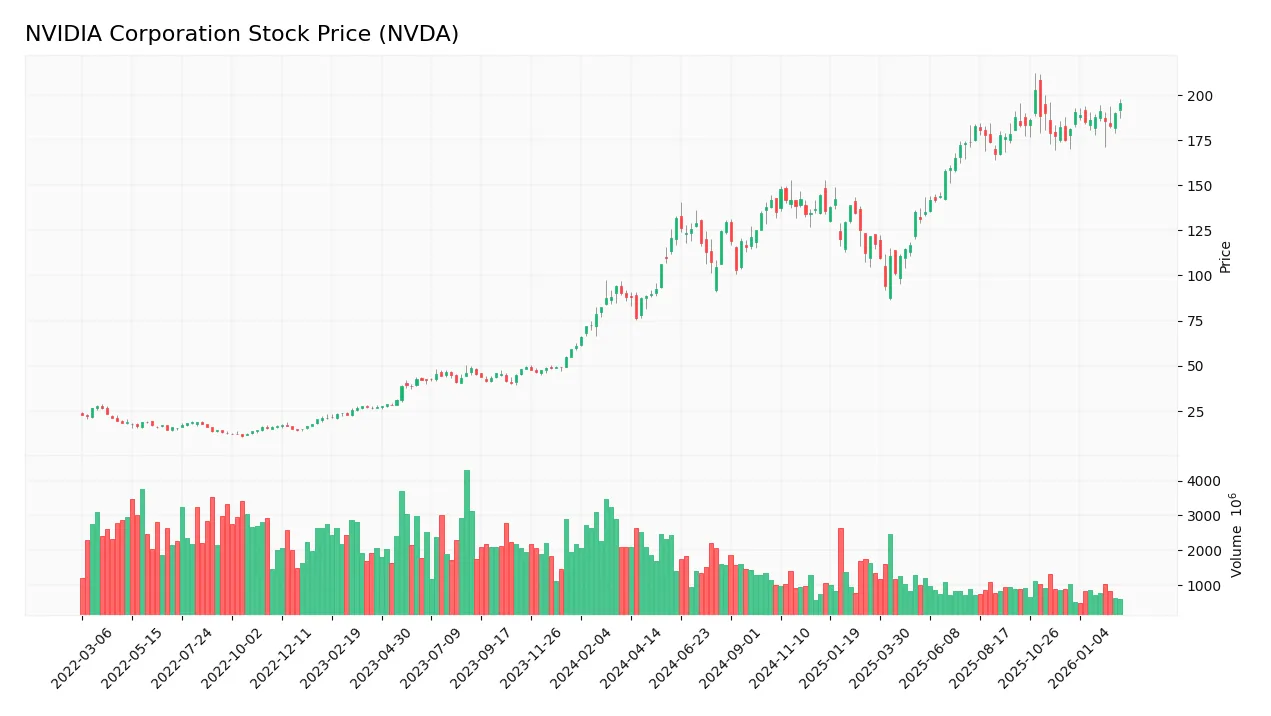
Trend Analysis
Over the past year, NVDA’s stock price surged 122.2%, indicating a strong bullish trend despite a deceleration in momentum. The price ranged from a low of 76.2 to a high of 202.49, with volatility measured by a 32.05 standard deviation. Recent three-month growth slowed to 11.74% with reduced volatility (5.14).
Volume Analysis
Trading volume shows a decreasing trend despite buyer dominance at 62.37% overall and 55.77% recently. The last three months reveal slightly buyer-driven activity, suggesting cautious optimism and moderate market participation among investors.
Target Prices
Analysts present a broad but optimistic target consensus for NVIDIA Corporation.
| Target Low | Target High | Consensus |
|---|---|---|
| 140 | 400 | 272.54 |
The wide range reflects differing views on growth sustainability, but the consensus at 272.54 suggests strong confidence in NVIDIA’s market position and future earnings potential.

Don’t Let Luck Decide Your Entry Point
Optimize your entry points with our advanced ProRealTime indicators. You’ll get efficient buy signals with precise price targets for maximum performance. Start outperforming now!
Analyst & Consumer Opinions
This section reviews analyst grades and consumer feedback to provide a balanced view of NVIDIA Corporation’s market perception.
Stock Grades
Here is a summary of recent verified analyst ratings for NVIDIA Corporation from recognized grading firms:
| Grading Company | Action | New Grade | Date |
|---|---|---|---|
| HSBC | Maintain | Buy | 2026-02-24 |
| DA Davidson | Maintain | Buy | 2026-02-23 |
| Keybanc | Maintain | Overweight | 2026-02-23 |
| Wedbush | Maintain | Outperform | 2026-02-23 |
| Needham | Maintain | Buy | 2026-02-18 |
| Jefferies | Maintain | Buy | 2026-01-16 |
| Mizuho | Maintain | Outperform | 2026-01-09 |
| Truist Securities | Maintain | Buy | 2025-12-29 |
| Stifel | Maintain | Buy | 2025-12-29 |
| B of A Securities | Maintain | Buy | 2025-12-26 |
The consensus among these established firms remains firmly positive, with most maintaining Buy ratings. Outperform and Overweight grades complement this view, reflecting steady confidence without recent upgrades or downgrades.
Consumer Opinions
NVIDIA commands strong loyalty from its user base, driven by innovation and performance, though some concerns linger.
| Positive Reviews | Negative Reviews |
|---|---|
| “NVIDIA’s GPUs deliver unmatched gaming performance and stability.” | “High prices make it tough for budget-conscious buyers.” |
| “Their drivers and software updates consistently improve experience.” | “Occasional overheating issues under heavy load.” |
| “Innovative AI and data center solutions set industry standards.” | “Customer support can be slow to respond.” |
Overall, consumers praise NVIDIA’s cutting-edge technology and reliability. However, the premium pricing and inconsistent support represent notable weaknesses.
Risk Analysis
Below is a summary of key risks facing NVIDIA Corporation, assessing likelihood and potential impact:
| Category | Description | Probability | Impact |
|---|---|---|---|
| Valuation Risk | High P/E (37.75) and P/B (28.81) ratios indicate stretched valuation relative to peers. | High | High |
| Market Volatility | Elevated beta (2.31) signals share price moves more than twice the market’s swings. | High | Medium |
| Competitive Risk | Intense competition in semiconductors and AI accelerators could pressure margins. | Medium | High |
| Supply Chain | Disruptions in semiconductor supply chains remain a sector-wide vulnerability. | Medium | Medium |
| Regulatory Risk | Geopolitical tensions affecting China and Taiwan markets could impact revenues. | Medium | High |
| Dividend Yield | Extremely low yield (0.02%) limits income appeal, possibly deterring yield-focused funds. | Low | Low |
Valuation risk stands out as the most pressing. NVIDIA’s premium multiples reflect lofty growth expectations, leaving little margin for error. Additionally, the stock’s 2.31 beta exposes investors to significant market volatility. Geopolitical and supply chain risks remain relevant but are less acute now. Overall, investors should weigh these risks against NVIDIA’s robust profitability and dominant market position.
Should You Buy NVIDIA Corporation?
NVIDIA appears to be a robust value creator with a durable competitive moat evidenced by a growing ROIC far exceeding WACC. Despite very favorable profitability and manageable leverage, its overall rating of B+ suggests moderate valuation risks that investors might consider carefully.
Strength & Efficiency Pillars
NVIDIA Corporation exhibits outstanding profitability with a net margin of 55.6% and a return on equity (ROE) of 76.33%. The return on invested capital (ROIC) stands at an impressive 66.14%, significantly exceeding the weighted average cost of capital (WACC) of 14.51%. This clearly positions NVIDIA as a strong value creator. Its gross margin of 71.07% and EBIT margin of 65.62% further reinforce operational excellence. I’ve observed that such high margins combined with efficient capital allocation often signal sustainable competitive advantages in the semiconductor sector.
Weaknesses and Drawbacks
Despite robust fundamentals, NVIDIA’s valuation metrics pose caution. The price-to-earnings ratio (37.75) and price-to-book ratio (28.81) are notably elevated, suggesting a premium market valuation that may compress returns. Although the debt-to-equity ratio is low at 0.07, indicating modest leverage, the current ratio is flagged as unfavorable at 3.91, which can hint at inefficient asset utilization. While buyer dominance remains at a healthy 55.77%, the decreasing volume trend may reflect waning market enthusiasm, introducing short-term volatility risks.
Our Final Verdict about NVIDIA Corporation
NVIDIA’s long-term fundamentals appear strong, supported by exceptional profitability and a clear moat. The bullish overall stock trend aligns with these fundamentals, but recent buyer dominance has slightly softened. This suggests a cautious, wait-and-see approach for potential investors seeking a more favorable entry point. The company’s premium valuation and decelerating volume trend may temper upside in the near term, despite its robust operational profile.
Disclaimer: This content is for informational purposes only and does not constitute financial, investment, or other professional advice. Investing in financial markets involves a significant risk of loss, and past performance is not indicative of future results.
Additional Resources
- Nvidia: Another Blockbuster Earnings Report (Rating Upgrade) (NASDAQ:NVDA) – Seeking Alpha (Feb 25, 2026)
- Nvidia, Snowflake, IonQ, Salesforce And The Trade Desk: Why These 5 Stocks Are On Investors’ Radars Today – Benzinga (Feb 26, 2026)
- NVIDIA Corporation $NVDA Shares Acquired by Guerra Advisors Inc – MarketBeat (Feb 26, 2026)
- NVDA Stock Gains After NVIDIA Posts $68.1B Q4 Revenue Beat – Eudaimonia and Co (Feb 26, 2026)
- Morgan Stanley Remains a Buy on NVIDIA Corporation (NVDA) – Yahoo Finance (Feb 25, 2026)
For more information about NVIDIA Corporation, please visit the official website: nvidia.com