Home > Analyses > Technology > NVE Corporation
NVE Corporation transforms everyday technology through its pioneering spintronic devices, which harness the quantum property of electron spin to revolutionize data acquisition and transmission. As a recognized innovator in the semiconductor industry, NVE leads with advanced sensors and couplers that serve critical roles in factory automation, medical devices, and the expanding industrial Internet of Things. With a strong foundation and cutting-edge research, the key question now is whether NVE’s growth prospects and financial health support its current market valuation.
Table of contents
Business Model & Company Overview
NVE Corporation, founded in 1989 and headquartered in Eden Prairie, Minnesota, stands as a leader in spintronics technology within the semiconductor industry. Its core mission revolves around developing and selling advanced spintronic devices that harness electron spin to acquire, store, and transmit information. This innovative ecosystem includes sensors and couplers tailored for factory automation, medical devices, and the industrial Internet of Things, positioning NVE at the forefront of nanotechnology applications globally.
The company’s revenue engine balances product sales and specialized services, with a focus on spintronic sensors and couplers that serve diverse markets in the Americas, Europe, and Asia. NVE also engages in research and development contracts and licenses cutting-edge magnetoresistive memory technology. Its strong foothold in niche applications and continuous innovation forms a robust economic moat, securing its role in shaping the future of information technology.
Financial Performance & Fundamental Metrics
In this section, I analyze NVE Corporation’s income statement, key financial ratios, and dividend payout policy to evaluate its core financial health and performance.
Income Statement
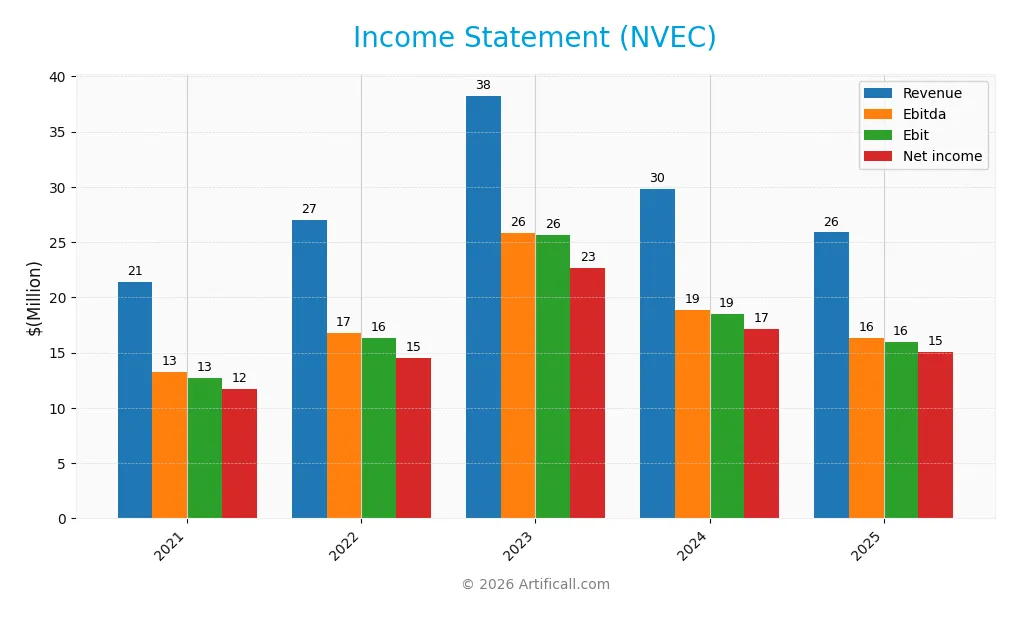
The following table presents NVE Corporation’s key income statement figures for fiscal years 2021 through 2025, reported in USD.
| 2021 | 2022 | 2023 | 2024 | 2025 | |
|---|---|---|---|---|---|
| Revenue | 21.4M | 27.0M | 38.3M | 29.8M | 25.9M |
| Cost of Revenue | 4.1M | 6.3M | 8.1M | 6.8M | 4.2M |
| Operating Expenses | 4.5M | 4.4M | 4.5M | 4.5M | 5.6M |
| Gross Profit | 17.2M | 20.7M | 30.2M | 23.0M | 21.6M |
| EBITDA | 13.3M | 16.8M | 25.8M | 18.8M | 16.3M |
| EBIT | 12.7M | 16.3M | 25.6M | 18.5M | 16.0M |
| Interest Expense | 0 | 0 | 0 | 0 | 0 |
| Net Income | 11.7M | 14.5M | 22.7M | 17.1M | 15.1M |
| EPS | 2.42 | 3.00 | 4.70 | 3.54 | 3.12 |
| Filing Date | 2021-05-05 | 2022-05-04 | 2023-05-03 | 2024-05-01 | 2025-05-07 |
Income Statement Evolution
NVE Corporation’s revenue showed a favorable overall growth of 21.1% from 2021 to 2025 but declined by 13.18% in the most recent year. Net income followed a similar trend, increasing 28.82% over the period but falling 12.15% last year. Margins remained strong, with gross margin at 83.63% and net margin steady near 58.22%, indicating stable profitability despite revenue fluctuations.
Is the Income Statement Favorable?
The 2025 fiscal year reveals generally favorable fundamentals, underscored by robust gross and EBIT margins of 83.63% and 61.81%, respectively. The company benefits from zero interest expenses, supporting a net margin of 58.22%. While recent revenue and EBIT declines are unfavorable, net margin and EPS changes were neutral to slightly negative, leading to an overall favorable income statement evaluation.
Financial Ratios
The following table presents key financial ratios for NVE Corporation (NVEC) over the fiscal years 2021 to 2025, showing profitability, valuation, liquidity, leverage, efficiency, and dividend metrics:
| Ratios | 2021 | 2022 | 2023 | 2024 | 2025 |
|---|---|---|---|---|---|
| Net Margin | 55% | 54% | 59% | 57% | 58% |
| ROE | 16% | 22% | 34% | 26% | 24% |
| ROIC | 15% | 21% | 32% | 24% | 21% |
| P/E | 29 | 18 | 18 | 25 | 20 |
| P/B | 4.8 | 4.1 | 6.0 | 6.6 | 4.9 |
| Current Ratio | 24 | 17 | 17 | 32 | 28 |
| Quick Ratio | 20 | 15 | 13 | 25 | 22 |
| D/E | 0.01 | 0.01 | 0.01 | 0.01 | 0.01 |
| Debt-to-Assets | 1.0% | 0.9% | 0.7% | 0.5% | 1.4% |
| Interest Coverage | 0 | 0 | 0 | 0 | 0 |
| Asset Turnover | 0.29 | 0.40 | 0.55 | 0.45 | 0.40 |
| Fixed Asset Turnover | 20.8 | 23.1 | 21.6 | 22.2 | 8.9 |
| Dividend Yield | 5.7% | 7.3% | 4.8% | 4.5% | 6.3% |
Note: Percentages are rounded and presented as whole numbers for clarity; decimal values are truncated to two decimals where applicable. Interest coverage is reported as zero in all years.
Evolution of Financial Ratios
Over the period from 2021 to 2025, NVE Corporation’s Return on Equity (ROE) showed an overall improvement, reaching 24.19% in 2025, indicating steady profitability growth. The Current Ratio fluctuated significantly, peaking at 32.05 in 2024 before declining to 28.4 in 2025, signaling high liquidity but some recent reduction. The Debt-to-Equity Ratio remained very low and stable at around 0.01, reflecting a conservative leverage position.
Are the Financial Ratios Favorable?
In 2025, profitability ratios such as net margin (58.22%) and ROE (24.19%) are favorable, demonstrating strong earnings performance. Liquidity appears mixed with a very high current ratio (28.4, unfavorable) but a favorable quick ratio (22.03). Leverage ratios, including debt-to-equity (0.01) and debt-to-assets (1.43%), are favorable, indicating minimal debt risk. Efficiency is less positive, with asset turnover low at 0.4. Market valuations show neutral price-to-earnings (20.46) but unfavorable price-to-book (4.95). Overall, the financial ratios are assessed as favorable.
Shareholder Return Policy
NVE Corporation consistently pays dividends with a payout ratio above 1.1x, reflecting distributions slightly exceeding net income. Dividend per share has remained steady around $4, yielding approximately 4.5% to 7.3% annually. The company’s strong free cash flow coverage near 1x supports these payments, with no mention of share buybacks.
This policy indicates a commitment to returning capital but may risk sustainability given payout ratios exceeding earnings. The absence of share repurchases suggests a focus on dividends as the primary shareholder return method. Overall, the approach balances income distribution with cash flow, though elevated payout ratios warrant cautious monitoring for long-term value preservation.
Score analysis
The following radar chart presents an overview of NVE Corporation’s key financial scores, illustrating its valuation and profitability metrics:
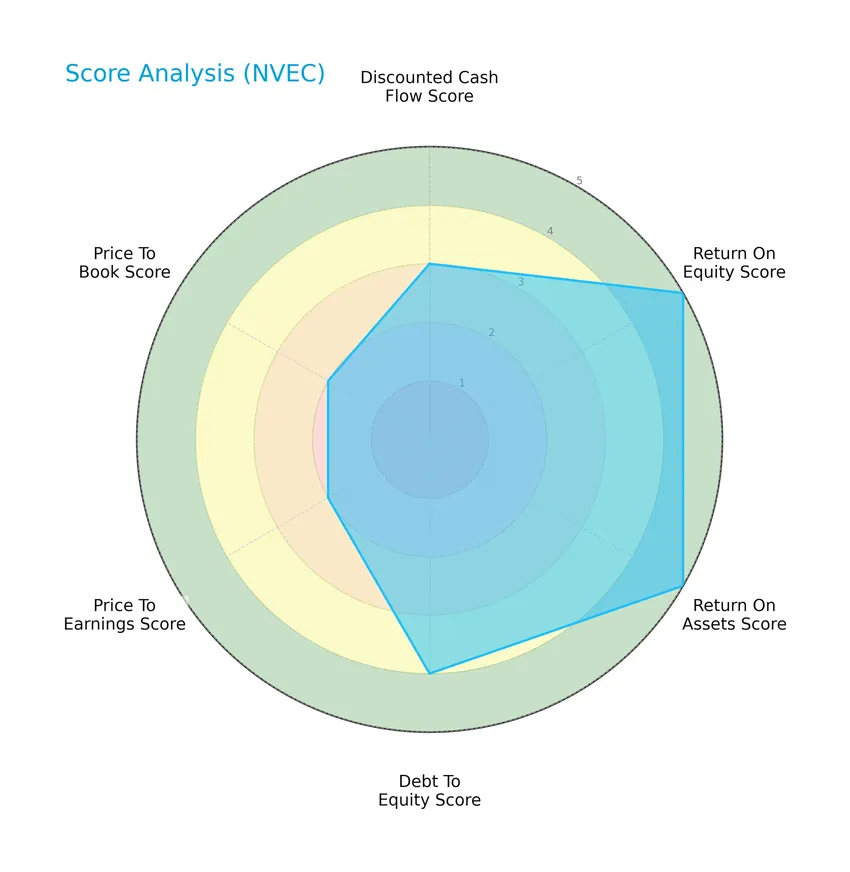
NVE Corporation shows strong returns with very favorable scores in return on equity and assets at 5 each. Its debt-to-equity position is favorable at 4, while discounted cash flow and valuation metrics like price-to-earnings and price-to-book scores are moderate, reflecting balanced financial health.
Analysis of the company’s bankruptcy risk
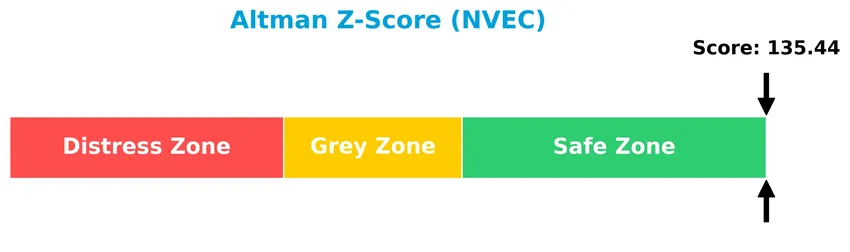
The Altman Z-Score indicates that NVE Corporation is securely positioned within the safe zone, suggesting a very low risk of bankruptcy:
Is the company in good financial health?
The Piotroski Score diagram below provides insight into NVE Corporation’s financial strength based on nine criteria:

With a Piotroski Score of 5, NVE Corporation is classified as having average financial health, indicating moderate strength but leaving room for improvement in operational and financial efficiency.
Competitive Landscape & Sector Positioning
This sector analysis will explore NVE Corporation’s strategic positioning, revenue segments, key products, and main competitors. I will assess whether NVE Corporation holds a competitive advantage within the semiconductor industry.
Strategic Positioning
NVE Corporation maintains a concentrated product portfolio focused on spintronic sensors and couplers primarily for factory automation, medical, and industrial IoT markets. Geographically, it generates significant revenue from the United States and Europe, with a moderate presence in Asia Pacific, reflecting a balanced but regionally focused market exposure.
Revenue by Segment
The pie chart illustrates NVE Corporation’s revenue distribution by segment for the fiscal year 2022, highlighting the contribution of each business area to total sales.
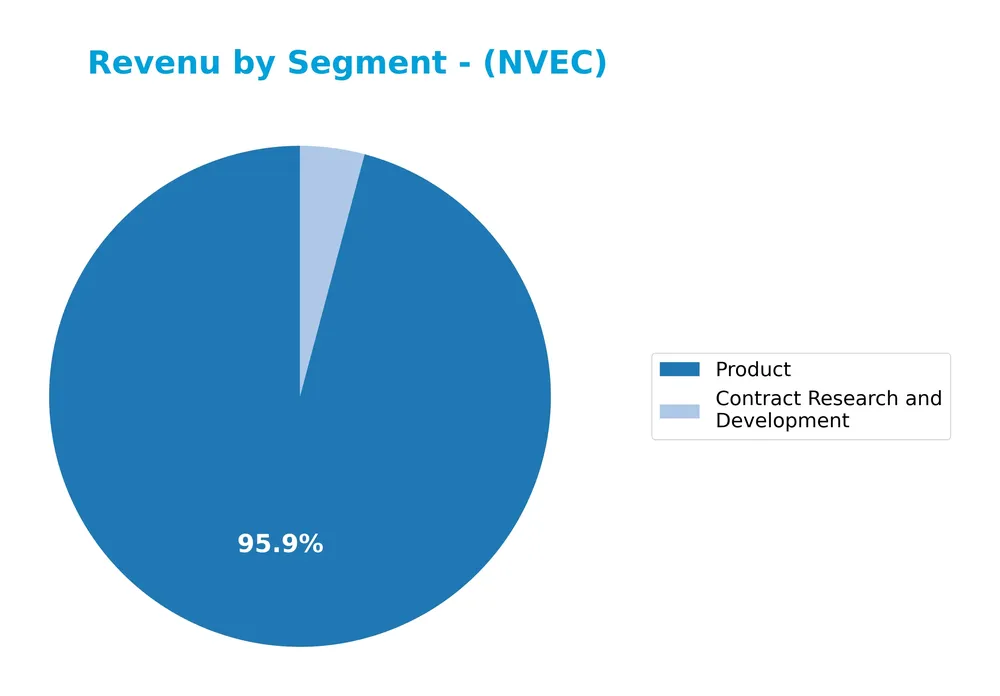
In 2022, the Product segment remained the dominant revenue driver with $25.9M, showing steady growth from previous years. Contract Research and Development contributed a smaller portion, $1.1M, after some fluctuations. The overall trend indicates a concentration in Product sales, with the contract segment experiencing variability. The recent year shows a slight acceleration in Product revenue, suggesting a continued focus and strength in this core area.
Key Products & Brands
The following table presents NVE Corporation’s main products and services offered to its markets:
| Product | Description |
|---|---|
| Spintronic Sensors | Standard sensors detecting magnetic or metallic materials for position or speed measurement, mainly for factory automation. |
| Custom and Medical Sensors | Specialized sensors designed for medical devices, replacing electromechanical magnetic switches. |
| Spintronic Couplers | Devices used in industrial Internet of Things (IoT) applications to acquire and transmit data via spintronics technology. |
| Contract Research and Development | Services involving research, development, and licensing of spintronic magnetoresistive random access memory technology. |
NVE Corporation primarily generates revenue through its spintronic product lines and contract R&D services, focusing on industrial automation, medical devices, and IoT markets.
Main Competitors
There are 38 competitors in the Technology sector, with the table below listing the top 10 leaders in Semiconductors by market capitalization:
| Competitor | Market Cap. |
|---|---|
| NVIDIA Corporation | 4.6T |
| Broadcom Inc. | 1.6T |
| Taiwan Semiconductor Manufacturing Company Limited | 1.6T |
| ASML Holding N.V. | 415B |
| Advanced Micro Devices, Inc. | 363B |
| Micron Technology, Inc. | 353B |
| Lam Research Corporation | 232B |
| Applied Materials, Inc. | 214B |
| QUALCOMM Incorporated | 185B |
| Intel Corporation | 173B |
NVE Corporation ranks 38th among 38 competitors in the semiconductor industry, with a market cap only 0.01% of the leading NVIDIA Corporation. It is positioned well below both the average market cap of the top 10 competitors (975B) and the sector median (31B). The company is 40.37% smaller than its nearest competitor above, highlighting a significant gap in scale.
Comparisons with competitors
Check out how we compare the company to its competitors:
Does NVEC have a competitive advantage?
NVE Corporation presents a clear competitive advantage, demonstrated by an 11.7% ROIC above its WACC and a strong 44.7% ROIC growth trend, indicating efficient use of capital and value creation. Its high profitability margins, including an 83.6% gross margin and 58.2% net margin, further support this position despite recent revenue declines.
Looking ahead, NVEC’s focus on spintronic technology for factory automation, medical devices, and the industrial Internet of Things market suggests opportunities for expansion and innovation. The company’s engagement in R&D and licensing of magnetoresistive memory technology positions it well to capitalize on emerging nanotechnology applications.
SWOT Analysis
This analysis highlights NVE Corporation’s key internal and external factors to guide informed investment decisions.
Strengths
- High gross margin at 83.6%
- Strong net margin of 58.2%
- Very low debt with 1.4% debt-to-assets
Weaknesses
- Recent 13% revenue decline
- Low asset turnover at 0.4
- Elevated price-to-book ratio at 4.95
Opportunities
- Growing demand in industrial IoT sensors
- Expansion in medical device applications
- Increasing ROIC indicating value creation
Threats
- Semiconductor market volatility
- Competition from larger tech firms
- Potential supply chain disruptions
Overall, NVE Corporation demonstrates solid profitability and a durable competitive advantage, but recent revenue declines and efficiency issues warrant caution. Strategic focus should be on leveraging growth opportunities in IoT and medical sectors while managing market and operational risks carefully.
Stock Price Action Analysis
The following weekly chart illustrates NVE Corporation’s stock price movements over the past 100 weeks with focus on recent momentum:
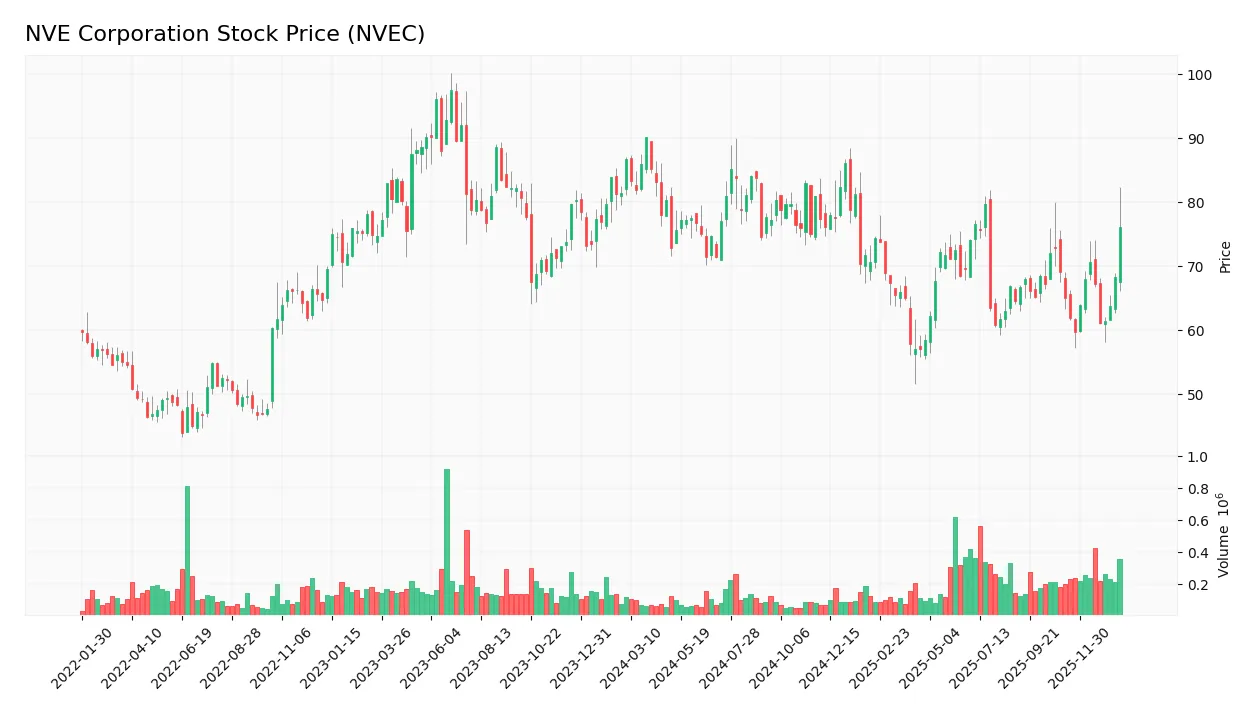
Trend Analysis
Over the past 12 months, NVEC’s stock price declined by 12.28%, indicating a bearish trend with accelerating downward momentum. The price fluctuated between a high of 90.18 and a low of 56.99, with volatility reflected in a standard deviation of 7.7. However, since November 2025, the trend reversed gaining 17.16% with a moderate slope of 0.6 and reduced volatility at 4.51.
Volume Analysis
Trading volume over the last three months shows increasing activity with total volume dominated by buyers at 57.64%. Buyer volume reached 1.8M shares compared to 1.3M sellers, suggesting slightly buyer-driven sentiment and growing market participation during the recent uptrend.
Target Prices
No verified target price data is available from recognized analysts for NVE Corporation (NVEC). Investors should rely on fundamental analysis and market conditions when considering this stock.

Don’t Let Luck Decide Your Entry Point
Optimize your entry points with our advanced ProRealTime indicators. You’ll get efficient buy signals with precise price targets for maximum performance. Start outperforming now!
Analyst & Consumer Opinions
This section examines the latest analyst ratings and consumer feedback for NVE Corporation (NVEC) to provide insight.
Stock Grades
No verified stock grades were available from recognized analysts for NVE Corporation (NVEC). Consequently, there is no current consensus on the stock’s rating from established grading firms.
Consumer Opinions
NVE Corporation (NVEC) has garnered a mix of consumer sentiments that reflect both appreciation for its innovative products and some concerns regarding customer service.
| Positive Reviews | Negative Reviews |
|---|---|
| “NVE’s spintronic sensors deliver exceptional precision and have improved our product reliability significantly.” | “Customer support response times are slower than expected, which can delay project timelines.” |
| “The company’s commitment to R&D is evident in their cutting-edge technology offerings.” | “Pricing can be on the higher side compared to competitors, making budget allocation challenging.” |
| “Products have shown excellent durability in harsh environments, which is crucial for our applications.” | “Some users find the integration process complex without sufficient technical guidance.” |
Overall, consumers appreciate NVE Corporation’s advanced technology and product reliability but often point to challenges in customer support and pricing as areas needing improvement.
Risk Analysis
Below is a summary table outlining the key risks associated with NVE Corporation, highlighting their probability and potential impact:
| Category | Description | Probability | Impact |
|---|---|---|---|
| Market Volatility | NVEC’s beta of 1.196 indicates higher sensitivity to market fluctuations, affecting stock price. | Medium | Medium |
| Valuation Risk | Price-to-book ratio at 4.95 is unfavorable, suggesting potential overvaluation risk. | Medium | High |
| Liquidity Risk | Extremely high current ratio (28.4) may indicate inefficient asset use, potentially impacting operations. | Low | Medium |
| Industry Risk | Semiconductor sector is cyclical and subject to rapid technological change and competition. | High | High |
| Concentration Risk | Small employee base (41) could limit scalability and operational resilience. | Medium | Medium |
| Dividend Risk | Dividend yield at 6.28% is moderate but may be pressured under adverse conditions. | Low | Low |
The most significant risks for NVE Corporation lie in its exposure to semiconductor industry cyclicality and its relatively high price-to-book ratio, which could signal an overvalued stock. Market sensitivity due to its beta above 1 also suggests moderate volatility risk. Despite strong financial health and a safe Altman Z-Score, investors should monitor sector trends and valuation carefully.
Should You Buy NVE Corporation?
NVE Corporation appears to be a robust value creator with a durable competitive moat supported by growing ROIC. Despite moderate liquidity ratios, its leverage profile seems manageable, and the overall rating of A- suggests a favorable financial health, though valuation metrics might warrant caution.
Strength & Efficiency Pillars
NVE Corporation demonstrates robust profitability and value creation, with a commanding net margin of 58.22% and a return on equity (ROE) of 24.19%. Its return on invested capital (ROIC) stands at 21.14%, significantly exceeding the weighted average cost of capital (WACC) of 9.47%, confirming the company as a clear value creator. Financial health is strong, supported by an Altman Z-Score of 135.44, placing the firm well within the safe zone, and a Piotroski score of 5, indicating average but stable fundamentals. This blend of high margins, efficient capital use, and solid solvency underscores NVE’s operational strength.
Weaknesses and Drawbacks
Despite its solid fundamentals, NVE faces notable challenges. The company’s price-to-book (P/B) ratio at 4.95 is elevated, signaling potential overvaluation relative to its book value, while the price-to-earnings (P/E) ratio of 20.46 is moderate but warrants caution given recent market dynamics. The current ratio is an extreme 28.4, which, although implying liquidity, may reflect inefficient asset management. Market pressure has recently been bearish with a 12.28% price decline overall, although recent buyer dominance at 57.64% suggests some recovery. These factors introduce risks related to valuation and market sentiment.
Our Verdict about NVE Corporation
NVE Corporation’s long-term fundamental profile is favorable, supported by strong profitability and value creation metrics. The overall market trend has been bearish, but recent buyer dominance and price acceleration might suggest emerging positive momentum. Given the mixed signals of valuation concerns and improving market interest, the stock could appear attractive for long-term exposure but may also warrant a cautious, watchful approach to identify optimal entry points.
Disclaimer: This content is for informational purposes only and does not constitute financial, investment, or other professional advice. Investing in financial markets involves a significant risk of loss, and past performance is not indicative of future results.
Additional Resources
- NVE Corporation: Reliable Sensor Business, Unreliable Dividend Math (NASDAQ:NVEC) – Seeking Alpha (Jan 23, 2026)
- Why NVE Corporation Popped Today – The Motley Fool (Jan 22, 2026)
- NVE Corporation Reports Third Quarter Results and Announces Quarterly Dividend – Business Wire (Jan 21, 2026)
- NVE Corporation targets medical device miniaturization with new wafer-level chip scale sensor as distributor sales rebound – MSN (Jan 23, 2026)
- NVE Corporation (NVEC) Reports Strong Q4 Revenue Growth – GuruFocus (Jan 21, 2026)
For more information about NVE Corporation, please visit the official website: nve.com