Home > Analyses > Basic Materials > Nucor Corporation
Nucor transforms raw materials into essential steel products that underpin infrastructure and industry across North America. Renowned for its electric arc furnace technology, Nucor leads the steel sector with innovative, high-quality solutions spanning construction, automotive, and energy markets. Its integrated operations and agile capital allocation distinguish it in a capital-intensive industry. As the steel market faces cyclical pressures and evolving demand, I examine whether Nucor’s strong fundamentals justify its current valuation and growth outlook.
Table of contents
Business Model & Company Overview
Nucor Corporation, founded in 1958 and headquartered in Charlotte, North Carolina, dominates the steel industry with a broad ecosystem of integrated steel products. Its portfolio spans hot-rolled and cold-rolled sheets, structural steel, and specialized bars, all serving diverse sectors from construction to automotive. This comprehensive product mix underpins Nucor’s competitive advantage as a versatile steel manufacturer.
The company’s revenue engine balances steel mill production, steel products fabrication, and raw materials supply, including direct reduced iron and scrap metal processing. Nucor operates strategically across the US, Canada, and Mexico, optimizing distribution through an extensive sales network. Its vertically integrated model creates a robust economic moat, positioning Nucor as a cornerstone shaping the future of North American steel.
Financial Performance & Fundamental Metrics
I analyze Nucor Corporation’s income statement, key financial ratios, and dividend payout policy to assess its operational efficiency and shareholder value.
Income Statement
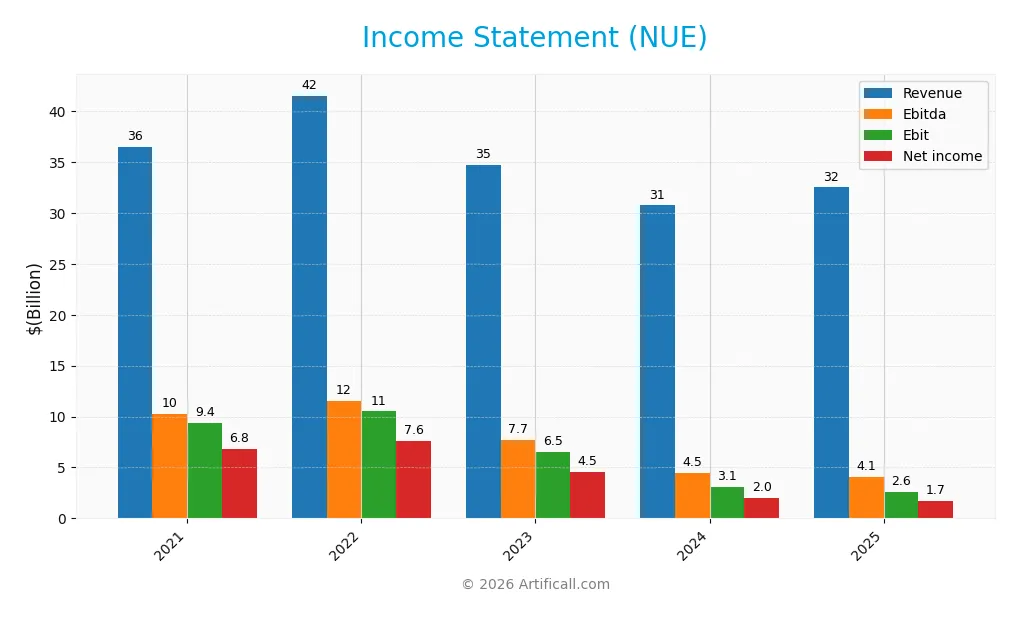
The table below presents Nucor Corporation’s key income statement figures for fiscal years 2021 through 2025, highlighting revenue, profitability, and earnings per share trends.
| 2021 | 2022 | 2023 | 2024 | 2025 | |
|---|---|---|---|---|---|
| Revenue | 36.48B | 41.51B | 34.71B | 30.73B | 32.49B |
| Cost of Revenue | 25.46B | 29.01B | 26.90B | 26.63B | 28.62B |
| Operating Expenses | 1.71B | 2.00B | 1.59B | 1.12B | 1.22B |
| Gross Profit | 11.03B | 12.50B | 7.82B | 4.10B | 3.88B |
| EBITDA | 10.23B | 11.57B | 7.69B | 4.49B | 4.11B |
| EBIT | 9.36B | 10.51B | 6.52B | 3.13B | 2.63B |
| Interest Expense | 163M | 219M | 246M | 228M | 59M |
| Net Income | 6.83B | 7.61B | 4.53B | 2.03B | 1.74B |
| EPS | 23.23 | 28.88 | 18.05 | 8.47 | 7.53 |
| Filing Date | 2022-02-28 | 2023-03-01 | 2024-02-27 | 2025-02-27 | 2026-02-25 |
Income Statement Evolution
Nucor’s revenue declined by 11% over 2021-2025, with a modest 5.7% rebound in 2025. Gross profit decreased 5.5% year-over-year, reflecting margin pressure. Operating expenses grew in line with revenue, eroding EBIT by 16% last year. Net income and margins contracted sharply, down 74% and 71% respectively over the full period, signaling weakening profitability.
Is the Income Statement Favorable?
In 2025, Nucor’s net margin remained favorable at 5.4%, supported by low interest expense at 0.18% of revenue. However, declines in gross profit, EBIT, and EPS indicate operational challenges. Despite stable revenue growth, profitability metrics deteriorated, leading me to assess the income statement fundamentals as generally unfavorable given sustained margin compression and net income decline.
Financial Ratios
The table below summarizes Nucor Corporation’s key financial ratios for 2021 through 2025, highlighting profitability, liquidity, leverage, and efficiency metrics:
| Ratios | 2021 | 2022 | 2023 | 2024 | 2025 |
|---|---|---|---|---|---|
| Net Margin | 18.6% | 18.3% | 13.0% | 6.6% | 5.4% |
| ROE | 48.7% | 41.3% | 21.6% | 10.0% | 8.3% |
| ROIC | 33.7% | 29.4% | 15.8% | 7.9% | 6.7% |
| P/E | 4.9 | 4.5 | 9.6 | 13.7 | 21.6 |
| P/B | 2.38 | 1.88 | 2.08 | 1.37 | 1.80 |
| Current Ratio | 2.48 | 3.39 | 3.57 | 2.51 | 2.94 |
| Quick Ratio | 1.32 | 2.13 | 2.35 | 1.48 | 1.57 |
| D/E | 0.41 | 0.36 | 0.33 | 0.34 | 0.34 |
| Debt-to-Assets | 22.0% | 20.6% | 19.4% | 20.5% | 20.3% |
| Interest Coverage | 57.1 | 48.0 | 25.3 | 13.1 | 45.1 |
| Asset Turnover | 1.41 | 1.28 | 0.98 | 0.91 | 0.93 |
| Fixed Asset Turnover | 4.50 | 4.32 | 3.14 | 2.32 | 2.12 |
| Dividend Yield | 1.45% | 1.54% | 1.18% | 1.88% | 1.36% |
The net margin and returns (ROE, ROIC) show a declining trend from 2022 to 2025, reflecting reduced profitability. Leverage ratios remain relatively stable, with debt-to-equity around 0.34 and debt-to-assets near 20%. Liquidity remains solid, with current and quick ratios above 1.4 in all years. Interest coverage is strong but volatile. Asset turnover indicates a gradual decrease in efficiency in recent years. Dividend yield fluctuates modestly around 1.3%-1.9%.
Evolution of Financial Ratios
Nucor’s Return on Equity (ROE) declined sharply from 48.7% in 2021 to 8.3% in 2025, signaling weakened profitability. The Current Ratio improved steadily, reaching 2.94 in 2025, indicating stronger liquidity. Debt-to-Equity remained stable around 0.34, reflecting consistent leverage management despite profitability erosion.
Are the Financial Ratios Fovorable?
In 2025, Nucor’s profitability ratios, including ROE and net margin, appear neutral to unfavorable compared to industry standards. Liquidity is favorable, with strong current and quick ratios above 1.5. Leverage metrics, such as debt-to-equity and interest coverage, are solidly favorable. Efficiency ratios like asset turnover are neutral, while market valuation ratios are also neutral, leading to a slightly favorable overall profile.
Shareholder Return Policy
Nucor Corporation maintains a consistent dividend policy with a payout ratio near 29% in 2025 and a dividend yield of about 1.36%. Dividend distributions are supported by operating cash flow, though free cash flow is slightly negative, signaling cautious capital allocation.
The company also engages in share buybacks to return capital. This balanced approach of dividends plus buybacks aligns with sustaining shareholder value. However, the negative free cash flow coverage flags a potential risk if capital expenditures or market conditions shift unfavorably.
Score analysis
The following radar chart illustrates Nucor Corporation’s key financial score metrics:
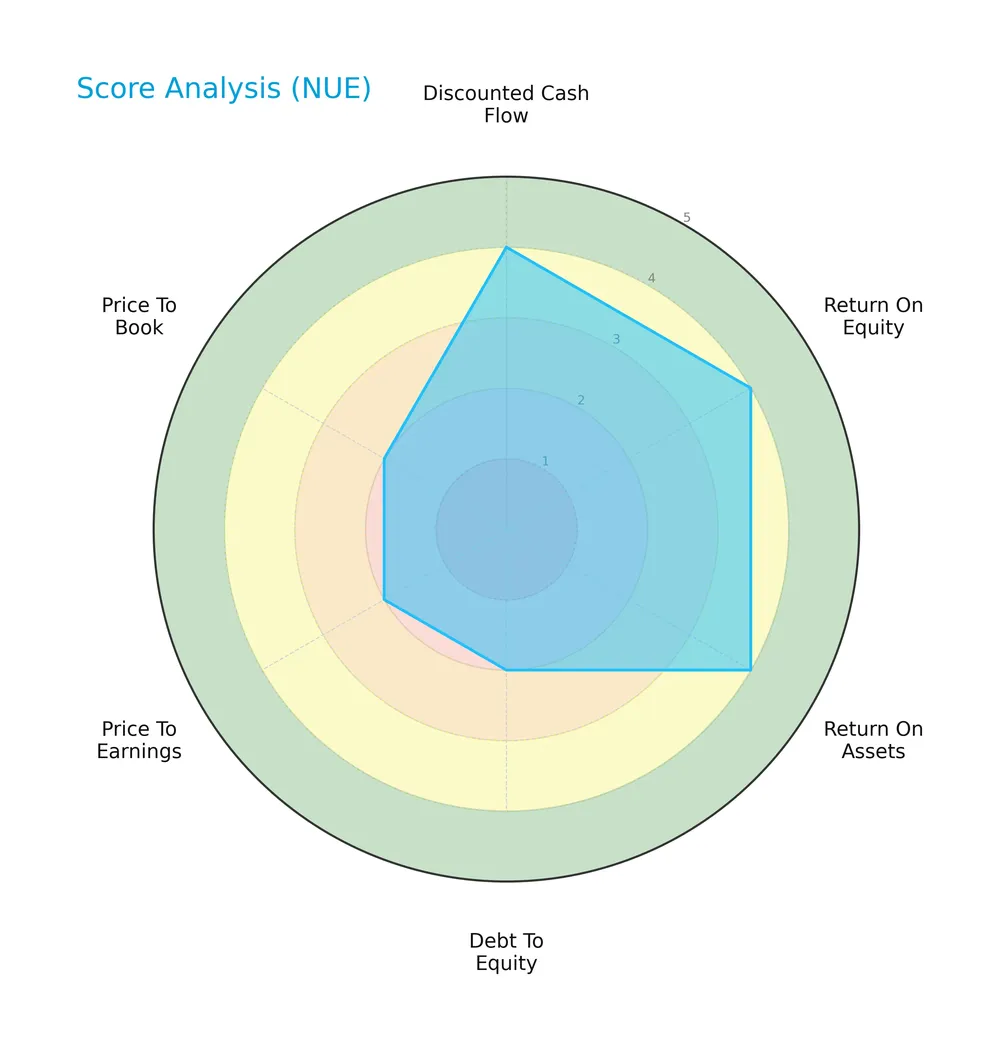
Nucor scores favorably on discounted cash flow, return on equity, and return on assets, each rated 4. However, its debt-to-equity, price-to-earnings, and price-to-book scores lag at 2, signaling valuation and leverage concerns.
Analysis of the company’s bankruptcy risk
Nucor’s Altman Z-Score of 4.56 places it securely in the safe zone, indicating a low risk of bankruptcy:

Is the company in good financial health?
The Piotroski Score diagram summarizes Nucor’s strong financial health and operational efficiency:

With a Piotroski Score of 8, Nucor demonstrates very strong financial health, reflecting robust profitability, liquidity, and prudent leverage management.
Competitive Landscape & Sector Positioning
This analysis explores Nucor Corporation’s strategic positioning, revenue segments, and product offerings within the steel industry. I will evaluate the company’s competitive advantages relative to its main rivals.
Strategic Positioning
Nucor Corporation concentrates primarily on steel manufacturing with a diversified product portfolio spanning sheet, bar, plate, structural, tubular, and fabricated steel products. Its geographic exposure centers on North America, serving the US, Canada, and Mexico markets.
Revenue by Segment
The pie chart illustrates Nucor Corporation’s revenue breakdown by product segment for fiscal year 2025, reflecting the diverse sources driving its steel manufacturing business.
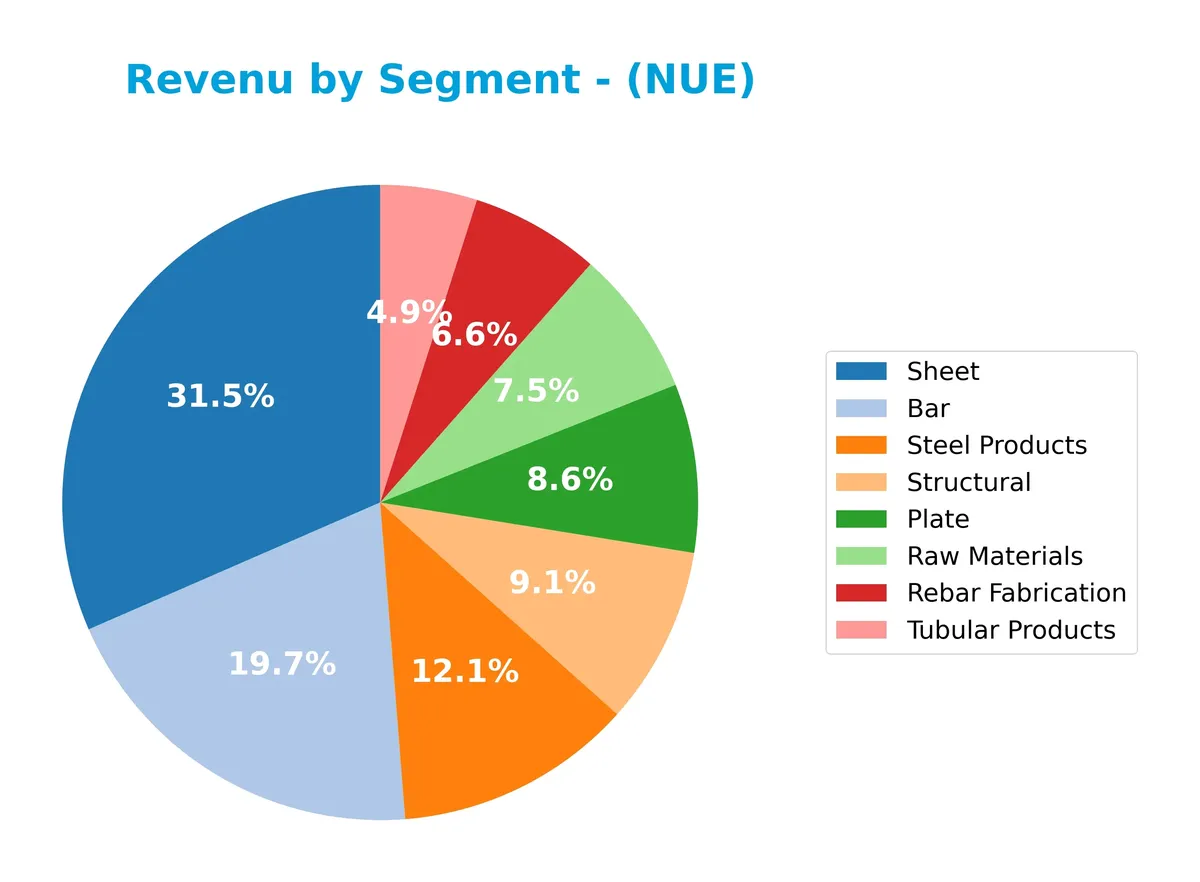
Sheet leads as the largest segment with $9.2B, followed by Bar at $5.7B and Steel Products at $3.5B. Plate and Raw Materials also contribute significantly, each above $2B. Notably, Rebar Fabrication and Structural segments remain sizable but show slower growth. The revenue mix in 2025 suggests a slight concentration in Sheet and Bar products, highlighting their critical role in Nucor’s portfolio amid a stable but competitive steel industry.
Key Products & Brands
The table below outlines Nucor Corporation’s main products and brands, highlighting their market offerings:
| Product | Description |
|---|---|
| Bar | Steel bars including blooms, billets, concrete reinforcing, merchant bars, and special bar quality. |
| Steel Products | Hollow structural steel tubing, electrical conduits, steel racking, joists, decks, fasteners, and wire. |
| Plate | Plate steel products used in various heavy construction and industrial applications. |
| Raw Materials | Direct reduced iron (DRI), ferrous/nonferrous scrap, pig iron, ferro-alloys, and natural gas drilling. |
| Rebar Fabrication | Fabricated concrete reinforcing steel bars for construction and infrastructure projects. |
| Sheet | Hot-rolled, cold-rolled, and galvanized sheet steel products. |
| Structural | Wide-flange beams, beam blanks, H-piling, and sheet piling steel structural products. |
| Tubular Products | Steel tubing products for structural and industrial use. |
Nucor’s product portfolio spans primary steel mills outputs and fabricated steel products. This broad range supports diverse industries including construction, infrastructure, and manufacturing.
Main Competitors
There are 2 competitors in total; the table below lists the top 10 leaders by market capitalization:
| Competitor | Market Cap. |
|---|---|
| Nucor Corporation | 38.8B |
| Steel Dynamics, Inc. | 25.7B |
Nucor Corporation ranks 1st among its competitors, with a market cap 3.6% above the top player benchmark. It stands above both the average market cap of the top 10 and the sector median. The company’s market cap is 56.2% higher than its closest rival, Steel Dynamics, indicating a clear lead in the steel industry.
Comparisons with competitors
Check out how we compare the company to its competitors:
Does Nucor have a competitive advantage?
Nucor does not currently present a competitive advantage. Its return on invested capital (ROIC) is significantly below its weighted average cost of capital (WACC), indicating value destruction and declining profitability over 2021-2025.
The company operates across diversified steel segments in North America, serving multiple industries. Future opportunities may arise from expanding product lines and markets, but current financial trends suggest ongoing challenges in sustaining profitability.
SWOT Analysis
This analysis highlights Nucor Corporation’s core competitive position and strategic challenges.
Strengths
- strong liquidity ratios
- low debt levels
- diversified steel product portfolio
Weaknesses
- declining ROIC below WACC
- negative income growth trends
- moderate net margin
Opportunities
- expansion in nonresidential construction
- rising demand for green steel
- increased scrap metal recycling
Threats
- volatile steel prices
- high beta indicating market sensitivity
- global trade tensions affecting supply chains
Nucor’s solid liquidity and product diversity provide resilience, but deteriorating profitability signals caution. Strategic focus should leverage growth in sustainable steel and recycling to offset margin pressure and macro risks.
Stock Price Action Analysis
The weekly chart displays Nucor Corporation’s stock price movements over the last 12 months, highlighting key fluctuations and trend changes:
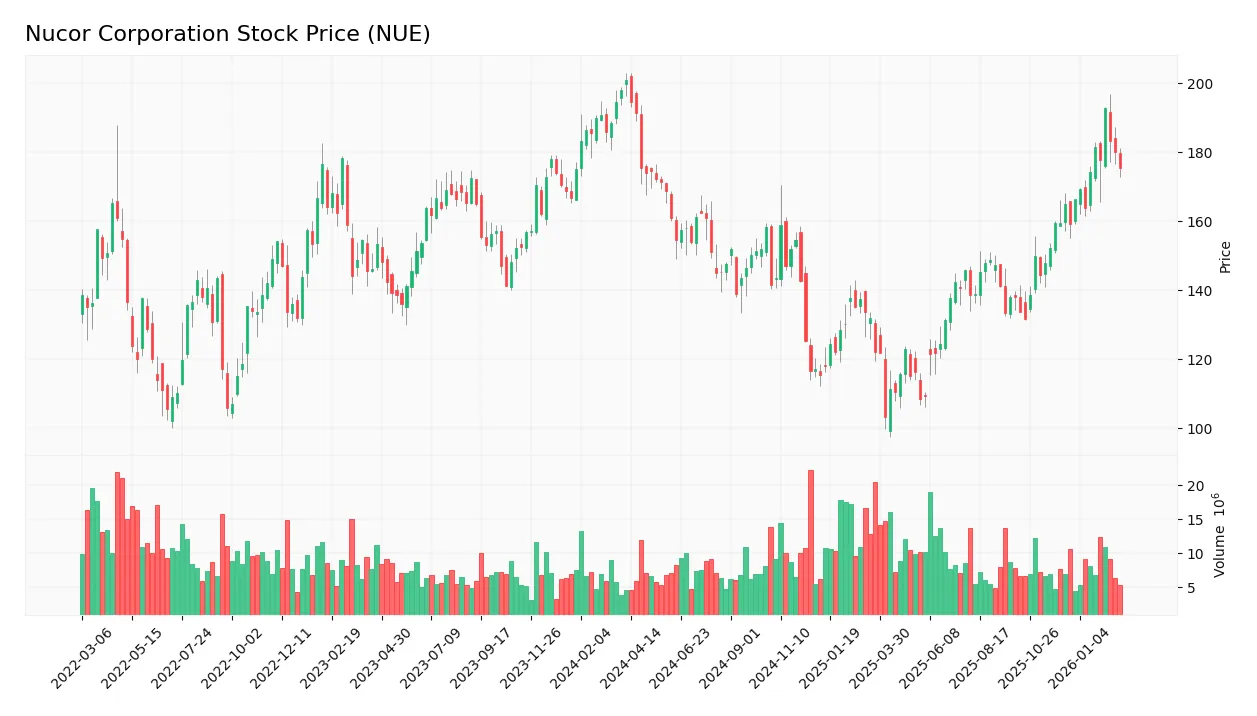
Trend Analysis
Over the past 12 months, Nucor’s stock declined by 12.68%, confirming a bearish trend with accelerating downward momentum. The price ranged from a high of 201 to a low of 103. Volatility remains elevated, reflected by a 21.21 standard deviation, indicating notable price swings.
Volume Analysis
Trading volume has increased overall, with buyers accounting for 54.5% of activity historically. However, in the recent three months, sellers slightly dominated at 55.5%. This shift suggests cautious investor sentiment and modest selling pressure despite growing market participation.
Target Prices
Analysts set a clear target consensus indicating confidence in Nucor Corporation’s stock performance.
| Target Low | Target High | Consensus |
|---|---|---|
| 176 | 183 | 180 |
The target prices suggest moderate upside potential with a tight range. Analysts expect steady growth near 180, reflecting confidence in Nucor’s market position.

Don’t Let Luck Decide Your Entry Point
Optimize your entry points with our advanced ProRealTime indicators. You’ll get efficient buy signals with precise price targets for maximum performance. Start outperforming now!
Analyst & Consumer Opinions
This section examines Nucor Corporation’s recent analyst grades and consumer feedback to gauge market sentiment.
Stock Grades
Here are the latest verified analyst grades for Nucor Corporation reflecting recent consensus views:
| Grading Company | Action | New Grade | Date |
|---|---|---|---|
| Wells Fargo | Maintain | Overweight | 2026-01-28 |
| Morgan Stanley | Downgrade | Equal Weight | 2026-01-09 |
| Wells Fargo | Maintain | Overweight | 2025-12-18 |
| Wells Fargo | Maintain | Overweight | 2025-12-15 |
| Jefferies | Maintain | Buy | 2025-12-10 |
| JP Morgan | Maintain | Overweight | 2025-12-05 |
| Wells Fargo | Upgrade | Overweight | 2025-11-14 |
| Citigroup | Maintain | Buy | 2025-10-30 |
| UBS | Maintain | Buy | 2025-10-29 |
| Wells Fargo | Maintain | Equal Weight | 2025-10-29 |
The overall analyst sentiment remains positive, with most maintaining overweight or buy ratings. Morgan Stanley’s recent downgrade to equal weight slightly tempers this optimism but does not shift the broader consensus.
Consumer Opinions
Nucor Corporation commands a loyal customer base, yet faces pointed critiques on service consistency.
| Positive Reviews | Negative Reviews |
|---|---|
| High-quality steel products with reliable durability | Occasional delays in order fulfillment |
| Competitive pricing compared to industry peers | Customer service response times can lag |
| Strong commitment to sustainability initiatives | Some complaints about product customization limitations |
Overall, consumers praise Nucor for product quality and pricing. However, recurring issues with delivery speed and customer support temper enthusiasm. Addressing these gaps could enhance client retention and brand loyalty.
Risk Analysis
Below is a summary of key risks facing Nucor Corporation, including their likelihood and potential impact:
| Category | Description | Probability | Impact |
|---|---|---|---|
| Market Volatility | Steel price fluctuations driven by global demand shifts | High | High |
| Operational Risk | Production disruptions from raw material supply chain | Medium | Medium |
| Financial Risk | WACC (10.86%) exceeds ROIC (6.74%), raising capital costs | Medium | High |
| Competitive Risk | Pressure from low-cost steel producers globally | High | Medium |
| Regulatory Risk | Environmental regulations impacting production costs | Medium | Medium |
Nucor faces significant risks from volatile steel prices and rising capital costs. Its WACC surpassing ROIC signals capital allocation challenges. However, strong liquidity ratios and a safe Altman Z-Score (4.56) provide a buffer against financial distress. Vigilance on operational disruptions remains crucial.
Should You Buy Nucor Corporation?
Nucor appears to be a company with improving profitability yet a very unfavorable moat, as its declining ROIC suggests value destruction. Despite a manageable leverage profile, its overall B+ rating indicates a cautiously favorable financial health profile.
Strength & Efficiency Pillars
Nucor Corporation shows operational resilience with a net margin of 5.37% and an interest expense ratio of 0.18%, indicating controlled financing costs. The company maintains a moderate ROIC of 6.74%, though this is below its WACC of 10.86%, signaling value erosion rather than creation. While return on equity sits at a modest 8.33%, the Altman Z-Score of 4.56 places Nucor securely in the safe zone, underlining solid solvency despite margin pressures.
Weaknesses and Drawbacks
Nucor faces notable challenges, including an unfavorable decline in profitability metrics like EBIT and net margin growth over recent periods. Valuation multiples appear neutral with a P/E of 21.58 and P/B of 1.8, but the company’s ROIC trailing WACC by over 4 percentage points signals value destruction. The stock’s overall bearish trend (-12.68%) paired with recent slight seller dominance (44.54% buyer volume) adds short-term market pressure, warranting cautious sentiment.
Our Final Verdict about Nucor Corporation
Nucor maintains a fundamentally stable financial footing with a safe Altman Z-Score and a very strong Piotroski score of 8. However, its declining profitability and bearish overall price trend suggest caution. Despite recent slight seller dominance, the profile might appear attractive for investors prioritizing balance sheet safety and long-term turnaround potential, but patience for improved market signals is advisable.
Disclaimer: This content is for informational purposes only and does not constitute financial, investment, or other professional advice. Investing in financial markets involves a significant risk of loss, and past performance is not indicative of future results.
Additional Resources
- Decoding Nucor Corp (NUE): A Strategic SWOT Insight – GuruFocus (Feb 26, 2026)
- 11,282 Shares in Nucor Corporation $NUE Bought by Fox Run Management L.L.C. – MarketBeat (Feb 25, 2026)
- NUCOR CORP SEC 10-K Report – TradingView (Feb 25, 2026)
- Why Is Nucor (NUE) Up 0.9% Since Last Earnings Report? – Nasdaq (Feb 25, 2026)
- Nucor (NUE) Extends Dividend Streak with 212th Consecutive Quarterly Payment – Yahoo Finance (Feb 23, 2026)
For more information about Nucor Corporation, please visit the official website: nucor.com