Home > Analyses > Consumer Defensive > Nu Skin Enterprises, Inc.
Nu Skin Enterprises transforms daily wellness with cutting-edge beauty and nutritional products. Its flagship ageLOC line redefines anti-aging through innovative skin care and supplements. As a pioneer in personal health, Nu Skin commands respect for blending science with direct-to-consumer reach. Yet, in a competitive market with shifting consumer trends, I question whether Nu Skin’s current fundamentals support its valuation and future growth potential.

Table of contents
Business Model & Company Overview
Nu Skin Enterprises, Inc. was founded in 1984 and is headquartered in Provo, Utah. It commands a dominant position in the Household & Personal Products industry through its integrated ecosystem of beauty and wellness solutions. Its core mission centers on advancing skin care and nutritional health with flagship offerings like ageLOC Spa systems and LifePak supplements, creating a seamless blend of technology and personal care. The company leverages its well-established brands—Nu Skin, Pharmanex, and ageLOC—to maintain broad consumer appeal and brand loyalty.
The company’s revenue engine balances direct sales of skin treatment devices and consumable products with a strong distribution network across the Americas, Europe, and Asia. It operates retail stores and service centers in Mainland China, supplementing direct-to-consumer channels with distributor partnerships and e-commerce. This diverse model generates recurring revenue from consumables while anchoring growth in innovative hardware. Nu Skin’s economic moat stems from its proprietary formulations and multi-channel presence, positioning it as a key innovator shaping the future of personal care.
Financial Performance & Fundamental Metrics
I analyze Nu Skin Enterprises, Inc.’s income statement, key financial ratios, and dividend payout policy to reveal its core strengths and risks.
Income Statement
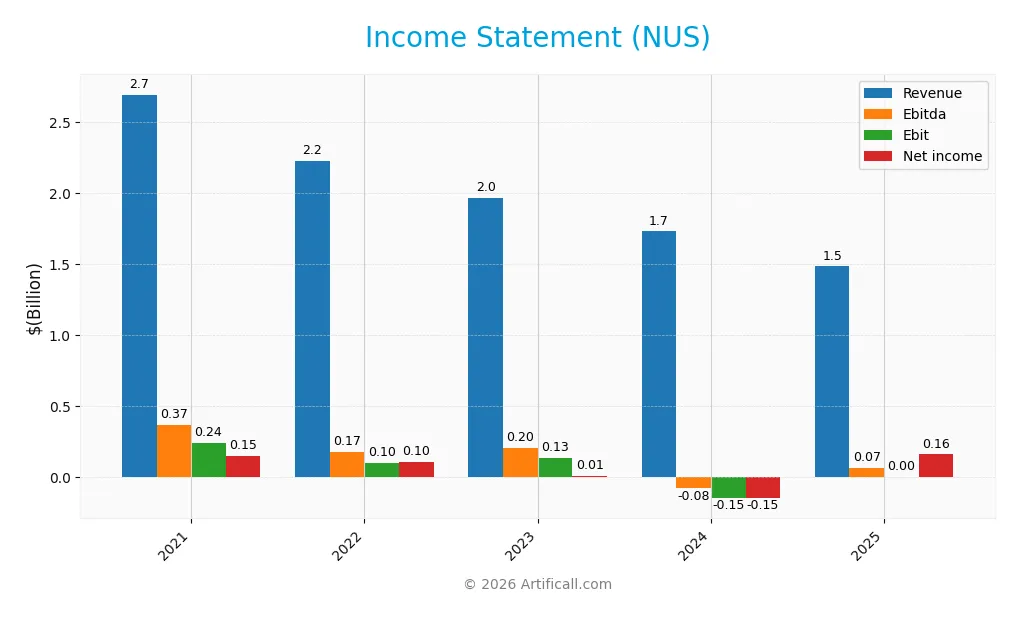
Below is the income statement for Nu Skin Enterprises, Inc. covering fiscal years 2021 through 2025, expressed in USD.
| 2021 | 2022 | 2023 | 2024 | 2025 | |
|---|---|---|---|---|---|
| Revenue | 2.70B | 2.23B | 1.97B | 1.73B | 1.49B |
| Cost of Revenue | 675M | 631M | 612M | 550M | 454M |
| Operating Expenses | 1.79B | 1.48B | 1.31B | 1.33B | 941M |
| Gross Profit | 2.02B | 1.59B | 1.36B | 1.18B | 1.03B |
| EBITDA | 368M | 175M | 203M | -79M | 66M |
| EBIT | 243M | 102M | 134M | -149M | 0 |
| Interest Expense | 11M | 22M | 26M | 26M | 14M |
| Net Income | 147M | 105M | 9M | -147M | 160M |
| EPS | 2.93 | 2.10 | 0.17 | -2.95 | 3.25 |
| Filing Date | 2022-02-16 | 2023-02-16 | 2024-02-15 | 2025-02-14 | 2026-02-13 |
Income Statement Evolution
From 2021 to 2025, Nu Skin Enterprises’ revenue declined by 45%, while net income increased by nearly 9%. Gross margin remained robust at 69.5%, though revenue contraction pressured absolute gross profit. Net margin nearly doubled, reflecting improved cost control and a sharp turnaround from 2024’s loss to positive net income in 2025.
Is the Income Statement Favorable?
In 2025, revenue fell 14% year-over-year, yet net income surged 228%, lifting EPS by 208%. Operating expenses scaled down proportionally, aiding margin recovery despite zero EBIT margin. Interest expense remained low under 1%, supporting profitability. Overall, the income statement fundamentals appear favorable, driven by margin expansion and disciplined cost management amid declining sales.
Financial Ratios
The following table summarizes key financial ratios for Nu Skin Enterprises, Inc. (NUS) over the past five fiscal years:
| Ratios | 2021 | 2022 | 2023 | 2024 | 2025 |
|---|---|---|---|---|---|
| Net Margin | 5.5% | 4.7% | 0.4% | -8.5% | 10.8% |
| ROE | 16.1% | 11.7% | 1.0% | -22.5% | 19.9% |
| ROIC | 9.8% | 7.3% | 1.0% | -10.4% | 4.6% |
| P/E | 17.3 | 20.1 | 112.3 | -2.3 | 3.0 |
| P/B | 2.8 | 2.3 | 1.2 | 0.5 | 0.6 |
| Current Ratio | 1.65 | 2.12 | 2.13 | 1.82 | 2.08 |
| Quick Ratio | 0.89 | 1.15 | 1.28 | 1.17 | 1.40 |
| D/E | 0.55 | 0.58 | 0.74 | 0.73 | 0.35 |
| Debt-to-Assets | 26.4% | 28.6% | 33.6% | 32.6% | 20.1% |
| Interest Coverage | 21.3 | 5.1 | 1.9 | -5.7 | 4.7 |
| Asset Turnover | 1.41 | 1.22 | 1.09 | 1.18 | 1.06 |
| Fixed Asset Turnover | 4.51 | 3.89 | 3.76 | 3.71 | 3.29 |
| Dividend Yield | 3.0% | 3.7% | 8.0% | 3.5% | 2.5% |
Evolution of Financial Ratios
Return on Equity (ROE) improved sharply to 19.9% in 2025 from negative territory in 2024, signaling a strong recovery in profitability. The Current Ratio steadily increased to 2.08, indicating enhanced liquidity. Debt-to-Equity Ratio decreased significantly, reaching 0.35 in 2025, suggesting reduced financial leverage and improved balance sheet stability.
Are the Financial Ratios Fovorable?
Profitability ratios like net margin (10.79%) and ROE (19.9%) are favorable, reflecting solid earnings growth. Liquidity metrics including Current Ratio (2.08) and Quick Ratio (1.4) also appear robust. Leverage is conservative with Debt-to-Equity at 0.35 and Debt-to-Assets at 20.05%. However, Interest Coverage is unfavorable at zero, posing a risk. Overall, 85.7% of ratios are favorable, marking a very favorable financial position.
Shareholder Return Policy
Nu Skin Enterprises, Inc. maintains a consistent dividend payout with a 7.4% payout ratio and a 2.5% yield in 2025. The dividend per share remains stable around $0.24, supported by free cash flow coverage of 57%, indicating prudent capital allocation.
The company also engages in share buybacks, complementing its dividend policy. This balanced approach supports sustainable long-term value creation by returning cash to shareholders without overstretching financial resources.
Score analysis
The following radar chart illustrates Nu Skin Enterprises’ fundamental financial scores across key valuation and profitability metrics:
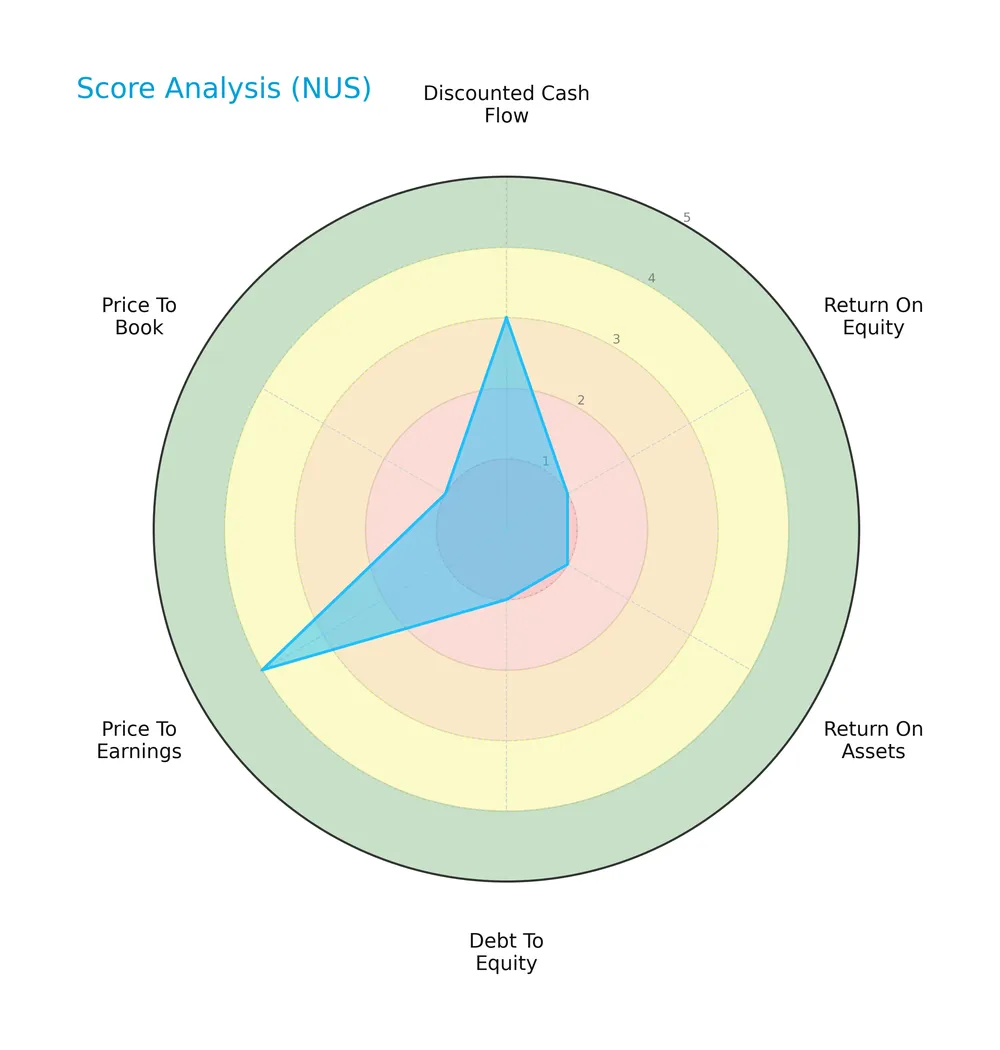
Nu Skin’s discounted cash flow score is moderate at 3, indicating average valuation appeal. Profitability measures—ROE and ROA—score very unfavorably at 1 each, reflecting weak returns. The debt-to-equity score also sits at 1, signaling high leverage risk. Favorable price-to-earnings contrast with a poor price-to-book score, evidencing mixed market sentiment.
Analysis of the company’s bankruptcy risk
Nu Skin’s Altman Z-Score places it firmly in the safe zone, indicating a low probability of bankruptcy and financial distress:

Is the company in good financial health?
This Piotroski diagram reveals Nu Skin’s overall financial health based on profitability, leverage, and operational efficiency:

With a Piotroski Score of 6, Nu Skin demonstrates average financial strength. This score suggests moderate stability but leaves room for improvement in financial robustness and operational performance.
Competitive Landscape & Sector Positioning
This analysis explores Nu Skin Enterprises’ strategic positioning, revenue segments, key products, and main competitors. I will assess whether Nu Skin holds competitive advantages within its sector.
Strategic Positioning
Nu Skin Enterprises concentrates on beauty and wellness products with a heavy reliance on its core Nu Skin segment, generating over $1.1B in 2025. Its geographic exposure is diversified across Americas, Asia-Pacific, and EMEA, with no single region dominating revenue.
Revenue by Segment
This pie chart displays Nu Skin Enterprises, Inc.’s revenue distribution by segment for the fiscal year 2025, illustrating the relative size of each business unit.
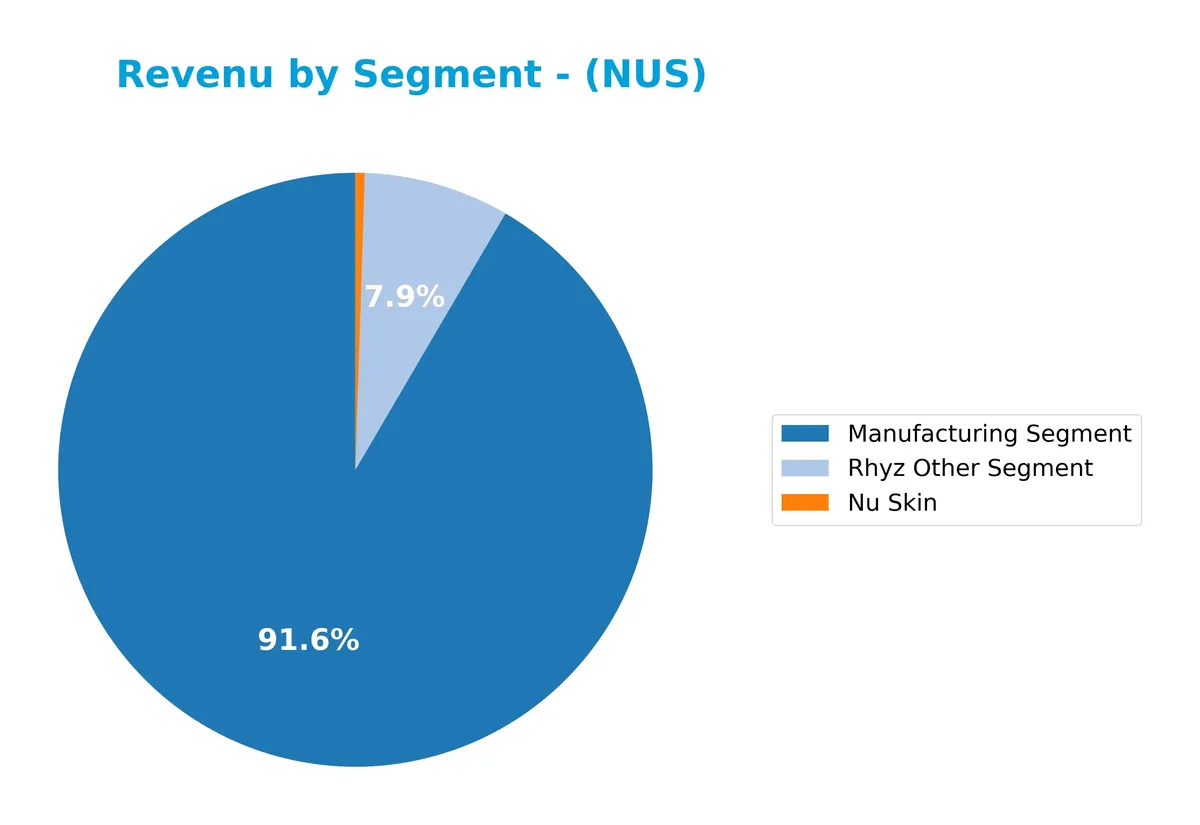
In 2025, the Manufacturing Segment generated 206M, dominating alongside the Nu Skin segment, which fell sharply to 1.1M, a drastic decline from prior years. The Rhyz Other Segment contributed 18M. The sharp drop in Nu Skin’s revenue signals concentrated risk and a major shift in business dynamics. Manufacturing remains the core driver, but this concentration and volatility merit cautious monitoring.
Key Products & Brands
The table below summarizes Nu Skin Enterprises, Inc.’s major products and brands with their descriptions:
| Product | Description |
|---|---|
| Nu Skin | Skin care systems, including ageLOC Spa, ageLOC Transformation, LumiSpa devices, and cosmetics |
| ageLOC | Anti-aging skin care, cleansing devices, nutritional supplements, and weight management systems |
| Pharmanex | Nutritional supplements including LifePak and other wellness products |
| Manufacturing Segment | Production and distribution operations supporting product lines |
| Rhyz Other Segment | Additional business activities outside core products |
Nu Skin focuses on skin care and wellness through branded anti-aging systems and nutritional supplements. The company integrates product development with direct and distributor sales across global markets.
Main Competitors
There are 17 competitors in the Consumer Defensive sector. The table lists the top 10 leaders by market capitalization:
| Competitor | Market Cap. |
|---|---|
| The Procter & Gamble Company | 331.3B |
| Unilever PLC | 143.2B |
| Colgate-Palmolive Company | 62.6B |
| The Estée Lauder Companies Inc. | 38.5B |
| Kimberly-Clark Corporation | 33.7B |
| Kenvue Inc. | 33.2B |
| Church & Dwight Co., Inc. | 20.2B |
| The Clorox Company | 12.3B |
| e.l.f. Beauty, Inc. | 4.3B |
| Inter Parfums, Inc. | 2.7B |
Nu Skin Enterprises, Inc. ranks 16th among 17 competitors, with a market cap just 0.12% that of the leader, Procter & Gamble. It sits well below both the average market cap of the top 10 (68.2B) and the sector median (4.3B). The company is 19.42% smaller than its nearest competitor above, highlighting a significant scale gap.
Comparisons with competitors
Check out how we compare the company to its competitors:
Does Nu Skin Enterprises have a competitive advantage?
Nu Skin Enterprises does not present a competitive advantage, as its return on invested capital (ROIC) is below its weighted average cost of capital (WACC), indicating value destruction. The company’s ROIC trend is sharply declining, reflecting decreasing profitability and inefficient capital use over 2021-2025.
Looking ahead, Nu Skin focuses on expanding its beauty and wellness product lines, including innovative skin care systems and nutritional supplements. Growth opportunities exist in emerging markets, particularly Mainland China and Southeast Asia, where the company maintains a significant retail presence despite recent revenue declines.
SWOT Analysis
This SWOT analysis highlights Nu Skin Enterprises, Inc.’s core competitive factors to guide strategic investment decisions.
Strengths
- strong net margin at 10.79%
- solid ROE of 19.9%
- favorable valuation metrics (PE 2.96, PB 0.59)
Weaknesses
- declining revenue trend over 5 years (-44.91%)
- negative ROIC vs WACC, indicating value destruction
- weak interest coverage ratio
Opportunities
- expanding e-commerce and direct selling channels
- rising health and wellness product demand
- growth potential in emerging markets like Southeast Asia
Threats
- intense competition in personal care sector
- regulatory risks in international markets
- market volatility impacting discretionary spending
Nu Skin shows notable profitability and valuation strengths but faces shrinking sales and value erosion. Strategic focus should target revitalizing growth and improving capital returns while managing competitive and regulatory risks.
Stock Price Action Analysis
The weekly stock chart displays Nu Skin Enterprises, Inc.’s price movement over the past 100 weeks, highlighting key volatility and trend shifts:

Trend Analysis
Over the past 12 months, NUS’s stock price declined by 32.03%, confirming a bearish trend with acceleration. The price ranged from a high of 13.83 to a low of 5.48. The 2.26 standard deviation signals notable volatility during this period.
Volume Analysis
In the last three months, trading volume decreased with seller dominance at 61.67%. This shift suggests weakening buying interest and increased selling pressure, reflecting cautious or bearish investor sentiment amid declining prices.
Target Prices
Analysts set a clear consensus target price at $11 for Nu Skin Enterprises, Inc.
| Target Low | Target High | Consensus |
|---|---|---|
| 11 | 11 | 11 |
The unanimous $11 target signals a stable outlook with limited upside or downside expected from current levels.

Don’t Let Luck Decide Your Entry Point
Optimize your entry points with our advanced ProRealTime indicators. You’ll get efficient buy signals with precise price targets for maximum performance. Start outperforming now!
Analyst & Consumer Opinions
This section reviews Nu Skin Enterprises, Inc. (NUS) analyst ratings alongside consumer feedback and satisfaction metrics.
Stock Grades
Here are the latest verified stock grades for Nu Skin Enterprises, Inc. from recognized financial firms:
| Grading Company | Action | New Grade | Date |
|---|---|---|---|
| DA Davidson | Maintain | Neutral | 2024-12-20 |
| Citigroup | Maintain | Neutral | 2024-10-22 |
| DA Davidson | Maintain | Neutral | 2024-08-12 |
| Citigroup | Maintain | Neutral | 2024-08-09 |
| DA Davidson | Maintain | Neutral | 2024-05-09 |
| DA Davidson | Maintain | Neutral | 2024-01-05 |
| Stifel | Maintain | Hold | 2023-10-16 |
| Stifel | Maintain | Hold | 2023-10-15 |
| Citigroup | Maintain | Neutral | 2023-09-29 |
| Citigroup | Maintain | Neutral | 2023-09-28 |
The consensus strongly favors a Hold position, reflecting steady sentiment with no upgrades or downgrades over recent periods. Neutral and Hold ratings dominate, signaling cautious market expectations.
Consumer Opinions
Nu Skin Enterprises, Inc. sparks diverse reactions, reflecting its broad consumer base and product variety.
| Positive Reviews | Negative Reviews |
|---|---|
| Quality products with noticeable skin benefits | Customer service response times are slow |
| Effective anti-aging solutions that deliver results | High price point compared to competitors |
| Wide product range catering to different skin types | Some users report inconsistent product effects |
Consumers appreciate Nu Skin’s product efficacy and variety. However, concerns about pricing and customer support consistency persist. This mix suggests strong brand loyalty tempered by service execution challenges.
Risk Analysis
Below is a summary of key risks facing Nu Skin Enterprises, Inc., including their likelihood and potential impact:
| Category | Description | Probability | Impact |
|---|---|---|---|
| Operational Risk | Dependence on direct selling and distributors in diverse markets | Medium | High |
| Financial Risk | Interest coverage ratio at 0.0 signals difficulty servicing debt | Medium | High |
| Market Risk | Stock price volatility with 52-week range from 5.32 to 14.62 USD | High | Medium |
| Competitive Risk | Industry competition pressures margins and innovation cycles | Medium | Medium |
| Regulatory Risk | Exposure to regulatory changes in China and global markets | Low | Medium |
Nu Skin’s most pressing risk is its inability to cover interest expenses, a red flag despite favorable leverage ratios. Market volatility also threatens shareholder value amid a sharp 18% recent price drop. Operational risks tied to distribution could intensify if global conditions worsen.
Should You Buy Nu Skin Enterprises, Inc.?
Nu Skin Enterprises appears to have manageable debt but suffers from declining profitability and a very unfavorable competitive moat, suggesting value destruction. Despite a safe Altman Z-score, the overall rating of C reflects moderate operational efficiency and caution.
Strength & Efficiency Pillars
Nu Skin Enterprises, Inc. posts a solid net margin of 10.79% and a return on equity of 19.9%, reflecting effective profitability. The company maintains a favorable weighted average cost of capital (WACC) at 6.46%. However, its return on invested capital (ROIC) is 4.62%, trailing below WACC, indicating value erosion rather than creation. Despite this, operational margins and liquidity metrics like a 2.08 current ratio and 1.4 quick ratio show operational efficiency and financial flexibility.
Weaknesses and Drawbacks
Nu Skin is not without risks. Despite a secure Altman Z-Score of 4.07 placing it safely above distress, the company faces challenges such as a bearish stock trend with a 32.03% price decline overall. Recent seller dominance at 61.67% heightens short-term market pressure. While valuation ratios like P/E at 2.96 and P/B at 0.59 appear attractive, the declining ROIC signals deteriorating capital efficiency. Additionally, an interest coverage ratio of zero flags potential difficulties meeting interest obligations.
Our Final Verdict about Nu Skin Enterprises, Inc.
Nu Skin’s profile might appear attractive for long-term exposure given its strong liquidity and profitability. However, the bearish price trend and seller dominance suggest caution. The company’s inability to generate returns above its cost of capital temper enthusiasm. Investors could consider a wait-and-see stance until operational improvements translate into stable market momentum and ROIC recovery.
Disclaimer: This content is for informational purposes only and does not constitute financial, investment, or other professional advice. Investing in financial markets involves a significant risk of loss, and past performance is not indicative of future results.
Additional Resources
- Nu Skin Enterprises Q4 Earnings Lag Estimates, Revenues Down Y/Y – Yahoo Finance (Feb 13, 2026)
- Nu Skin Enterprises, Inc. (NYSE:NUS) Declares Quarterly Dividend of $0.06 – MarketBeat (Feb 13, 2026)
- Stonegate Capital Partners Updates Coverage on NU Skin Enterprises Inc. (NUS) 2025 Q4 – TradingView (Feb 13, 2026)
- Why Is Nu Skin Stock Sinking Friday? – Nu Skin Enterprises (NYSE:NUS) – Benzinga (Feb 13, 2026)
- Nu Skin Enterprises Inc (NUS) Q4 2025 Earnings Call Highlights: Strong Earnings Growth and Strategic Expansion – GuruFocus (Feb 13, 2026)
For more information about Nu Skin Enterprises, Inc., please visit the official website: nuskin.com