Home > Analyses > Utilities > NRG Energy, Inc.
NRG Energy powers millions of homes and businesses across the United States, shaping how energy fuels daily life. As a major independent power producer, it commands a diverse generation portfolio spanning natural gas, renewables, and nuclear energy. The company stands out for its innovative approach to integrated energy solutions and carbon management. Now, the question is whether NRG’s robust fundamentals and strategic initiatives justify its current premium valuation and growth outlook.
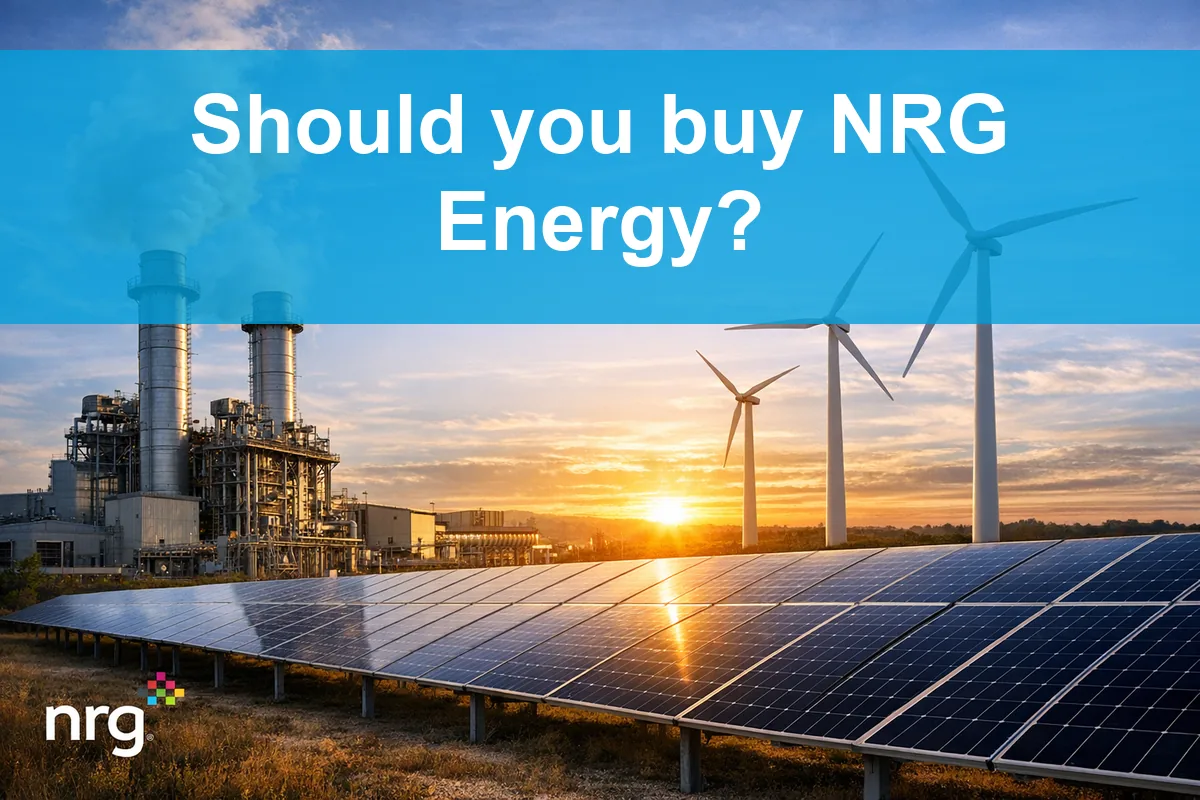
Table of contents
Business Model & Company Overview
NRG Energy, Inc., founded in 1989 and headquartered in Houston, Texas, stands as a leading Independent Power Producer in the U.S. It operates an integrated ecosystem spanning natural gas, coal, solar, nuclear, and battery storage. Serving 6M residential, commercial, industrial, and wholesale clients, NRG delivers electricity alongside advanced energy solutions, including demand response and carbon management. Its diverse portfolio reflects a commitment to both traditional and renewable power generation.
NRG’s revenue engine balances power generation with energy trading and retail sales under multiple brands like Reliant and Green Mountain Energy. It operates across Texas, East, and West regions, capturing value in the Americas with a robust presence in commercial and wholesale markets. The company’s 18GW capacity and multi-channel fuel procurement create a formidable economic moat, positioning it to shape the future of U.S. energy.
Financial Performance & Fundamental Metrics
I will analyze NRG Energy, Inc.’s income statement, key financial ratios, and dividend payout policy to assess its operational efficiency and shareholder returns.
Income Statement
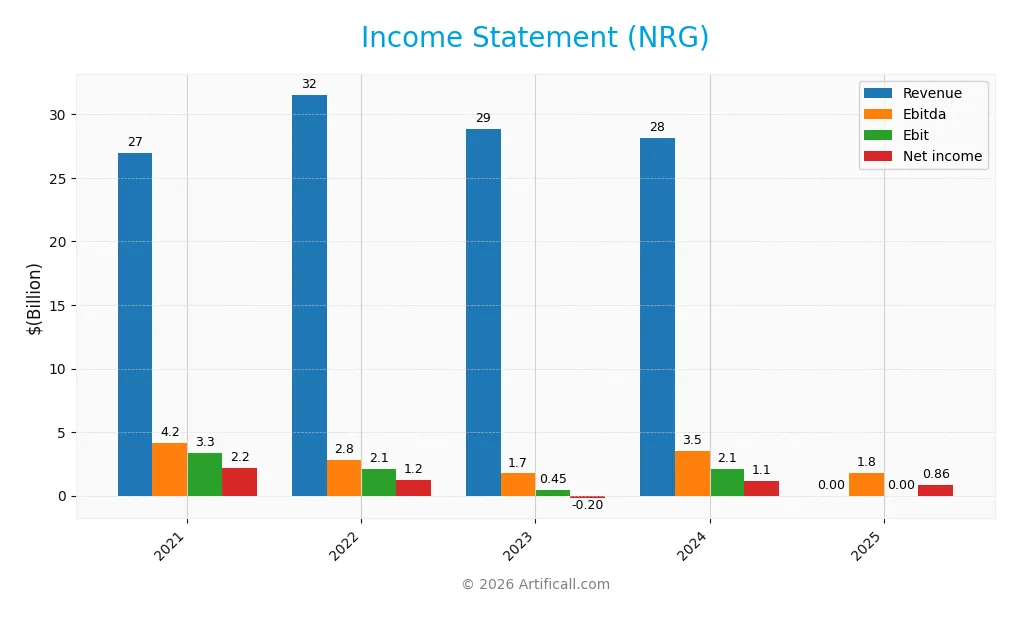
The table below summarizes NRG Energy, Inc.’s key income statement figures for the fiscal years 2021 through 2025, reported in USD.
| 2021 | 2022 | 2023 | 2024 | 2025 | |
|---|---|---|---|---|---|
| Revenue | 27B | 31.5B | 28.8B | 28.1B | 0 |
| Cost of Revenue | 20.5B | 27.4B | 26.5B | 22.1B | 0 |
| Operating Expenses | 3.2B | 2.1B | 1.9B | 3.6B | 2.6B |
| Gross Profit | 6.5B | 4.1B | 2.3B | 6.0B | 0 |
| EBITDA | 4.2B | 2.8B | 1.7B | 3.5B | 1.8B |
| EBIT | 3.3B | 2.1B | 454M | 2.1B | 0 |
| Interest Expense | 485M | 417M | 667M | 651M | 741M |
| Net Income | 2.2B | 1.2B | -202M | 1.1B | 864M |
| EPS | 8.93 | 5.17 | -1.12 | 5.14 | 4.09 |
| Filing Date | 2022-02-24 | 2023-02-23 | 2024-02-28 | 2025-02-26 | 2026-02-24 |
Income Statement Evolution
NRG Energy’s revenue collapsed from $31.5B in 2022 to zero in 2025, erasing gross profit and compressing margins to zero. Net income plunged 60% over five years, swinging from $2.2B profit in 2021 to $864M in 2025. Margins deteriorated sharply, reflecting a severe contraction in core profitability and operational efficiency.
Is the Income Statement Favorable?
The 2025 income statement shows zero revenue, yet $2.6B in operating expenses and $741M interest expense, limiting net income to $864M. Operating income and EBITDA remain positive, but absence of revenue signals structural issues. Despite positive net income, fundamentals appear unfavorable given the loss of top-line and margin erosion.
Financial Ratios
The following table summarizes key financial ratios for NRG Energy, Inc. from 2021 to 2025, providing insight into profitability, liquidity, leverage, and valuation metrics:
| Ratios | 2021 | 2022 | 2023 | 2024 | 2025 |
|---|---|---|---|---|---|
| Net Margin | 8.10% | 3.87% | -0.70% | 4.00% | 0.00% |
| ROE | 60.75% | 31.90% | -6.95% | 45.40% | 0.51% |
| ROIC | 16.65% | 9.08% | 2.11% | 11.57% | -18.25% |
| P/E | 4.83 | 6.15 | -58.35 | 16.52 | 35.94 |
| P/B | 2.93 | 1.96 | 4.06 | 7.50 | 18.47 |
| Current Ratio | 1.37 | 1.25 | 1.02 | 1.02 | 0.03 |
| Quick Ratio | 1.31 | 1.19 | 0.96 | 0.96 | 0.03 |
| D/E | 2.30 | 2.17 | 3.78 | 4.44 | 9.89 |
| Debt-to-Assets | 35.75% | 28.48% | 42.13% | 45.75% | 63.93% |
| Interest Coverage | 6.89 | 4.84 | 0.58 | 3.72 | -2.49 |
| Asset Turnover | 1.16 | 1.08 | 1.11 | 1.17 | 0.00 |
| Fixed Asset Turnover | 13.78 | 16.45 | 14.84 | 12.95 | 0.00 |
| Dividend Yield | 3.02% | 4.42% | 3.23% | 2.18% | 1.11% |
Evolution of Financial Ratios
NRG’s Return on Equity (ROE) showed a steep decline, falling to 0.51% in 2025 from over 60% in 2021. The Current Ratio deteriorated sharply, dropping from 1.37 in 2021 to just 0.03 in 2025, signaling weakening liquidity. Debt-to-Equity surged to 9.89 in 2025, indicating a significant rise in financial leverage and risk. Profitability metrics collapsed, reflecting severe operational challenges.
Are the Financial Ratios Favorable?
In 2025, NRG’s financial ratios paint a grim picture. Profitability is weak with a zero net margin and negative Return on Invested Capital (-18.25%). Liquidity is critically low, as the Current and Quick Ratios stand near 0.03, far below the healthy benchmark of 1. Debt ratios are alarmingly high, with Debt-to-Equity at 9.89 and poor interest coverage. Market valuation ratios like PE (35.94) and PB (18.47) are elevated, suggesting overvaluation. Dividend yield is modest at 1.11%, rated neutral. Overall, the ratios are very unfavorable.
Shareholder Return Policy
NRG Energy maintains a dividend payout ratio near 40%, with a 2025 dividend per share of $1.76 and a yield around 1.1%. The company supports distributions through free cash flow, despite elevated leverage and coverage ratios indicating financial strain.
Share buybacks remain unreported, suggesting dividends are the primary shareholder return. This payout level appears cautiously aligned with long-term value, yet high debt and low liquidity ratios pose risks to sustain distributions under market stress.
Score analysis
The radar chart below illustrates NRG Energy’s key financial scores across valuation, profitability, and leverage metrics:
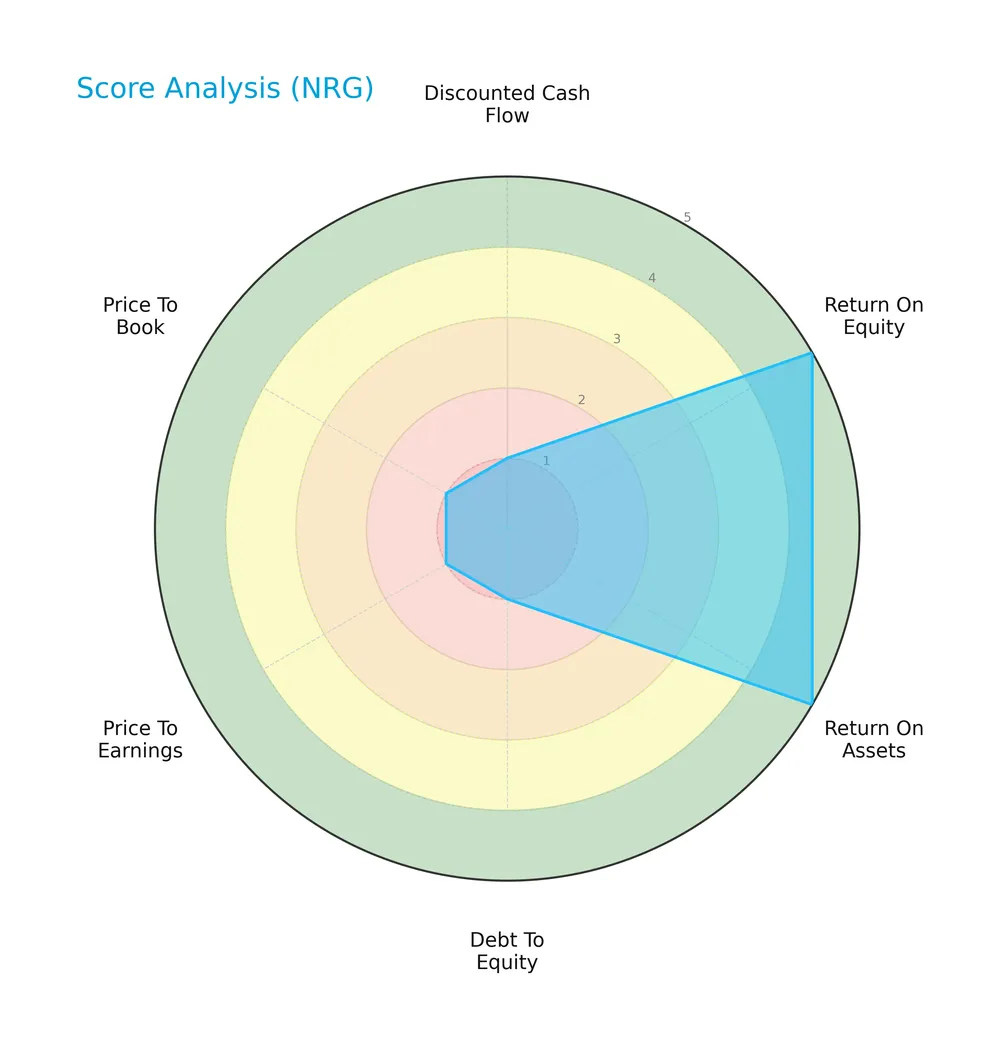
NRG scores very favorably in return on equity and assets, indicating strong profitability. However, valuation and leverage metrics such as discounted cash flow, debt-to-equity, price-to-earnings, and price-to-book show very unfavorable scores, reflecting potential market and financial risks.
Analysis of the company’s bankruptcy risk
NRG Energy’s Altman Z-Score places it deep in the distress zone, signaling a high risk of bankruptcy and significant financial instability:

Is the company in good financial health?
The Piotroski Score diagram provides insight into NRG Energy’s overall financial strength:

With a Piotroski Score of 5, NRG demonstrates average financial health. This score suggests moderate operational efficiency and profitability but highlights areas requiring improvement to enhance financial resilience.
Competitive Landscape & Sector Positioning
This section analyzes NRG Energy, Inc.’s strategic positioning, revenue segments, and key products within the utilities sector. I will assess the company’s competitive advantages relative to its main competitors.
Strategic Positioning
NRG Energy operates a geographically diversified portfolio across Texas, East, and West segments, generating $26B+ in 2024 revenue with growing services like Vivint Smart Home at $1.9B. Its integrated power model spans multiple energy sources and retail brands, balancing production and customer solutions.
Revenue by Segment
This pie chart illustrates NRG Energy’s revenue distribution by segment for the full year 2024, highlighting the company’s diverse operational footprint.
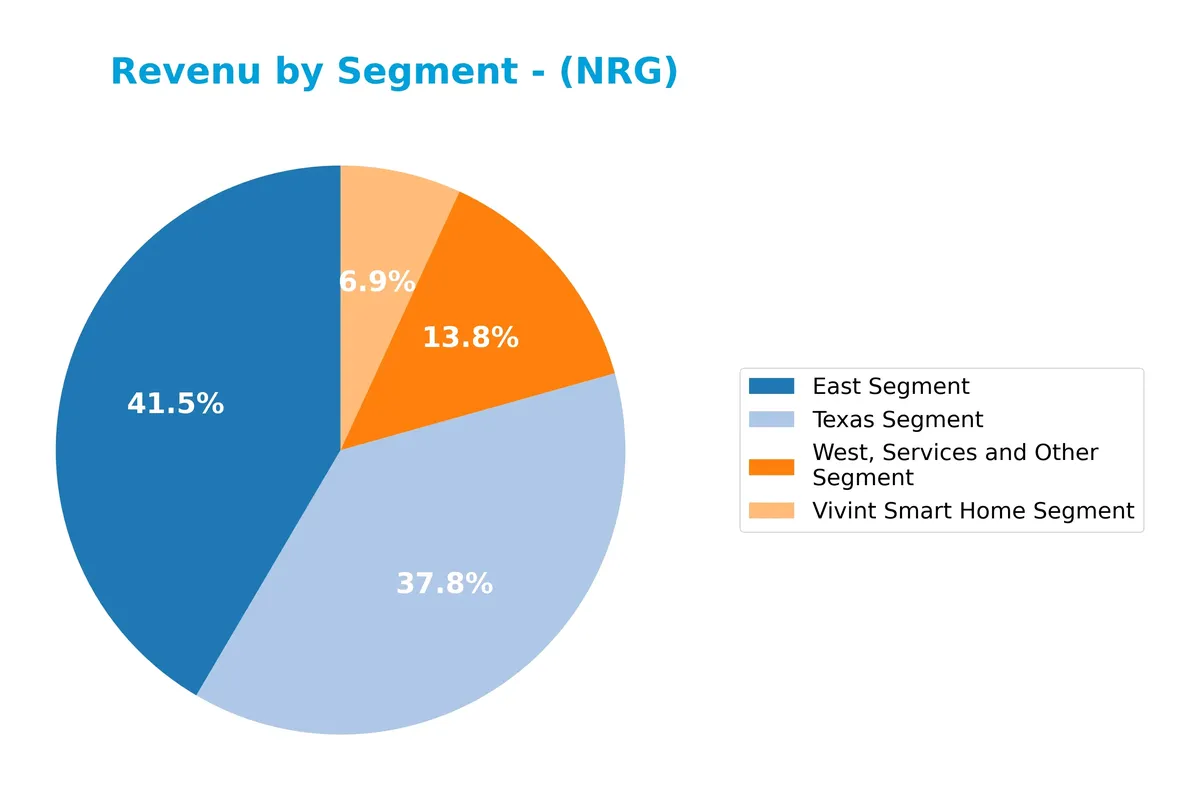
NRG’s East Segment remains the largest revenue driver at 11.7B, followed closely by Texas at 10.7B. The West, Services and Other segment contributes a solid 3.9B, with Vivint Smart Home adding 1.9B, a notable growth from previous years. The revenue mix shows a slight shift toward Texas and Vivint, indicating evolving geographic and service focus. Overall, the diversified segments balance concentration risk effectively.
Key Products & Brands
The table below outlines NRG Energy’s primary products, brands, and business segments:
| Product | Description |
|---|---|
| East Segment | Electricity production and sales in the U.S. East region, serving residential, commercial, and industrial customers. |
| Texas Segment | Power generation and retail electricity services focused on the Texas market. |
| West, Services and Other Segment | Diverse operations including power generation and related services across Western U.S. markets. |
| Vivint Smart Home Segment | Home automation and energy management services provided through Vivint Smart Home. |
| NRG Brand | Corporate brand under which the company markets its power generation and energy services. |
| Reliant | Retail electricity provider serving residential and commercial customers primarily in Texas. |
| Direct Energy | Retail brand offering energy products and services across multiple U.S. regions. |
| Green Mountain Energy | Provider of renewable energy options and related products. |
| Stream | Retail energy brand focused on electricity and natural gas supply. |
| XOOM Energy | Retail electricity and natural gas provider in select U.S. markets. |
NRG Energy operates a multi-regional power generation and retail platform. Its portfolio spans from traditional power sources to smart home energy management, anchored by several well-known retail brands. This diversified offering supports approximately 6 million customers across the U.S.
Main Competitors
NRG Energy, Inc. operates alongside 2 main competitors; the table below lists the top 10 leaders by market capitalization:
| Competitor | Market Cap. |
|---|---|
| Vistra Corp. | 56B |
| NRG Energy, Inc. | 32B |
NRG Energy ranks 2nd among its competitors, with a market cap at 62.18% of the leader Vistra Corp. The company is below both the average market cap of the top 10 (44B) and the sector median (44B). It holds a 60.81% market cap gap to its closest competitor above, indicating a significant scale difference.
Comparisons with competitors
Check out how we compare the company to its competitors:
Does NRG have a competitive advantage?
NRG Energy, Inc. does not present a competitive advantage as it is destroying value with a declining return on invested capital (ROIC) well below its weighted average cost of capital (WACC). Its profitability metrics and revenue growth have been unfavorable, signaling weakening operational efficiency and capital allocation.
Looking ahead, NRG’s integrated power operations across multiple energy sources and services expose it to diverse market opportunities, including renewable products and carbon management. However, its financial performance challenges may limit its ability to capitalize fully on future product and market expansions.
SWOT Analysis
This SWOT analysis highlights NRG Energy’s core strategic factors to guide investment decisions.
Strengths
- diversified energy portfolio
- strong market presence in US
- experienced management team
Weaknesses
- declining profitability
- high debt levels
- weak liquidity ratios
Opportunities
- growth in renewable energy demand
- expansion in energy storage
- strategic acquisitions
Threats
- regulatory changes
- volatile commodity prices
- intense industry competition
NRG Energy faces significant financial challenges but benefits from a broad energy mix and strong market foothold. Its strategy must focus on deleveraging and capitalizing on renewables to mitigate risks.
Stock Price Action Analysis
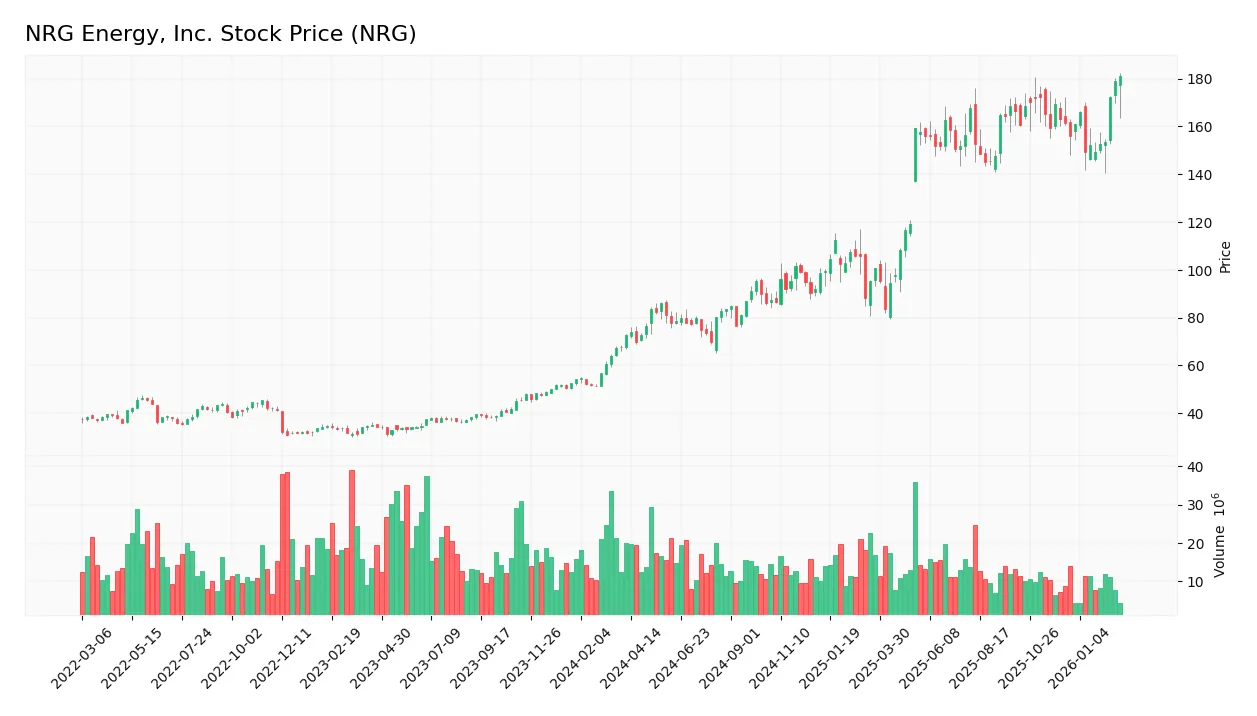
The following weekly chart illustrates NRG Energy, Inc.’s stock price movement over the past 100 weeks, highlighting key price fluctuations and trends:
Trend Analysis
NRG’s stock price surged 149% over the past two years, indicating a strong bullish trend with clear acceleration. The price ranged from a low of 70 to a high of 181, showing notable volatility with a standard deviation of 36.3. Recent three-month gains of 12.1% continue this positive momentum at a steady slope of 1.56.
Volume Analysis
Trading volume over the last three months shows buyer dominance at 60.2%. Despite this, overall volume trends downward, signaling cautious investor participation. The decreasing volume combined with buyer control suggests selective accumulation rather than broad market enthusiasm.
Target Prices
Analysts project a target consensus that signals confident upside potential for NRG Energy, Inc.
| Target Low | Target High | Consensus |
|---|---|---|
| 153 | 225 | 196.33 |
The target range reflects optimism, with a consensus price suggesting a substantial premium over current levels. This indicates strong analyst conviction in NRG’s growth trajectory.

Don’t Let Luck Decide Your Entry Point
Optimize your entry points with our advanced ProRealTime indicators. You’ll get efficient buy signals with precise price targets for maximum performance. Start outperforming now!
Analyst & Consumer Opinions
This section examines analyst ratings and consumer feedback to provide insights on NRG Energy, Inc.’s market perception.
Stock Grades
Here are the latest verified analyst grades for NRG Energy, Inc., reflecting current market sentiment and outlook:
| Grading Company | Action | New Grade | Date |
|---|---|---|---|
| Jefferies | Maintain | Buy | 2026-01-27 |
| Wells Fargo | Maintain | Overweight | 2026-01-20 |
| BMO Capital | Maintain | Market Perform | 2025-11-07 |
| Morgan Stanley | Maintain | Equal Weight | 2025-10-28 |
| Jefferies | Maintain | Buy | 2025-10-20 |
| Seaport Global | Maintain | Buy | 2025-10-08 |
| Barclays | Maintain | Overweight | 2025-08-07 |
| BMO Capital | Maintain | Market Perform | 2025-08-06 |
| Citigroup | Maintain | Buy | 2025-07-17 |
| BMO Capital | Maintain | Market Perform | 2025-05-14 |
The grades predominantly reflect a steady Buy or Overweight stance, indicating moderate confidence among analysts. Market Perform ratings suggest some caution, but no downgrades signal significant concern.
Consumer Opinions
Consumers express a mix of admiration and frustration toward NRG Energy, Inc., reflecting the company’s complex service dynamics.
| Positive Reviews | Negative Reviews |
|---|---|
| Reliable energy supply with minimal outages. | Customer service response times are slow. |
| Competitive pricing compared to local providers. | Billing errors reported by several users. |
| Transparent communication during grid issues. | Limited renewable energy options available. |
Overall, customers appreciate NRG’s consistent power delivery and fair pricing. However, slow customer support and billing inaccuracies frequently diminish satisfaction. These issues highlight areas for operational improvement.
Risk Analysis
Below is a detailed table of key risks facing NRG Energy, Inc., highlighting probability and potential impact:
| Category | Description | Probability | Impact |
|---|---|---|---|
| Financial Stability | Extremely low Altman Z-score (-19.45) signals high bankruptcy risk and financial distress. | High | Severe |
| Liquidity | Current and quick ratios at 0.03 indicate critical short-term liquidity constraints. | High | Severe |
| Leverage | Debt-to-equity ratio near 10 and debt-to-assets over 6,000% reflect dangerously high leverage. | High | Severe |
| Profitability | Negative ROIC (-18.25%) versus WACC (7.51%) shows value destruction on invested capital. | High | High |
| Market Valuation | Elevated P/E (36) and P/B (18.5) suggest overvaluation and potential price volatility. | Medium | Medium |
| Operational Risk | Asset turnover at zero signals inefficiency in asset utilization for revenue generation. | Medium | Medium |
| Interest Coverage | Interest coverage near zero implies inability to cover debt costs from operating income. | High | Severe |
| Dividend Sustainability | Dividend yield of 1.11% is modest, but payout risks exist given weak profitability. | Medium | Medium |
The most alarming risks are financial distress and liquidity shortages. NRG’s Altman Z-score plunges deep into the distress zone, signaling acute bankruptcy risk. Its liquidity ratios are critically low, a red flag for operational solvency. Excessive leverage compounds this vulnerability. Despite strong ROE, the negative ROIC versus WACC reveals poor capital allocation, destroying shareholder value. These factors demand cautious risk management before considering NRG as a portfolio addition.
Should You Buy NRG Energy, Inc.?
NRG Energy appears to be navigating a challenging phase with declining profitability and a deteriorating competitive moat, suggesting value destruction. Despite a manageable leverage profile, financial distress indicators temper the outlook, resulting in an overall B- rating that could be seen as cautious.
Strength & Efficiency Pillars
NRG Energy, Inc. shows a favorable return on equity of 51.4%, indicating strong shareholder value generation. However, the return on invested capital (ROIC) is negative at -18.25%, well below the weighted average cost of capital (WACC) at 7.51%. This signals the company is not creating value, but rather shedding it operationally. Margins, including net margin at 0%, remain unfavorable, revealing operational challenges despite solid equity returns.
Weaknesses and Drawbacks
The company is in financial distress, with an alarming Altman Z-Score of -19.45, indicating a high bankruptcy risk. This solvency concern overshadows other metrics. Valuation multiples are stretched, with a P/E of 35.94 and a P/B of 18.47, suggesting an expensive stock for its fundamentals. Leverage is extreme; debt-to-equity stands at 9.89, and liquidity ratios are critically low (current ratio 0.03), exposing NRG to severe short-term cash flow risks.
Our Final Verdict about NRG Energy, Inc.
Despite some operational strengths, NRG’s solvency risk is profound, making its investment profile highly speculative and too risky for conservative capital. The distress zone Z-Score dominates the analysis, overwhelming any favorable signals from equity returns or recent buyer dominance. Investors should approach with extreme caution, as the company faces significant financial headwinds that could jeopardize its viability.
Disclaimer: This content is for informational purposes only and does not constitute financial, investment, or other professional advice. Investing in financial markets involves a significant risk of loss, and past performance is not indicative of future results.
Additional Resources
- NRG Energy, Inc. Reports Full Year 2025 Financial Results – Business Wire (Feb 24, 2026)
- NRG Energy beats quarterly profit estimates on strong power demand – Reuters (Feb 24, 2026)
- NRG Energy Doubles Generation Capacity and Targets 14% EPS Growth Through 2030 – Yahoo Finance (Feb 24, 2026)
- Earnings call transcript: NRG Energy beats Q4 2025 forecasts, stock rises – Investing.com (Feb 24, 2026)
- NRG Energy Inc Bottom Line Drops In Q4 – Nasdaq (Feb 24, 2026)
For more information about NRG Energy, Inc., please visit the official website: nrg.com