Home > Analyses > Technology > Novanta Inc.
Novanta Inc. powers precision in industries that rely on cutting-edge photonics and motion control every day. Its advanced laser technologies and vision systems drive breakthroughs in medical imaging, industrial manufacturing, and scientific research. With a reputation for innovation and quality, Novanta commands respect as a hardware and equipment leader. The critical question now is whether its robust fundamentals can sustain growth amid evolving market dynamics and justify its current valuation.
Table of contents
Business Model & Company Overview
Novanta Inc., founded in 1968 and headquartered in Bedford, Massachusetts, leads the hardware, equipment & parts industry with a specialized focus on photonics, vision, and precision motion components. Its offerings form a cohesive ecosystem serving original equipment manufacturers across medical and industrial markets worldwide. Novanta integrates laser scanning, medical visualization, and precision motion technologies under a unified mission to enhance performance in complex applications like DNA sequencing and robotic automation.
The company’s revenue engine balances high-tech hardware with embedded software and consumable components, generating recurring value across global markets in the Americas, Europe, and Asia. Novanta’s direct sales force, distributors, and system integrators sustain robust market penetration under multiple well-established brands. Its competitive advantage lies in proprietary precision technologies that create high switching costs and barriers, positioning Novanta as a pivotal innovator shaping the future of photonics and motion control industries.
Financial Performance & Fundamental Metrics
I analyze Novanta Inc.’s income statement, key financial ratios, and dividend payout policy to assess its profitability, efficiency, and shareholder returns.
Income Statement
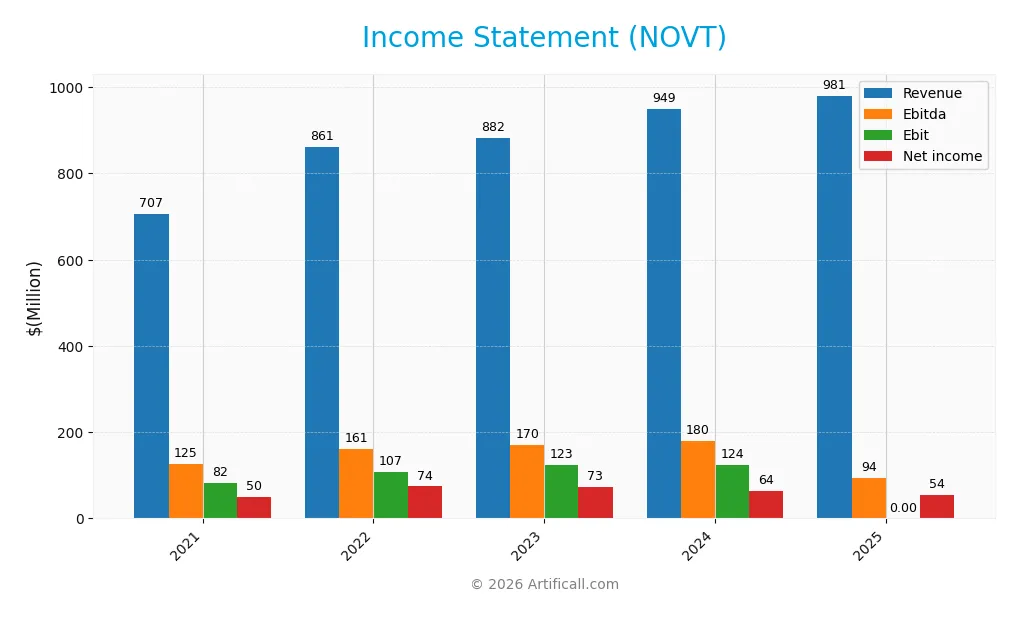
The table below summarizes Novanta Inc.’s key income statement figures for fiscal years 2021 through 2025, reflecting revenue and profit trends.
| 2021 | 2022 | 2023 | 2024 | 2025 | |
|---|---|---|---|---|---|
| Revenue | 707M | 861M | 882M | 949M | 981M |
| Cost of Revenue | 406M | 482M | 482M | 528M | 545M |
| Operating Expenses | 236M | 275M | 289M | 311M | 341M |
| Gross Profit | 300M | 378M | 400M | 422M | 435M |
| EBITDA | 125M | 161M | 170M | 180M | 94M |
| EBIT | 82M | 107M | 123M | 124M | 0 |
| Interest Expense | 7.4M | 15.6M | 25.8M | 31.5M | 21.5M |
| Net Income | 50.3M | 74.1M | 72.9M | 64.1M | 53.8M |
| EPS | 1.42 | 2.08 | 2.03 | 1.78 | 1.47 |
| Filing Date | 2022-03-01 | 2023-03-01 | 2024-02-28 | 2025-02-25 | 2026-02-23 |
Income Statement Evolution
Novanta Inc.’s revenue grew 39% from 2021 to 2025, showing a steady upward trend. Gross profit followed suit with a similar 38% rise, maintaining a favorable 44.4% gross margin. However, net income growth was modest at 7%, with net margin shrinking by nearly 23%. Earnings per share increased slightly, but profitability margins weakened over the period.
Is the Income Statement Favorable?
In 2025, Novanta reported $981M revenue, up 3.3% year-over-year, but net income declined 16.9% to $54M, compressing the net margin to 5.5%. Operating expenses grew in line with revenue, eroding EBIT to zero, an unfavorable sign. Interest expense remains manageable at 2.2% of revenue. Overall, fundamentals are mixed, reflecting margin pressures despite revenue resilience.
Financial Ratios
The following table presents key financial ratios for Novanta Inc. from 2021 to 2025, illustrating profitability, liquidity, leverage, and market valuation:
| Ratios | 2021 | 2022 | 2023 | 2024 | 2025 |
|---|---|---|---|---|---|
| Net Margin | 7.1% | 8.6% | 8.3% | 6.8% | 5.5% |
| ROE | 9.7% | 12.8% | 10.8% | 8.6% | 4.1% |
| ROIC | 5.4% | 8.0% | 8.7% | 7.3% | 4.4% |
| P/E | 124.0 | 65.4 | 82.8 | 85.7 | 80.9 |
| P/B | 12.0 | 8.4 | 9.0 | 7.4 | 3.3 |
| Current Ratio | 2.0 | 2.6 | 3.0 | 2.6 | 3.7 |
| Quick Ratio | 1.3 | 1.5 | 1.9 | 1.7 | 2.8 |
| D/E | 0.95 | 0.85 | 0.60 | 0.63 | 0.23 |
| Debt-to-Assets | 40.2% | 39.4% | 33.0% | 33.9% | 16.6% |
| Interest Coverage | 8.7x | 6.6x | 4.3x | 3.5x | -4.4x |
| Asset Turnover | 0.58 | 0.69 | 0.72 | 0.68 | 0.54 |
| Fixed Asset Turnover | 5.2 | 5.9 | 6.0 | 6.1 | 6.1 |
| Dividend Yield | 0% | 0% | 0% | 0% | 0% |
Evolution of Financial Ratios
From 2021 to 2025, Novanta Inc.’s Return on Equity (ROE) declined steadily, ending at 4.1%, signaling weakening profitability. The Current Ratio improved significantly, reaching 3.69 in 2025, indicating enhanced liquidity. Meanwhile, the Debt-to-Equity Ratio fell sharply to 0.23, reflecting a reduction in leverage and a more conservative capital structure.
Are the Financial Ratios Fovorable?
In 2025, Novanta shows mixed ratio outcomes. Profitability ratios like ROE (4.1%) and ROIC (4.42%) remain below its WACC (10.78%), which is unfavorable. Liquidity is mixed, with a strong Quick Ratio (2.8) but a surprisingly high Current Ratio flagged as unfavorable. Leverage ratios, including Debt-to-Equity (0.23) and Debt-to-Assets (16.58%), are favorable. Market valuations, such as a P/E of 80.88 and a P/B of 3.31, are considered unfavorable, reflecting potential overvaluation concerns. Overall, 57% of key ratios rate unfavorable.
Shareholder Return Policy
Novanta Inc. (NOVT) does not pay dividends, reflecting a reinvestment strategy typical for companies prioritizing growth and R&D. The firm also does not engage in share buybacks, indicating capital retention to fund operations and expansion.
This approach aligns with sustaining long-term shareholder value by focusing on internal growth rather than immediate cash returns. However, absence of distributions requires investors to trust management’s capital allocation discipline amid no direct income from shares.
Score analysis
The following radar chart displays Novanta Inc.’s key financial scores, offering a snapshot of valuation and profitability metrics:
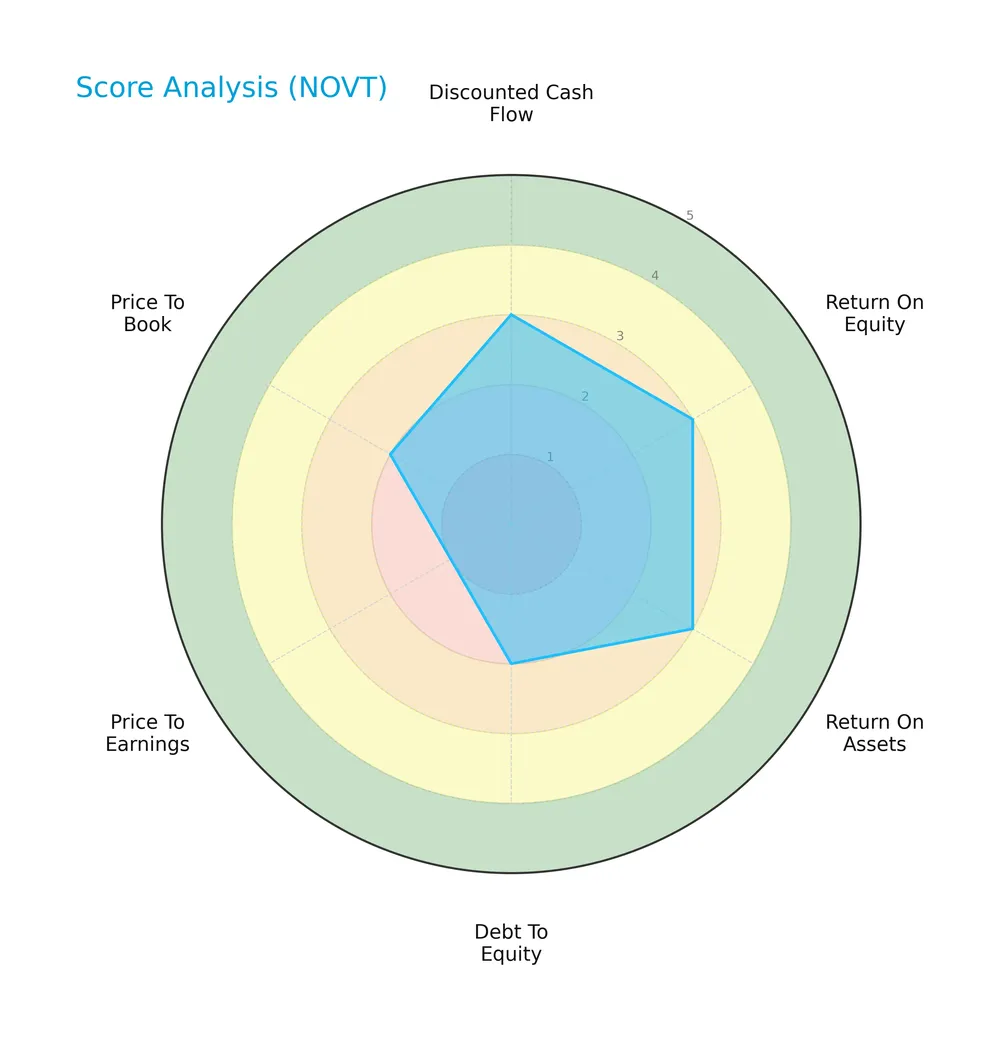
Novanta shows moderate scores in discounted cash flow, return on equity, and return on assets, indicating stable profitability. However, debt-to-equity and price-to-book scores are unfavorable, while price-to-earnings is very unfavorable, signaling valuation concerns.
Analysis of the company’s bankruptcy risk
Novanta’s Altman Z-Score places it firmly in the safe zone, indicating a low risk of bankruptcy:

Is the company in good financial health?
The Piotroski Score diagram below illustrates Novanta’s financial strength based on nine fundamental criteria:

With a Piotroski Score of 6, Novanta ranks as average in financial health, suggesting moderate operational efficiency and profitability without significant red flags.
Competitive Landscape & Sector Positioning
This analysis explores Novanta Inc.’s strategic positioning within the hardware, equipment, and parts sector. It covers revenue by segment, key products, main competitors, and competitive advantages. I will assess whether Novanta holds a sustainable competitive advantage over its peers.
Strategic Positioning
Novanta Inc. operates a diversified product portfolio spanning Precision Manufacturing, Robotics and Automation, Advanced Surgery, and Precision Medicine, with revenues near $980M in 2025. Geographically, it maintains broad exposure, generating significant sales across the US ($519M), Europe, China, and Asia Pacific regions.
Revenue by Segment
This pie chart presents Novanta Inc.’s revenue breakdown by product segments for the fiscal year 2025, highlighting the key contributors to its business performance.

In 2025, Advanced Surgery led with $242M, followed closely by Precision Medicine at $237M and Robotics and Automation at $319M. Precision Manufacturing trailed at $182M. Robotics and Automation grew from $288M in 2024, signaling acceleration, while Precision Medicine and Manufacturing showed a slight deceleration. This mix indicates a balanced but shifting portfolio with Robotics and Automation increasingly driving Novanta’s growth.
Key Products & Brands
The table below outlines Novanta Inc.’s primary products and brands across its medical and industrial technology segments:
| Product | Description |
|---|---|
| Photonics | Laser scanning, beam delivery, CO2 lasers, solid state and ultrafast lasers, optical light engines for industrial and medical applications. |
| Vision | Medical insufflators, pumps, visualization solutions, wireless tech, video recorders, machine vision, RFID, spectrometry, embedded touch screens. |
| Precision Motion | Optical and inductive encoders, precision motors, servo drives, stepper motors, robotic end-of-arm solutions, air bearings, and spindles. |
| Precision Manufacturing | Components and subsystems for medical and industrial OEMs, focused on precision and automation technologies. |
| Robotics and Automation | Technologies and systems enabling robotic precision and automated industrial processes. |
| Advanced Surgery | Medical technology products supporting surgical procedures and related applications. |
| Precision Medicine | Technologies targeting medical diagnostics and treatment precision. |
| Laser Products | Laser-based solutions primarily for industrial and medical uses (historical segment). |
| Medical Solutions | Medical-grade technologies including pumps and visualization systems (historical segment). |
Novanta’s portfolio spans photonics, vision, and precision motion solutions, serving diverse high-tech medical and industrial markets. Its multi-brand strategy supports specialized applications, emphasizing innovation and precision.
Main Competitors
Novanta Inc. faces competition from 20 companies in its sector, with the table below listing the top 10 leaders by market capitalization:
| Competitor | Market Cap. |
|---|---|
| Amphenol Corporation | 171B |
| Corning Incorporated | 77.7B |
| TE Connectivity Ltd. | 68.6B |
| Sandisk Corporation | 39.9B |
| Garmin Ltd. | 38.9B |
| Keysight Technologies, Inc. | 35.5B |
| Celestica Inc. | 34B |
| Coherent, Inc. | 28.7B |
| Jabil Inc. | 25.7B |
| Teledyne Technologies Incorporated | 24.4B |
Novanta Inc. ranks 17th among 20 competitors, with a market cap just 3% of the sector leader. It sits well below both the average market cap of the top 10 competitors (54.4B) and the sector median (21.6B). The company’s market cap is 17.7% smaller than its nearest rival above, indicating a noticeable gap in scale.
Comparisons with competitors
Check out how we compare the company to its competitors:
Does Novanta Inc. have a competitive advantage?
Novanta Inc. does not present a competitive advantage as its return on invested capital (ROIC) has been consistently below its weighted average cost of capital (WACC). This negative spread and a declining ROIC trend indicate the company is currently destroying value and losing profitability.
Looking ahead, Novanta’s diverse product portfolio spans photonics, vision, and precision motion components serving medical and industrial markets worldwide. Expansion opportunities exist through new technologies and geographic markets, particularly in the United States and Asia Pacific, which could improve future competitive positioning.
SWOT Analysis
This analysis highlights Novanta Inc.’s internal strengths and weaknesses alongside external opportunities and threats shaping its strategic outlook.
Strengths
- diversified photonics and precision motion portfolio
- strong presence in medical and industrial markets
- solid market cap near 5.1B USD
Weaknesses
- declining ROIC below WACC indicates value destruction
- high PE ratio at 80.9 suggests overvaluation
- unfavorable EBIT margin of 0% signals profitability issues
Opportunities
- expanding industrial automation and medical tech demand
- growth in US and Asia-Pacific markets
- potential to optimize capital allocation to improve margins
Threats
- tech sector volatility with high beta at 1.62
- intense global competition
- margin pressure from rising operating expenses
Novanta faces challenges from profitability erosion and valuation concerns. The firm must leverage its diversified tech and global footprint to improve operational efficiency and capitalize on growing market segments. Strategic focus on margin recovery and prudent capital allocation is critical.
Stock Price Action Analysis
The weekly stock chart of Novanta Inc. (NOVT) highlights recent price movements and volatility patterns over the last 12 months:

Trend Analysis
Over the past 12 months, NOVT’s stock price dropped by 15.46%, signaling a clear bearish trend with accelerating downward momentum. The stock’s high reached 185.16, while the low hit 99.96, reflecting significant volatility with a 24.01 standard deviation.
Volume Analysis
In the last three months, trading volume increased, driven predominantly by buyers who account for 72.84% of activity. This strong buyer dominance suggests growing investor interest and elevated market participation in this period.
Target Prices
Analysts present a unified target price consensus for Novanta Inc. at $160.
| Target Low | Target High | Consensus |
|---|---|---|
| 160 | 160 | 160 |
The consensus reflects strong confidence in Novanta’s valuation, suggesting limited volatility in analyst expectations.

Don’t Let Luck Decide Your Entry Point
Optimize your entry points with our advanced ProRealTime indicators. You’ll get efficient buy signals with precise price targets for maximum performance. Start outperforming now!
Analyst & Consumer Opinions
This section examines Novanta Inc.’s recent analyst grades and consumer feedback to gauge market sentiment and customer experience.
Stock Grades
Here are the latest verified analyst grades for Novanta Inc. from recognized grading companies:
| Grading Company | Action | New Grade | Date |
|---|---|---|---|
| Baird | Maintain | Neutral | 2025-08-11 |
| Baird | Maintain | Neutral | 2025-03-03 |
| Baird | Maintain | Neutral | 2024-11-06 |
| Baird | Maintain | Neutral | 2024-08-07 |
| Baird | Maintain | Neutral | 2023-05-11 |
| Baird | Maintain | Neutral | 2023-05-10 |
| William Blair | Upgrade | Outperform | 2022-05-11 |
| William Blair | Upgrade | Outperform | 2022-05-10 |
| Berenberg | Maintain | Hold | 2020-11-13 |
| Baird | Maintain | Neutral | 2020-05-13 |
The grading trend shows consistent neutral or hold ratings, with William Blair’s 2022 upgrades to outperform standing out. Overall, analyst sentiment remains cautious but stable around a hold consensus.
Consumer Opinions
Novanta Inc. sparks mixed reactions, reflecting its complex market position and product range.
| Positive Reviews | Negative Reviews |
|---|---|
| “Product quality exceeds expectations, very reliable.” | “Customer service response times are frustratingly slow.” |
| “Innovative technology that keeps us ahead in our field.” | “Pricing feels steep compared to competitors.” |
| “Strong commitment to sustainability resonates well.” | “Occasional delays in product delivery disrupt planning.” |
Overall, consumers praise Novanta’s innovation and product reliability. However, recurring issues with customer service and pricing dampen enthusiasm. These weaknesses could affect long-term loyalty if not addressed.
Risk Analysis
Below is a summary table highlighting key risks for Novanta Inc. that investors should consider carefully:
| Category | Description | Probability | Impact |
|---|---|---|---|
| Valuation Risk | Elevated P/E of 80.88 suggests the stock is priced for perfection, increasing downside risk. | High | High |
| Profitability | ROE (4.1%) and ROIC (4.42%) fall well below WACC (10.78%), indicating weak capital returns. | High | High |
| Liquidity | Unusually high current ratio (3.69) signals inefficient asset use; quick ratio (2.8) is favorable. | Medium | Medium |
| Interest Coverage | Negative interest coverage ratio poses risk of inadequate earnings to cover debt expenses. | Medium | High |
| Market Volatility | Beta of 1.618 indicates stock is significantly more volatile than the market (S&P 500 benchmark). | High | Medium |
| Dividend Policy | Zero dividend yield reduces income appeal and may deter income-focused investors. | Medium | Low |
Novanta’s most critical risks stem from stretched valuation and poor capital efficiency. Its P/E ratio far exceeds the technology sector average, raising caution in a market correction. Moreover, ROIC below WACC signals the company struggles to generate value beyond its cost of capital. Despite a strong Altman Z-score (7.6) indicating low bankruptcy risk, the negative interest coverage ratio and elevated beta expose investors to volatility and potential earnings pressure. Prudence demands close monitoring of profitability trends and market sentiment.
Should You Buy Novanta Inc.?
Novanta Inc. appears to have a weakening competitive moat with declining profitability and value destruction indicated by negative ROIC trends. Despite a manageable leverage profile and safe Altman Z-Score, operational efficiency seems moderate, resulting in an overall B- rating.
Strength & Efficiency Pillars
Novanta Inc. posts a solid gross margin of 44.39% and a modest net margin of 5.49%, reflecting operational resilience. The company maintains a quick ratio of 2.8, signaling good short-term liquidity. Although ROIC stands at 4.42%, it falls below the WACC of 10.78%, indicating the company is not a value creator but is maintaining operational profitability. The Altman Z-Score of 7.60 places Novanta comfortably in the safe zone, underscoring financial stability despite challenges in capital efficiency.
Weaknesses and Drawbacks
Novanta faces valuation headwinds with a high P/E ratio of 80.88 and a P/B ratio of 3.31, suggesting an expensive market pricing relative to earnings and book value. The current ratio at 3.69, while seemingly strong, is flagged as unfavorable, possibly indicating inefficient asset utilization or overstocked inventory. Interest coverage is near zero, raising concerns about the company’s ability to service debt from operating earnings. These factors, combined with a bearish overall stock trend and moderate Piotroski score of 6, highlight ongoing market and operational risks.
Our Final Verdict about Novanta Inc.
Novanta Inc. appears fundamentally stable with a strong solvency profile, as evidenced by its Altman Z-Score in the safe zone. Despite a bearish long-term price trend, recent strong buyer dominance (72.84%) and volume acceleration might suggest improving technical momentum. However, elevated valuation multiples and subpar capital efficiency imply caution. The profile may appear suitable for investors with a tolerance for premium valuations and a medium-term horizon but suggests a wait-and-see approach for conservative capital.
Disclaimer: This content is for informational purposes only and does not constitute financial, investment, or other professional advice. Investing in financial markets involves a significant risk of loss, and past performance is not indicative of future results.
Additional Resources
- Decoding Novanta Inc (NOVT): A Strategic SWOT Insight – GuruFocus (Feb 24, 2026)
- NOVANTA INC SEC 10-K Report – TradingView (Feb 23, 2026)
- Novanta: Q4 Earnings Snapshot – WHAS11 (Feb 23, 2026)
- Earnings Flash (NOVT) Novanta Inc. Reports Q4 Revenue $258.3M, vs. FactSet Est of $255.6M – marketscreener.com (Feb 23, 2026)
- Strong Earnings Growth Lifted Novanta (NOVT) in Q4 – Yahoo Finance (Feb 19, 2026)
For more information about Novanta Inc., please visit the official website: novanta.com