Home > Analyses > Industrials > Northrop Grumman Corporation
Northrop Grumman shapes the future of defense and aerospace, powering advanced aircraft, missiles, and space systems that protect nations and enable strategic dominance. As a recognized leader, it delivers cutting-edge unmanned aircraft, hypersonic propulsion, and sophisticated cyber and sensor technologies. The company’s relentless innovation and robust market presence fuel its reputation in a high-barrier industry. The key question: does Northrop Grumman’s current valuation fully reflect its growth potential and strategic positioning in 2026?
Table of contents
Business Model & Company Overview
Northrop Grumman Corporation, founded in 1939 and based in Falls Church, Virginia, commands a leading role in the aerospace and defense sector. Its core business integrates advanced aircraft systems, mission-critical defense technologies, and space solutions into a cohesive ecosystem. This comprehensive portfolio includes unmanned aerial vehicles, strategic ISR systems, missile defense, and cyber capabilities, positioning the company at the forefront of global defense innovation.
The company generates value through a balanced revenue engine combining hardware manufacturing with sophisticated software and recurring services. Its four segments—Aeronautics Systems, Defense Systems, Mission Systems, and Space Systems—serve key markets across the Americas, Europe, and Asia. Northrop Grumman’s competitive advantage lies in its technological integration and lifecycle support, creating a resilient economic moat that shapes the future of defense and aerospace industries.
Financial Performance & Fundamental Metrics
I analyze Northrop Grumman Corporation’s income statement, key financial ratios, and dividend payout policy to assess its core financial health and shareholder value.
Income Statement
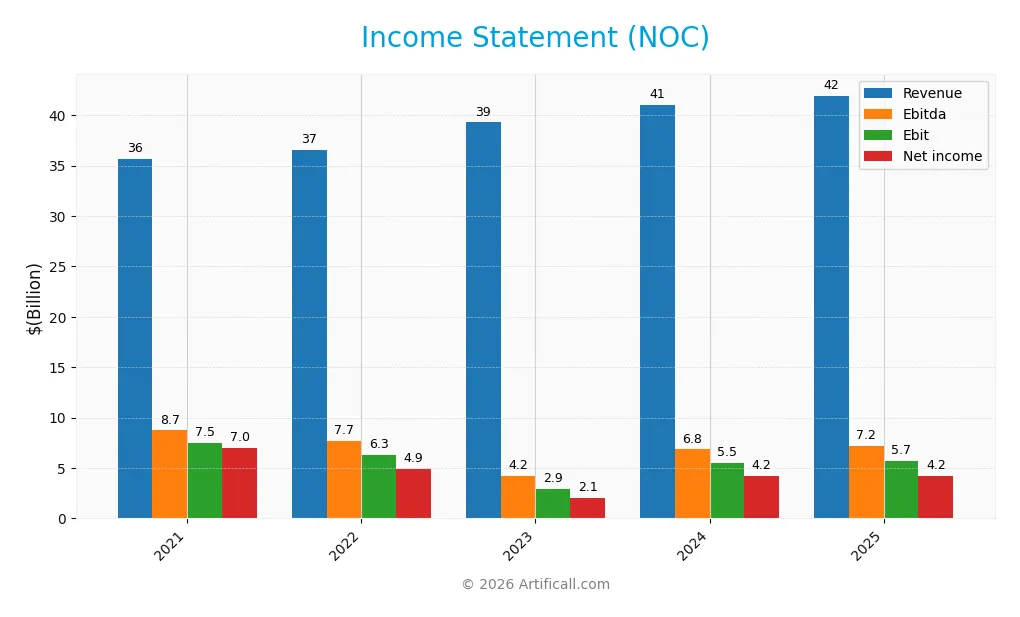
This table summarizes Northrop Grumman Corporation’s key income statement figures for fiscal years 2021 through 2025, showing revenue, expenses, profits, and earnings per share.
| 2021 | 2022 | 2023 | 2024 | 2025 | |
|---|---|---|---|---|---|
| Revenue | 35.7B | 36.6B | 39.3B | 41.0B | 41.9B |
| Cost of Revenue | 28.4B | 29.1B | 32.7B | 32.7B | 33.6B |
| Operating Expenses | 1.6B | 3.9B | 4.0B | 4.0B | 4.0B |
| Gross Profit | 7.3B | 7.5B | 6.6B | 8.4B | 8.3B |
| EBITDA | 8.7B | 7.7B | 4.2B | 6.8B | 7.2B |
| EBIT | 7.5B | 6.3B | 2.9B | 5.5B | 5.7B |
| Interest Expense | 556M | 506M | 545M | 621M | 665M |
| Net Income | 7.0B | 4.9B | 2.1B | 4.2B | 4.2B |
| EPS | 43.7 | 31.6 | 13.6 | 28.4 | 29.1 |
| Filing Date | 2022-01-27 | 2023-01-26 | 2024-01-25 | 2025-01-30 | 2026-01-27 |
Income Statement Evolution
Northrop Grumman’s revenue grew steadily by 17.6% from 2021 to 2025, yet net income declined sharply by 40.3%. Gross margin remained roughly stable near 20%, while EBIT margin improved to a favorable 13.7%. However, net margin contracted significantly over the period, reflecting rising costs or other pressures on profitability.
Is the Income Statement Favorable?
In 2025, revenue rose modestly 2.2% to $41.95B, but gross profit slightly declined, signaling margin pressure. Operating expenses grew in line with revenue, supporting a slight EBIT increase of 4.8%. Net margin near 10% and interest expense at 1.6% of revenue are favorable. Overall, fundamentals appear neutral, balancing margin gains against earnings growth challenges.
Financial Ratios
The following table summarizes key financial ratios for Northrop Grumman Corporation (NOC) over the last five fiscal years:
| Ratios | 2021 | 2022 | 2023 | 2024 | 2025 |
|---|---|---|---|---|---|
| Net Margin | 19.6% | 13.4% | 5.2% | 10.2% | 10.0% |
| ROE | 54.2% | 32.0% | 13.9% | 27.3% | 25.1% |
| ROIC | 13.3% | 9.0% | 6.4% | 9.7% | 9.2% |
| P/E | 8.9x | 17.3x | 34.5x | 16.5x | 19.6x |
| P/B | 4.8x | 5.5x | 4.8x | 4.5x | 4.9x |
| Current Ratio | 1.30 | 1.08 | 1.15 | 1.01 | 1.09 |
| Quick Ratio | 1.22 | 0.99 | 1.05 | 0.91 | 0.99 |
| D/E | 1.13 | 0.98 | 1.08 | 1.20 | 1.18 |
| Debt-to-Assets | 34.4% | 34.3% | 34.5% | 37.3% | 38.4% |
| Interest Coverage | 10.2x | 7.1x | 4.7x | 7.0x | 6.4x |
| Asset Turnover | 0.84 | 0.84 | 0.84 | 0.83 | 0.82 |
| Fixed Asset Turnover | 3.74 | 3.45 | 3.43 | 3.33 | 3.27 |
| Dividend Yield | 1.58% | 1.24% | 1.57% | 1.72% | 1.58% |
This table presents profitability, leverage, liquidity, efficiency, and market valuation metrics essential for evaluating Northrop Grumman’s financial health and performance trends.
Evolution of Financial Ratios
Northrop Grumman’s Return on Equity (ROE) declined from a peak of 54.19% in 2021 to 25.08% in 2025, indicating reduced profitability. The Current Ratio remained relatively stable around 1.0 to 1.3, signaling consistent liquidity. The Debt-to-Equity Ratio increased moderately, reaching 1.18 in 2025, suggesting a gradual rise in leverage.
Are the Financial Ratios Fovorable?
In 2025, profitability shows mixed signals: ROE is favorable at 25.08%, but net margin is neutral at 9.97%. Liquidity ratios like current (1.09) and quick (0.99) are neutral, reflecting balanced short-term financial health. The debt-to-equity ratio of 1.18 is unfavorable, indicating higher leverage risk. Market valuation ratios are mostly neutral, except an unfavorable price-to-book ratio of 4.91. Overall, the financial ratios are slightly favorable with 28.57% favorable metrics.
Shareholder Return Policy
Northrop Grumman maintains a consistent dividend policy with a payout ratio near 31%, a dividend yield around 1.6%, and a stable dividend per share growth. The company supports dividends with sufficient free cash flow, balancing shareholder returns and capital expenditures.
Share buybacks are also part of the return strategy, complementing dividends without risking unsustainable distributions. This balanced approach indicates a focus on long-term shareholder value, underpinned by robust cash flow coverage and prudent capital allocation.
Score analysis
The following radar chart illustrates Northrop Grumman Corporation’s key financial scores across valuation, profitability, and leverage metrics:
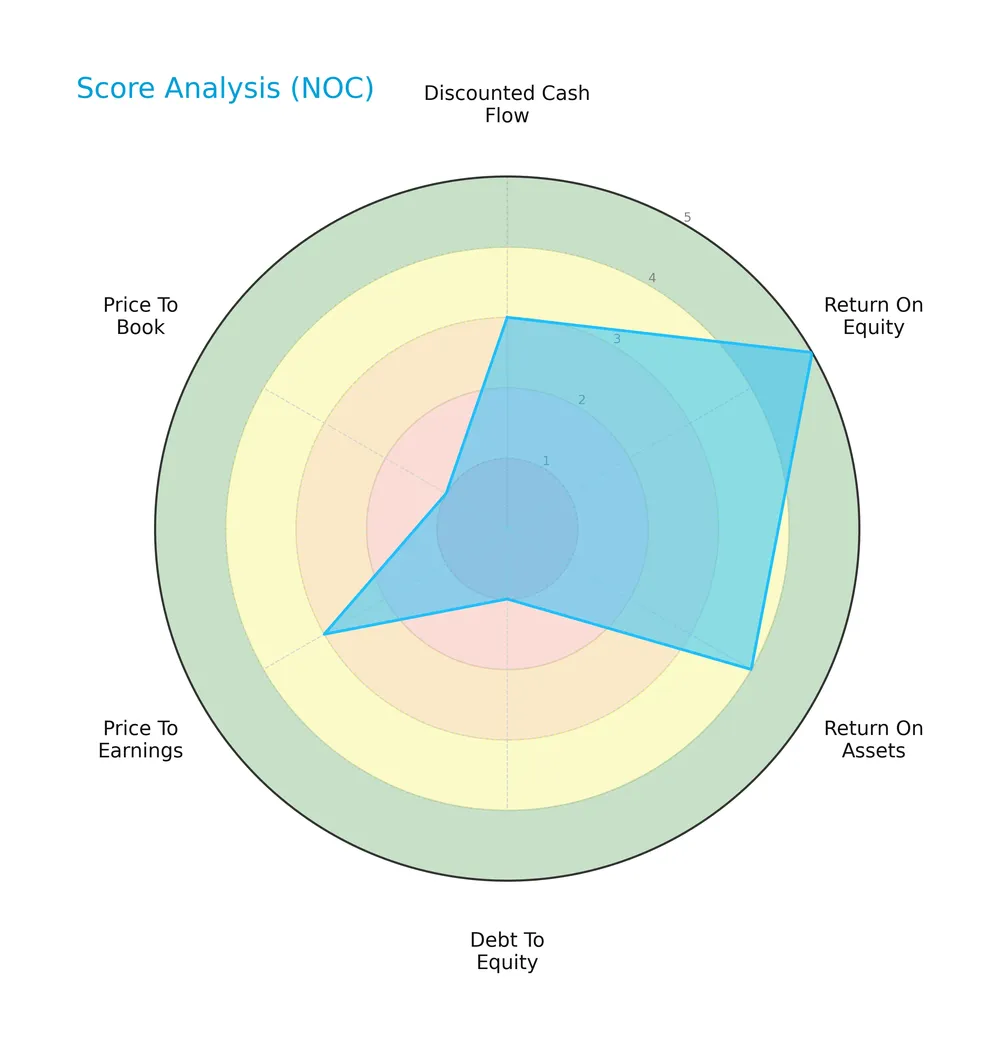
The company shows a very favorable return on equity (5) and a favorable return on assets (4). However, debt-to-equity and price-to-book scores are very unfavorable (1 each). Discounted cash flow and price-to-earnings scores remain moderate (3 each).
Analysis of the company’s bankruptcy risk
Northrop Grumman’s Altman Z-Score places it securely in the safe zone, indicating a low risk of bankruptcy and strong financial stability:

Is the company in good financial health?
The Piotroski Score chart assesses Northrop Grumman’s financial strength and operational efficiency:
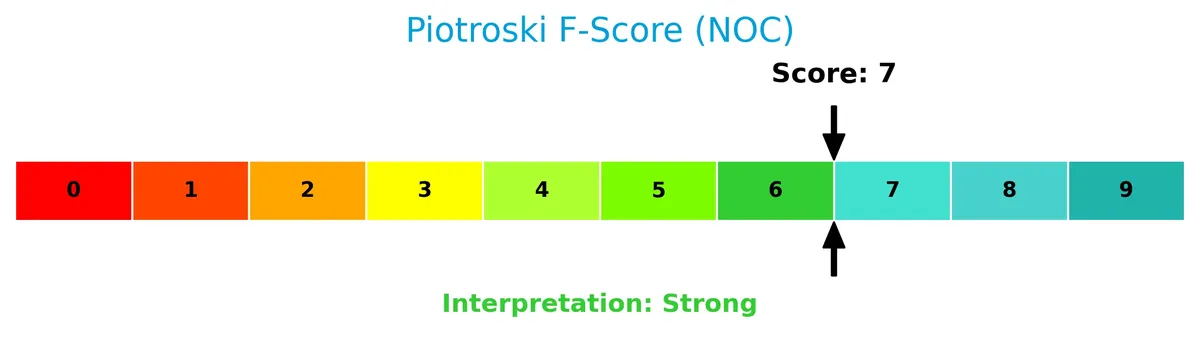
With a strong Piotroski Score of 7, the company demonstrates solid financial health, reflecting robust profitability and effective capital management.
Competitive Landscape & Sector Positioning
This section analyzes Northrop Grumman Corporation’s strategic positioning, revenue segments, key products, and main competitors. I will examine whether the company holds a competitive advantage relative to its peers in aerospace and defense.
Strategic Positioning
Northrop Grumman diversifies across four key aerospace and defense segments: Aeronautics, Defense, Mission, and Space Systems, each generating multi-billion-dollar revenues. Its geographic exposure heavily concentrates in the U.S., with smaller but consistent sales in Europe and Asia Pacific, reflecting a focused yet multi-regional footprint.
Revenue by Segment
The pie chart illustrates Northrop Grumman’s revenue distribution by segment for fiscal year 2025, highlighting the primary business drivers within the defense industry.
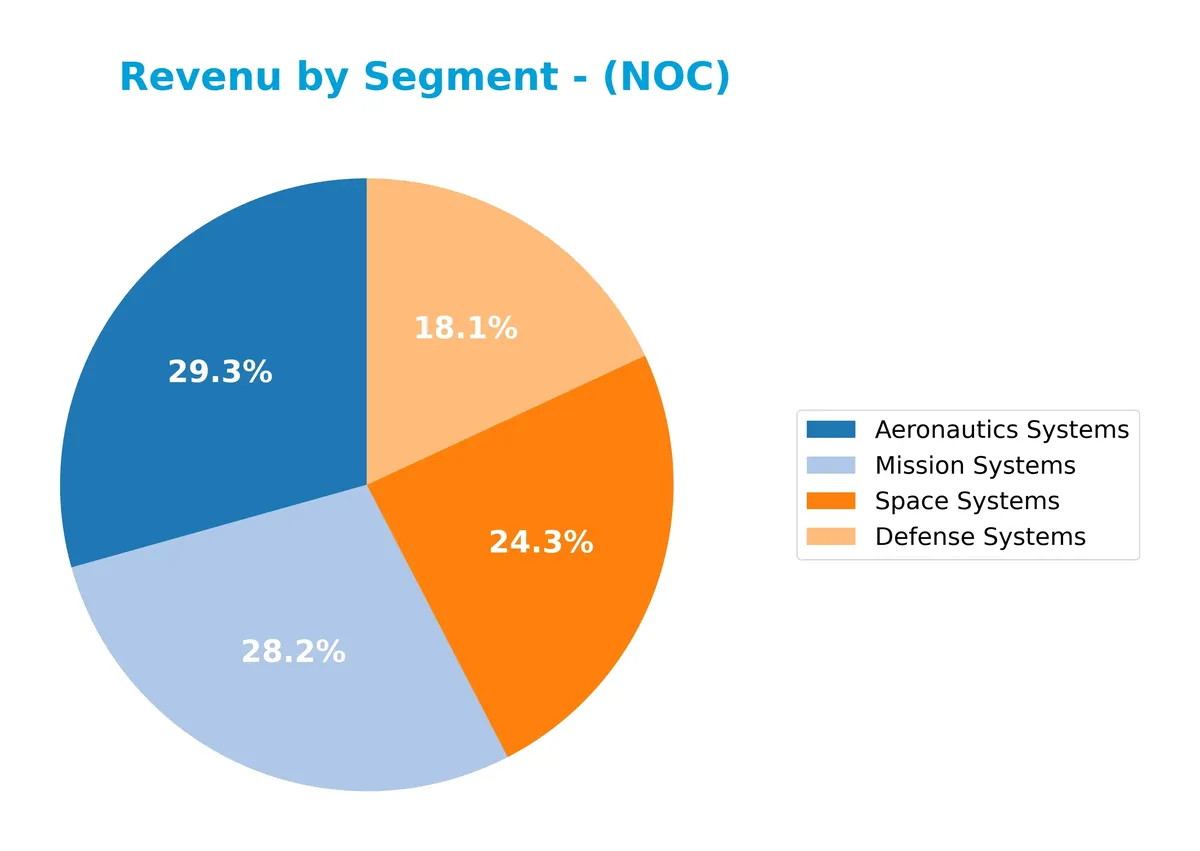
In 2025, Aeronautics Systems led with $13B, closely followed by Mission Systems at $12.5B and Space Systems at $10.8B. Defense Systems contributed $8B, showing relative stability. Notably, Aeronautics and Mission Systems accelerated growth compared to 2024, while Space Systems declined slightly. This mix emphasizes Northrop Grumman’s strong aerospace and mission-focused moats, but the dip in Space Systems signals potential concentration risk if trends persist.
Key Products & Brands
Northrop Grumman’s core offerings span aerospace, defense, mission systems, and space technologies:
| Product | Description |
|---|---|
| Aeronautics Systems | Designs, develops, and sustains aircraft systems, including unmanned and strategic strike aircraft. |
| Defense Systems | Produces weapons, integrated battle management, precision munitions, and propulsion systems. |
| Mission Systems | Provides cyber, command and control, intelligence, surveillance, and advanced communication systems. |
| Space Systems | Offers satellites, missile defense, launch vehicles, and strategic missile technologies. |
Northrop Grumman’s product portfolio reflects a diversified aerospace and defense strategy. Each segment addresses critical defense needs, from air dominance to space-based capabilities, supporting stable revenue streams across evolving military priorities.
Main Competitors
There are 12 competitors in total. The table below lists the top 10 leaders by market capitalization:
| Competitor | Market Cap. |
|---|---|
| GE Aerospace | 338B |
| RTX Corporation | 251B |
| The Boeing Company | 171B |
| Lockheed Martin Corporation | 116B |
| General Dynamics Corporation | 93B |
| Northrop Grumman Corporation | 84B |
| TransDigm Group Incorporated | 77B |
| L3Harris Technologies, Inc. | 57B |
| Axon Enterprise, Inc. | 44B |
| BWX Technologies, Inc. | 17B |
Northrop Grumman ranks 6th among its peers with a market cap at 29.2% of the leader, GE Aerospace. It sits below the average market cap of the top 10 (124.8B) but above the sector median (80B). The company is positioned roughly 6.3% behind its closest larger competitor, General Dynamics, indicating a narrow gap in scale.
Comparisons with competitors
Check out how we compare the company to its competitors:
Does NOC have a competitive advantage?
Northrop Grumman demonstrates a slight competitive advantage by generating an ROIC 4.8% above its WACC, indicating value creation despite a declining profitability trend. Its EBIT margin of 13.7% and net margin near 10% remain favorable compared to aerospace and defense peers.
Looking ahead, Northrop Grumman’s diversified segments in aeronautics, defense systems, mission systems, and space position it to capitalize on growing ISR, cyber, hypersonic, and missile defense markets worldwide. Expansion in Asia Pacific and Europe also offers meaningful opportunities to offset U.S. market concentration.
SWOT Analysis
This SWOT analysis highlights Northrop Grumman’s key strategic factors shaping its competitive position and growth potential.
Strengths
- strong ROE at 25%
- diverse aerospace & defense portfolio
- solid Altman Z-score in safe zone
Weaknesses
- declining ROIC trend
- high debt-to-equity ratio
- net income and margin declines over 5 years
Opportunities
- expanding international sales in Asia Pacific and Europe
- growing demand for hypersonic and cyber systems
- government defense spending increases
Threats
- geopolitical risks impacting contracts
- intense competition in defense sector
- supply chain and inflation pressures
Northrop Grumman’s strengths in profitability and product breadth support resilience. However, weakening returns and leverage require caution. The company must leverage growth opportunities abroad and in advanced tech while managing geopolitical and financial risks.
Stock Price Action Analysis
The weekly price chart reveals Northrop Grumman Corporation’s significant upward momentum and notable volatility over the recent periods:
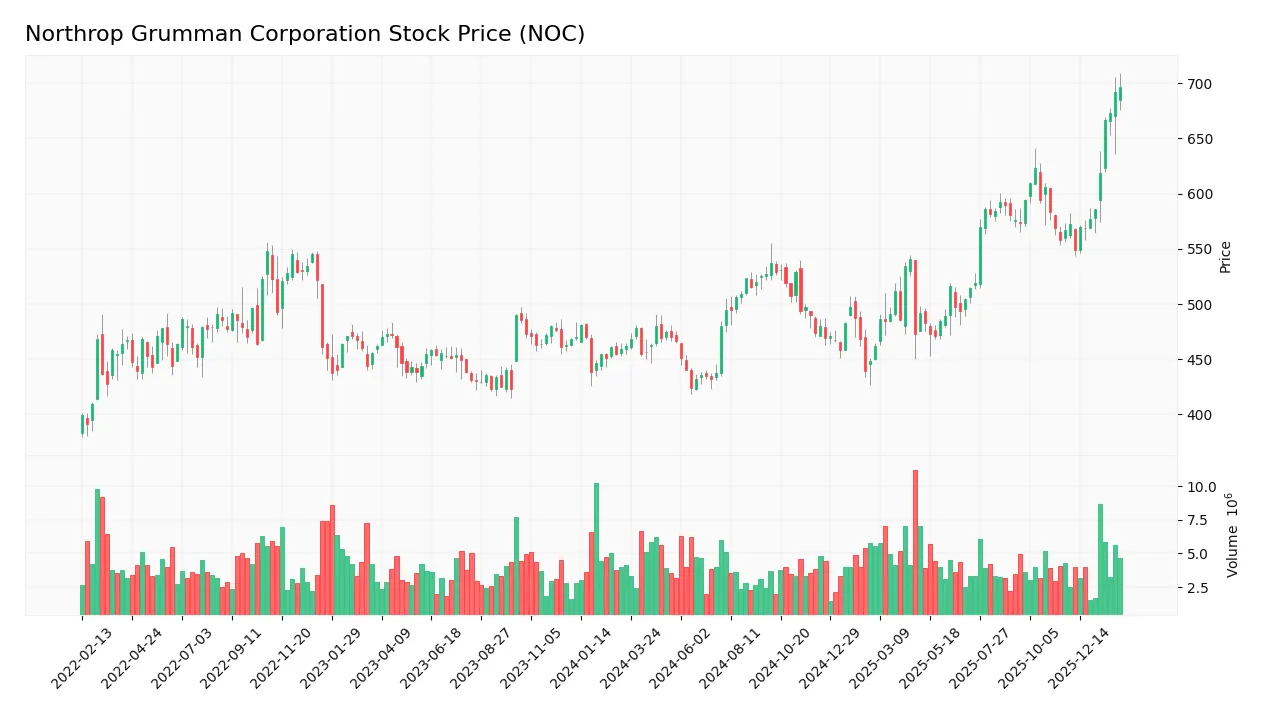
Trend Analysis
Over the past two years, the stock increased by 50.84%, indicating a bullish trend with accelerating gains. The price ranged from a low of 424.09 to a high of 696.5. Volatility remains elevated with a 60.0 standard deviation, underscoring pronounced price swings.
Volume Analysis
Trading volume is decreasing overall, with 56.24% buyer participation across 500M shares. Recent three-months data show strong buyer dominance at 83.77%, suggesting robust investor demand despite lower turnover. This points to selective accumulation rather than broad market enthusiasm.
Target Prices
Analysts set a firm target consensus for Northrop Grumman Corporation, reflecting strong confidence.
| Target Low | Target High | Consensus |
|---|---|---|
| 623 | 815 | 732.25 |
The target range suggests upside potential from current levels, indicating analysts anticipate solid growth or valuation expansion.

Don’t Let Luck Decide Your Entry Point
Optimize your entry points with our advanced ProRealTime indicators. You’ll get efficient buy signals with precise price targets for maximum performance. Start outperforming now!
Analyst & Consumer Opinions
This section examines analyst ratings and consumer feedback to provide insight into Northrop Grumman Corporation’s market perception.
Stock Grades
Here are the latest credible stock grades for Northrop Grumman Corporation from recognized analysts:
| Grading Company | Action | New Grade | Date |
|---|---|---|---|
| Jefferies | Maintain | Hold | 2026-02-02 |
| RBC Capital | Maintain | Outperform | 2026-01-28 |
| BTIG | Maintain | Buy | 2026-01-28 |
| B of A Securities | Maintain | Buy | 2026-01-28 |
| UBS | Maintain | Buy | 2026-01-28 |
| Citigroup | Maintain | Buy | 2026-01-28 |
| UBS | Maintain | Buy | 2026-01-15 |
| Citigroup | Maintain | Buy | 2026-01-13 |
| Truist Securities | Downgrade | Hold | 2026-01-09 |
| Morgan Stanley | Maintain | Overweight | 2025-12-16 |
The overall trend shows a strong bias toward buying, with multiple firms maintaining Buy or Outperform ratings. A few Hold ratings indicate some caution but no broad negative sentiment.
Consumer Opinions
Northrop Grumman Corporation enjoys a strong reputation for innovation, but some customers raise concerns about service responsiveness.
| Positive Reviews | Negative Reviews |
|---|---|
| Products demonstrate cutting-edge technology | Customer support can be slow to respond |
| Reliable performance in defense contracts | Pricing perceived as high by some clients |
| Strong commitment to security and quality | Occasional delays in project delivery |
Overall, consumers praise Northrop Grumman’s technological edge and quality. However, recurring issues with customer service speed and pricing warrant attention for sustained satisfaction.
Risk Analysis
Below is a summary of key risks facing Northrop Grumman Corporation, highlighting their likelihood and potential impact on investors:
| Category | Description | Probability | Impact |
|---|---|---|---|
| Financial Leverage | Debt-to-equity ratio is high at 1.18, increasing financial risk and interest obligations. | Medium | Medium |
| Valuation | Price-to-book ratio at 4.91 is unfavorable, indicating possible overvaluation risk. | Medium | Medium |
| Operational | Aerospace & defense sector exposed to government budget cuts or contract delays. | Medium | High |
| Market Volatility | Extremely low beta (0.039) suggests limited price movement, potential liquidity risk. | Low | Low |
| Innovation & Tech | Rapid technology changes could render some defense systems obsolete without timely upgrades. | Medium | High |
The most concerning risks are operational and technological. Defense budgets fluctuate with geopolitical tensions, directly impacting revenue. Technological obsolescence threatens long-term moat sustainability. Financial leverage is manageable but warrants caution. Overall, Northrop Grumman operates in a stable sector but must navigate these risks carefully.
Should You Buy Northrop Grumman Corporation?
Northrop Grumman appears to have a slightly favorable moat with solid value creation despite a declining ROIC trend. Its profitability is robust, yet the leverage profile is substantial. Supported by a B rating, the financial health suggests moderate investment appeal.
Strength & Efficiency Pillars
Northrop Grumman Corporation exhibits solid profitability with a net margin of 9.97% and a return on equity of 25.08%, signaling efficient capital use. The company’s ROIC stands at 9.21%, comfortably above its WACC of 4.42%, confirming it as a clear value creator. Financial health appears robust, supported by an Altman Z-Score of 3.40, placing it safely above bankruptcy risk. Additionally, a strong Piotroski score of 7 reinforces its sound financial strength and operational stability.
Weaknesses and Drawbacks
Despite strengths, valuation metrics raise caution. The price-to-book ratio of 4.91 is unfavorable, indicating a premium valuation that may limit upside. Leverage is a tangible risk, with a debt-to-equity ratio of 1.18 flagged as unfavorable. Liquidity metrics like a current ratio of 1.09 and quick ratio of 0.99 remain neutral but leave little margin for short-term distress. While the overall volume trend is decreasing, buyer dominance at 83.77% in the recent period suggests some short-term market enthusiasm.
Our Verdict about Northrop Grumman Corporation
Northrop Grumman’s long-term fundamental profile appears favorable, driven by value creation and financial stability. Given the bullish overall stock trend and strong recent buyer dominance, the profile may appear attractive for long-term exposure. However, elevated leverage and valuation metrics suggest investors could benefit from careful risk management before committing capital.
Disclaimer: This content is for informational purposes only and does not constitute financial, investment, or other professional advice. Investing in financial markets involves a significant risk of loss, and past performance is not indicative of future results.
Additional Resources
- Northrop Grumman Awarded Contracting Tool to Accelerate American-Made Microelectronics into Military Systems – Northrop Grumman (Feb 03, 2026)
- J.W. Cole Advisors Inc. Grows Stock Holdings in Northrop Grumman Corporation $NOC – MarketBeat (Feb 05, 2026)
- Northrop Grumman Systems secures $249M US Air Force contract – MSN (Feb 05, 2026)
- Northrop Grumman Corporation $NOC Stock Position Trimmed by Bessemer Group Inc. – MarketBeat (Feb 05, 2026)
- Northrop Grumman’s SMART Demo Tests Second Advanced Solid Rocket Motor and Achieves Successful Firing in Two Months – Northrop Grumman (Jan 30, 2026)
For more information about Northrop Grumman Corporation, please visit the official website: northropgrumman.com