Home > Analyses > Financial Services > Northern Trust Corporation
Northern Trust Corporation safeguards and grows wealth for some of the world’s most discerning clients. It commands respect with its industry-leading asset servicing and wealth management solutions. Known for innovation and meticulous client care, it serves institutions and high-net-worth families alike. As markets evolve, I question whether Northern Trust’s strong fundamentals still justify its premium valuation and growth prospects in a competitive financial landscape.

Table of contents
Business Model & Company Overview
Northern Trust Corporation, founded in 1889 and based in Chicago, dominates the asset management sector with a comprehensive suite of wealth management and asset servicing solutions. Its core business integrates services for corporations, institutions, and high-net-worth individuals, creating a cohesive financial ecosystem. The company supports complex investment operations, banking, and fiduciary needs, reflecting its deep expertise and longstanding market presence.
Northern Trust generates revenue through a balanced mix of asset servicing and wealth management segments, blending custody, investment management, and banking services. It leverages a strategic footprint across the Americas, Europe, and Asia to serve institutional investors and affluent clients worldwide. This competitive advantage in global markets underpins a durable economic moat, positioning Northern Trust as a pivotal force shaping the future of financial services.
Financial Performance & Fundamental Metrics
I analyze Northern Trust Corporation’s income statement, key financial ratios, and dividend payout policy to assess its core financial health and shareholder value creation.
Income Statement
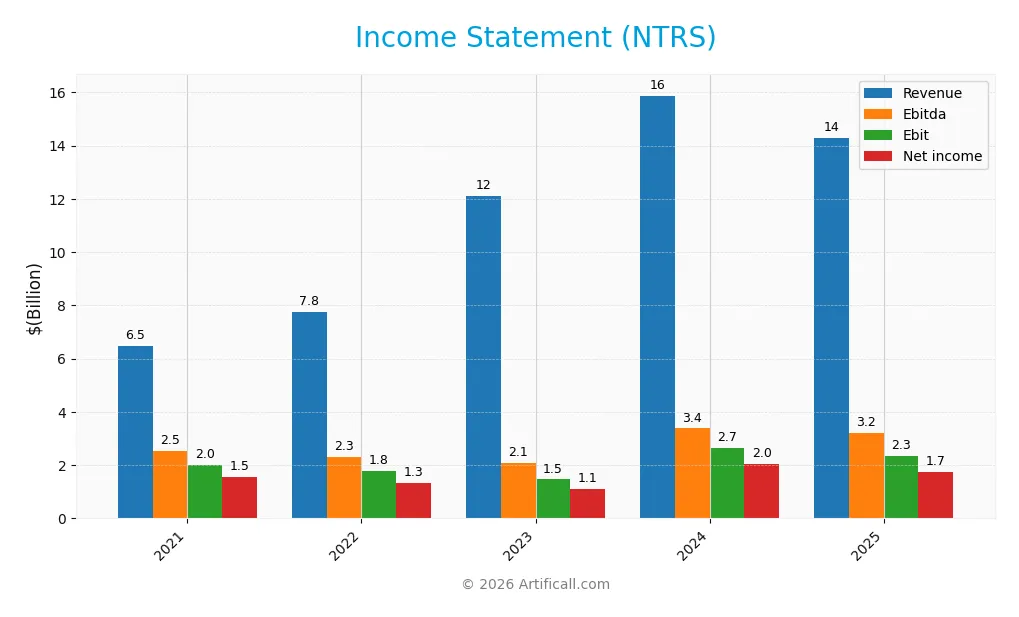
The table below summarizes Northern Trust Corporation’s key income statement figures from 2021 through 2025, highlighting revenue, expenses, profits, and EPS.
| 2021 | 2022 | 2023 | 2024 | 2025 | |
|---|---|---|---|---|---|
| Revenue | 6.49B | 7.75B | 12.12B | 15.88B | 14.30B |
| Cost of Revenue | -57.7M | 1.00B | 5.37B | 7.58B | 6.21B |
| Operating Expenses | 4.54B | 4.98B | 5.28B | 5.63B | 5.75B |
| Gross Profit | 6.55B | 6.75B | 6.75B | 8.29B | 8.09B |
| EBITDA | 2.53B | 2.32B | 2.10B | 3.38B | 3.21B |
| EBIT | 2.01B | 1.77B | 1.46B | 2.66B | 2.33B |
| Interest Expense | 23.8M | 991M | 5.34B | 7.59B | 6.21B |
| Net Income | 1.55B | 1.34B | 1.11B | 2.03B | 1.74B |
| EPS | 7.16 | 6.16 | 5.09 | 9.80 | 8.79 |
| Filing Date | 2022-02-28 | 2023-02-28 | 2024-02-27 | 2025-02-24 | 2026-02-24 |
Income Statement Evolution
Northern Trust Corporation’s revenue grew 120% from 2021 to 2025 but declined nearly 10% from 2024 to 2025. Net income rose 12% over the full period but dropped 5% in margin and 10% in EPS last year. Gross and EBIT margins remain favorable at 56.5% and 16.3%, respectively, despite slight margin compression.
Is the Income Statement Favorable?
In 2025, Northern Trust posted $14.3B revenue and $1.7B net income, with a 12.15% net margin—still favorable versus industry peers. However, interest expense consumes 43.5% of revenue, a clear weakness. Year-on-year declines in revenue, EBIT (-12%) and EPS (-10.5%) highlight near-term pressure, resulting in an overall unfavorable income statement assessment.
Financial Ratios
The table below summarizes Northern Trust Corporation’s key financial ratios for the fiscal years 2021 through 2025:
| Ratios | 2021 | 2022 | 2023 | 2024 | 2025 |
|---|---|---|---|---|---|
| Net Margin | 24% | 17% | 9% | 13% | 12% |
| ROE | 13% | 12% | 9% | 16% | 13% |
| ROIC | 6% | 4% | 3% | 6% | 5% |
| P/E | 16.1 | 13.8 | 15.8 | 10.2 | 14.7 |
| P/B | 2.07 | 1.64 | 1.47 | 1.61 | 1.98 |
| Current Ratio | 0.68 | 0.60 | 0.54 | 0.45 | 0.41 |
| Quick Ratio | 0.68 | 0.60 | 0.54 | 0.45 | 0.41 |
| D/E | 0.70 | 1.32 | 1.45 | 1.25 | 1.27 |
| Debt-to-Assets | 4.6% | 9.6% | 11.4% | 10.3% | 9.3% |
| Interest Coverage | 84.5 | 1.78 | 0.27 | 0.35 | 0.38 |
| Asset Turnover | 0.04 | 0.05 | 0.08 | 0.10 | 0.08 |
| Fixed Asset Turnover | 13.3 | 15.5 | 24.1 | 32.4 | 30.8 |
| Dividend Yield | 2.5% | 4.3% | 3.8% | 3.1% | 2.3% |
*Net Margin, ROE, and ROIC are expressed in percentages for clarity. *D/E reflects Debt-to-Equity ratio. *Interest Coverage shows significant volatility, dropping sharply after 2021. *Current and Quick Ratios remain below 1.0, indicating liquidity constraints.
Evolution of Financial Ratios
Northern Trust’s Return on Equity (ROE) showed volatility, peaking at 15.9% in 2024 before settling at 13.4% in 2025. The Current Ratio steadily declined from 0.68 in 2021 to 0.41 in 2025, signaling weakening liquidity. Debt-to-Equity remained elevated around 1.25–1.45, indicating consistent leverage with minimal improvement in profitability margins.
Are the Financial Ratios Favorable?
In 2025, profitability measured by net margin at 12.15% is favorable but ROE and ROIC remain neutral against a high WACC of 16.88%, which is unfavorable. Liquidity ratios (current and quick) at 0.41 are weak. Leverage is high with a debt-to-equity ratio of 1.27 and low interest coverage of 0.38, both unfavorable. Asset turnover is low, but fixed asset turnover and dividend yield are favorable. Overall, ratios skew slightly unfavorable.
Shareholder Return Policy
Northern Trust Corporation maintains a dividend payout ratio around 32-60%, with a stable dividend per share near $3.15-$3.82 and an annual yield of approximately 2.3%-4.3%. The dividend payments are well-covered by free cash flow, supporting consistent shareholder returns.
The company also conducts share buybacks, complementing dividends to return capital. This balanced approach of dividends and buybacks reflects a prudent policy aimed at sustainable long-term shareholder value creation, avoiding excessive distributions or repurchases that could strain cash flow.
Score analysis
Here is a radar chart illustrating Northern Trust Corporation’s key financial scores across valuation and performance metrics:
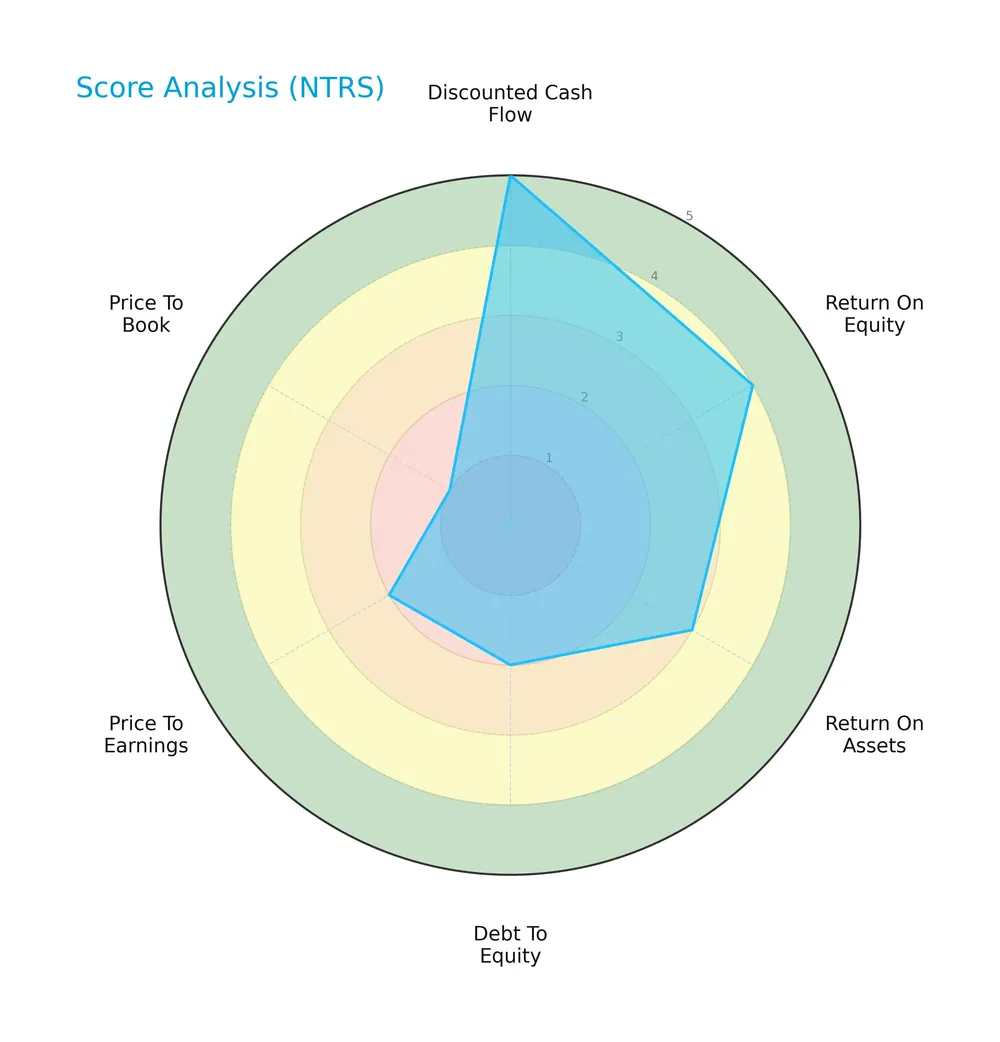
Northern Trust scores very favorably on discounted cash flow (5) and favorably on return on equity (4). Return on assets is moderate (3). Debt to equity (2), price to earnings (2), and price to book (1) scores are unfavorable to very unfavorable, indicating valuation and leverage concerns.
Analysis of the company’s bankruptcy risk
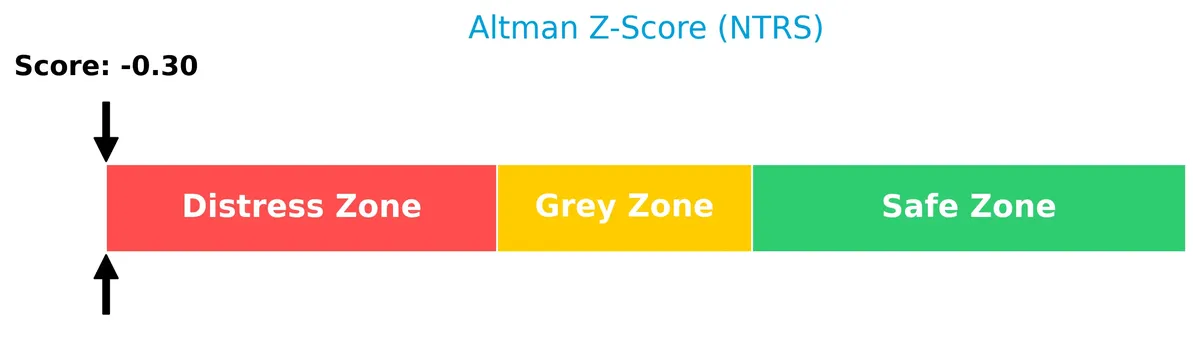
Northern Trust’s Altman Z-Score places it in the distress zone, signaling a high risk of financial distress and potential bankruptcy:
Is the company in good financial health?
The Piotroski Score chart provides insight into Northern Trust’s overall financial strength and operational efficiency:

With a Piotroski Score of 7, Northern Trust demonstrates strong financial health, reflecting solid profitability and balance sheet quality despite other risk indicators.
Competitive Landscape & Sector Positioning
This sector analysis examines Northern Trust Corporation’s strategic positioning, revenue breakdown, key products, and main competitors. I will assess whether Northern Trust holds a competitive advantage over its peers in asset management and wealth services.
Strategic Positioning
Northern Trust maintains a focused portfolio with two main segments: Asset Servicing and Wealth Management, generating $8.1B revenue in 2025. Its geographic exposure is diversified but US-centric, with $5.7B domestic and $2.4B foreign revenue, balancing institutional and high-net-worth client bases.
Revenue by Segment
This pie chart illustrates Northern Trust Corporation’s revenue distribution by segment for the fiscal year 2025, highlighting key business drivers and their relative scale.
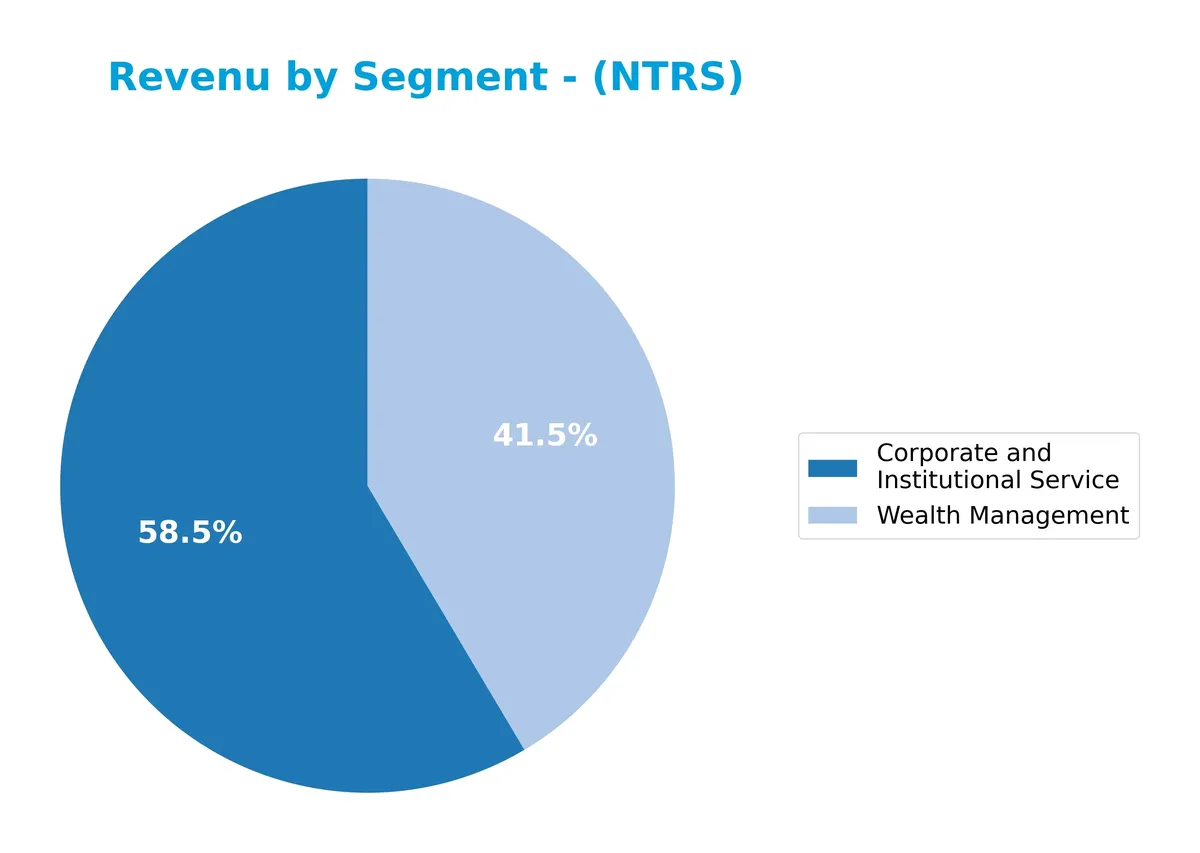
In 2025, Corporate and Institutional Services led with $4.8B, surpassing Wealth Management at $3.4B. This marks a shift from prior years when Asset Servicing (now Corporate and Institutional Services) and Wealth Management were closer in size. Wealth Management shows steady growth since 2017, but the concentration in Corporate and Institutional Services suggests a strategic focus on institutional clients, increasing revenue diversification and reducing reliance on a single segment.
Key Products & Brands
Northern Trust Corporation generates revenue through two primary segments, offering diverse financial services and solutions:
| Product | Description |
|---|---|
| Asset Servicing | Custody, fund administration, investment operations outsourcing, risk and analytical services, securities lending, and banking. |
| Wealth Management | Trust, investment management, financial consulting, estate administration, family business consulting, and private banking. |
Northern Trust’s core offerings split between institutional asset servicing and personalized wealth management. These segments serve a broad client base, from large institutions to high-net-worth individuals, reflecting a balanced business model within financial services.
Main Competitors
Northern Trust Corporation operates in a competitive field with 11 main rivals; here are the top 10 leaders by market capitalization:
| Competitor | Market Cap. |
|---|---|
| Blackstone Inc. | 191B |
| BlackRock, Inc. | 168B |
| KKR & Co. Inc. | 115B |
| The Bank of New York Mellon Corporation | 82B |
| Ares Management Corporation | 55B |
| Ameriprise Financial, Inc. | 46B |
| State Street Corporation | 36B |
| Northern Trust Corporation | 26B |
| T. Rowe Price Group, Inc. | 23B |
| Franklin Resources, Inc. | 12B |
Northern Trust ranks 8th among its peers, holding roughly 14% of the market cap of the sector leader, Blackstone. It sits below both the average market cap of the top 10 competitors (75B) and the sector median (46B). The company maintains a significant 34.8% gap from the next competitor above, State Street, underscoring a distinct scale difference.
Comparisons with competitors
Check out how we compare the company to its competitors:
Does NTRS have a competitive advantage?
Northern Trust Corporation currently lacks a competitive advantage, as its return on invested capital (ROIC) falls significantly below its weighted average cost of capital (WACC). The firm shows a declining ROIC trend, indicating decreasing profitability and value destruction over the 2021-2025 period.
Looking ahead, Northern Trust’s broad asset management and wealth management services cover diverse client segments globally, with expanding foreign revenue. Continued innovation in asset servicing and wealth solutions may offer future growth opportunities in evolving markets.
SWOT Analysis
This SWOT analysis highlights Northern Trust Corporation’s core competitive factors and challenges to guide strategic decisions.
Strengths
- strong brand legacy since 1889
- diversified services in wealth and asset management
- favorable gross margin of 56.5%
Weaknesses
- declining revenue and net margin growth recently
- unfavorable liquidity ratios (current ratio 0.41)
- ROIC below WACC, indicating value destruction
Opportunities
- expanding international presence with growing foreign revenue
- rising demand for integrated financial services
- potential to improve operational efficiency and digital offerings
Threats
- intense competition in asset management sector
- macroeconomic volatility impacting client assets
- regulatory pressures increasing compliance costs
Northern Trust faces headwinds from shrinking margins and weak liquidity but benefits from a solid brand and diverse offerings. Strategic focus on international growth and operational efficiency is critical to offset risks and restore value creation.
Stock Price Action Analysis
The weekly stock chart illustrates Northern Trust Corporation’s price movements, highlighting critical patterns and volatility dynamics over the past 12 months:
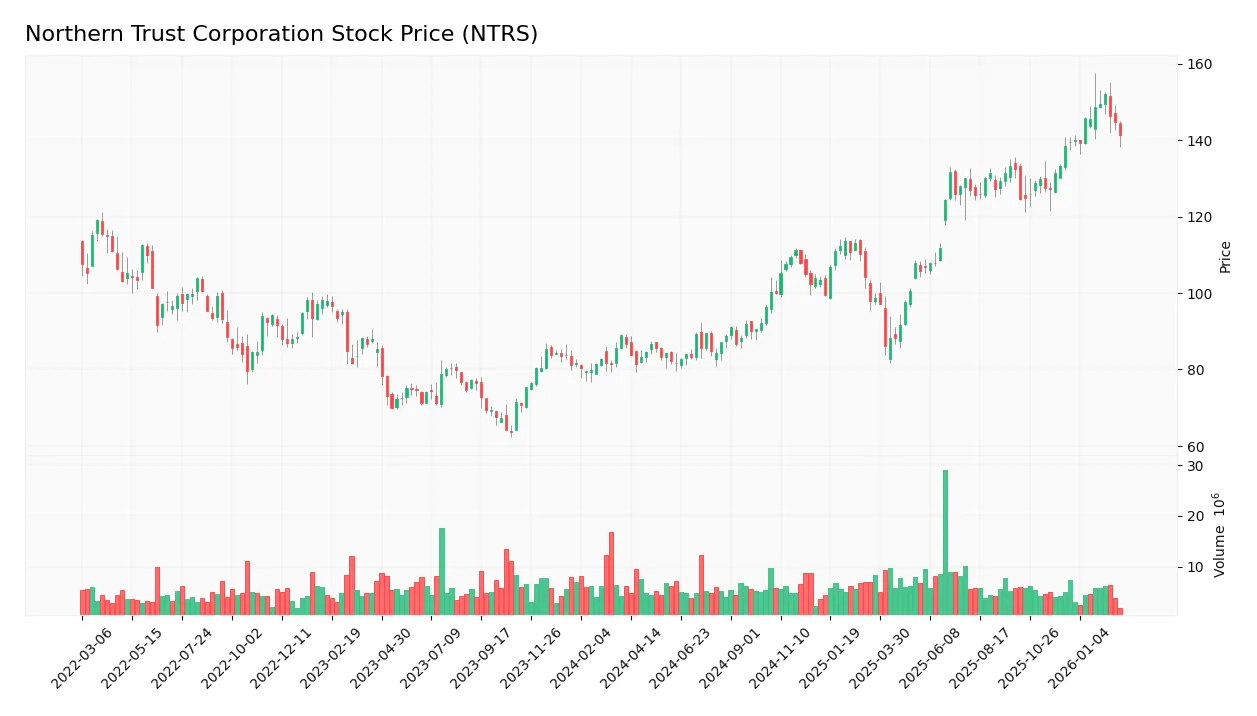
Trend Analysis
Over the past 12 months, NTRS’s stock price rose 62.95%, indicating a strong bullish trend with clear acceleration. The price ranged from a low of 81.45 to a high of 152.15. Volatility remains elevated with a 20.57 standard deviation, suggesting significant price swings.
Volume Analysis
Trading volume shows a buyer-driven pattern with 59.33% of total volume attributed to buyers. However, the overall volume trend is decreasing, indicating waning market participation despite sustained buyer dominance. This suggests cautious investor sentiment amid diminishing activity.
Target Prices
Analysts present a solid target consensus for Northern Trust Corporation.
| Target Low | Target High | Consensus |
|---|---|---|
| 131 | 160 | 146.17 |
The target range signals moderate upside potential, reflecting confidence in Northern Trust’s stable earnings and robust capital allocation.

Don’t Let Luck Decide Your Entry Point
Optimize your entry points with our advanced ProRealTime indicators. You’ll get efficient buy signals with precise price targets for maximum performance. Start outperforming now!
Analyst & Consumer Opinions
This section reviews expert grades and customer feedback to gauge Northern Trust Corporation’s market reputation and service quality.
Stock Grades
Below is a summary of recent credible grades from established financial institutions for Northern Trust Corporation:
| Grading Company | Action | New Grade | Date |
|---|---|---|---|
| Citigroup | Maintain | Neutral | 2026-01-28 |
| Goldman Sachs | Maintain | Sell | 2026-01-28 |
| TD Cowen | Maintain | Buy | 2026-01-26 |
| Morgan Stanley | Maintain | Underweight | 2026-01-23 |
| Wells Fargo | Maintain | Equal Weight | 2026-01-23 |
| Evercore ISI Group | Maintain | In Line | 2026-01-23 |
| RBC Capital | Maintain | Outperform | 2026-01-23 |
| TD Cowen | Maintain | Buy | 2026-01-07 |
| Barclays | Maintain | Equal Weight | 2026-01-05 |
| Citigroup | Maintain | Neutral | 2025-12-30 |
The grade trend for Northern Trust shows a mixed but stable outlook, with most firms maintaining their ratings. Buy and hold recommendations dominate, reflecting cautious investor sentiment.
Consumer Opinions
Northern Trust Corporation inspires varied consumer sentiment, reflecting its position as a trusted financial institution with room for improvement.
| Positive Reviews | Negative Reviews |
|---|---|
| “Exceptional wealth management services and expert advice.” | “Customer service response times can be slow.” |
| “Highly reliable with strong digital tools.” | “Fees are higher compared to competitors.” |
| “Transparent communication and personalized support.” | “Mobile app occasionally experiences glitches.” |
Overall, consumers praise Northern Trust’s expertise and personalized service. However, recurring complaints about service speed and fees suggest areas where the company could sharpen its competitive edge.
Risk Analysis
Below is a summary table of Northern Trust Corporation’s key risks, their likelihood, and potential impact on the business:
| Category | Description | Probability | Impact |
|---|---|---|---|
| Liquidity Risk | Current and quick ratios at 0.41 signal weak short-term liquidity and potential cash stress. | High | High |
| Leverage Risk | Debt-to-equity ratio of 1.27 indicates relatively high leverage, increasing financial strain. | Medium | Medium |
| Profitability vs. Cost of Capital | ROIC at 5.04% falls well below WACC of 16.88%, implying value destruction and capital inefficiency. | High | High |
| Bankruptcy Risk | Altman Z-Score in distress zone (-0.30) suggests elevated risk of financial distress. | Medium | High |
| Market Volatility | Beta of 1.28 exposes stock to above-average market swings, increasing price volatility. | High | Medium |
| Valuation Concerns | Unfavorable P/E and very unfavorable P/B scores hint at potential overvaluation risks. | Medium | Medium |
| Earnings Stability | Moderate Piotroski score (7) signals reasonable financial health but some operational risks remain. | Medium | Medium |
The most pressing risks for Northern Trust are its poor liquidity and capital inefficiency. Historically in financial services, a firm with ROIC materially below WACC struggles to generate shareholder value and faces heightened distress. The Altman Z-Score confirms this vulnerability, putting the company in a distress zone. Investors should watch liquidity closely, as the company’s low current ratio signals tight cash flow buffers. Market volatility adds external risk, but internal financial weaknesses pose the greatest threat to stability.
Should You Buy Northern Trust Corporation?
Northern Trust appears to be in financial distress despite a strong Piotroski score suggesting operational efficiency. Its competitive moat seems very unfavorable with declining value creation. While leverage profile is substantial, the overall rating is a cautious B, indicating moderate investment appeal.
Strength & Efficiency Pillars
Northern Trust Corporation shows operational resilience with a favorable net margin of 12.15% and a solid gross margin of 56.54%. Its EBIT margin at 16.3% further confirms efficient core operations. ROE stands at a neutral 13.4%, while ROIC is 5.04%, trailing the WACC of 16.88%, indicating the company is currently destroying value rather than creating it. Despite moderate profitability, these margins reflect disciplined cost management in a challenging environment.
Weaknesses and Drawbacks
Northern Trust is in financial distress, evidenced by an Altman Z-Score of -0.30, placing it firmly in the Distress Zone with a heightened bankruptcy risk. The company’s leverage is concerning, with a debt-to-equity ratio of 1.27 and weak liquidity ratios—current and quick ratios both at 0.41—signaling potential short-term solvency issues. Valuation metrics are mixed: a reasonable P/E of 14.75 contrasts with a neutral P/B of 1.98, but the high interest expense coverage ratio of 0.38 flags stress in servicing debt.
Our Final Verdict about Northern Trust Corporation
Despite operational margins that might appear stable, Northern Trust’s severe solvency risk marked by its distress-level Z-Score makes the investment profile highly speculative. The company’s financial fragility overshadows moderate profitability and a bullish stock trend. This profile may be too risky for conservative capital, warranting cautious consideration until its balance sheet strengthens.
Disclaimer: This content is for informational purposes only and does not constitute financial, investment, or other professional advice. Investing in financial markets involves a significant risk of loss, and past performance is not indicative of future results.
Additional Resources
- Decoding Northern Trust Corp (NTRS): A Strategic SWOT Insight – GuruFocus (Feb 25, 2026)
- NORTHERN TRUST CORP SEC 10-K Report – TradingView (Feb 24, 2026)
- Is It Time To Reassess Northern Trust (NTRS) After Recent Share Price Pullback – Yahoo Finance (Feb 24, 2026)
- JPMorgan Chase & Co. Cuts Stock Position in Northern Trust Corporation $NTRS – MarketBeat (Feb 22, 2026)
- Northern Trust (NTRS): Buy, Sell, or Hold Post Q4 Earnings? – Finviz (Feb 22, 2026)
For more information about Northern Trust Corporation, please visit the official website: northerntrust.com