Home > Analyses > Industrials > Norfolk Southern Corporation
Norfolk Southern powers the U.S. economy by moving critical raw materials and finished goods across 19,300 miles of rail. Its leadership in freight rail transport spans agriculture, chemicals, metals, and automotive sectors. Renowned for operational efficiency and network scale, Norfolk Southern continually innovates to meet shifting logistics demands. As market dynamics evolve, I question whether its robust fundamentals still support the current valuation and growth outlook.

Table of contents
Business Model & Company Overview
Norfolk Southern Corporation, founded in 1980 and headquartered in Atlanta, GA, commands a dominant position in the U.S. railroads industry. It operates an extensive network of 19,300 route miles across 22 states and D.C., transporting a diverse array of raw materials, finished goods, and consumer products. The company’s ecosystem integrates agriculture, chemicals, metals, automotive, and intermodal freight, creating a cohesive transportation backbone vital to North America’s supply chain.
The company’s revenue engine balances freight rail services with intermodal and commuter rail operations, leveraging its strategic access to Atlantic and Gulf Coast ports. Norfolk Southern’s footprint spans key U.S. markets, facilitating efficient commodity flow across the Americas. Its economic moat rests on unmatched route density and critical infrastructure, positioning it as a cornerstone in shaping the future of U.S. freight transportation.
Financial Performance & Fundamental Metrics
I will analyze Norfolk Southern Corporation’s income statement, key financial ratios, and dividend payout policy to assess its core financial health and shareholder returns.
Income Statement
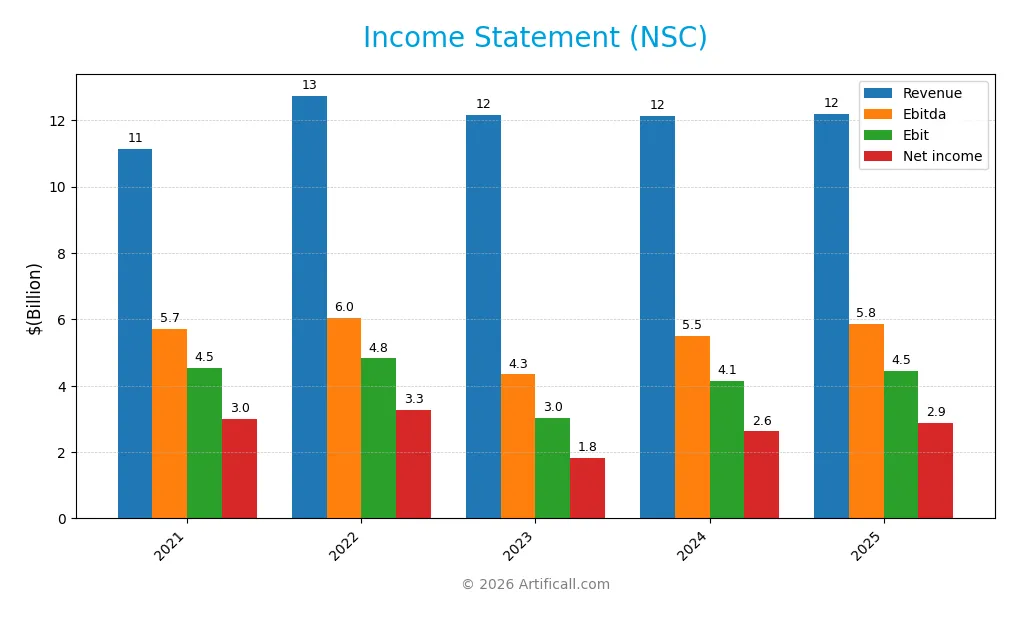
This table summarizes Norfolk Southern Corporation’s key income statement metrics over the last five fiscal years, highlighting revenue, profitability, and earnings per share trends.
| 2021 | 2022 | 2023 | 2024 | 2025 | |
|---|---|---|---|---|---|
| Revenue | 11.1B | 12.7B | 12.2B | 12.1B | 12.2B |
| Cost of Revenue | 6.8B | 8.0B | 9.3B | 8.4B | 7.0B |
| Operating Expenses | 0 | 0 | 0 | 1.2B | 1.2B |
| Gross Profit | 4.4B | 4.7B | 2.8B | 3.8B | 5.2B |
| EBITDA | 5.7B | 6.0B | 4.3B | 5.5B | 5.9B |
| EBIT | 4.5B | 4.8B | 3.0B | 4.1B | 4.5B |
| Interest Expense | 646M | 692M | 722M | 807M | 792M |
| Net Income | 3.0B | 3.3B | 1.8B | 2.6B | 2.9B |
| EPS | 12.16 | 13.92 | 8.04 | 11.58 | 12.75 |
| Filing Date | 2022-02-04 | 2023-02-03 | 2024-02-05 | 2025-02-10 | 2026-02-09 |
Income Statement Evolution
Norfolk Southern’s revenue showed modest growth of 0.47% in 2025, slowing compared to the overall 9.32% rise since 2021. Gross profit surged 37.3% year-over-year, reflecting improved cost control. Margins strengthened, with gross margin at 42.43% and net margin expanding by 9.06% in the latest year, signaling enhanced profitability despite revenue plateauing.
Is the Income Statement Favorable?
The 2025 income statement reveals strong fundamentals. EBITDA reached $5.85B, with an EBIT margin of 36.59%, outperforming many peers. Interest expense remains moderate at 6.5% of revenue, posing limited financial strain. Net income fell slightly over the full period but grew 10.2% in EPS last year. Overall, the income statement maintains a favorable profile with solid margin improvement and controlled expenses.
Financial Ratios
The following table summarizes key financial ratios for Norfolk Southern Corporation over recent fiscal years, providing insight into profitability, leverage, liquidity, and market valuation:
| Ratios | 2021 | 2022 | 2023 | 2024 | 2025 |
|---|---|---|---|---|---|
| Net Margin | 27.0% | 25.7% | 15.0% | 21.6% | 23.6% |
| ROE | 22.0% | 25.7% | 14.3% | 18.3% | 18.5% |
| ROIC | 9.2% | 10.1% | 5.7% | 7.3% | 7.5% |
| P/E | 24.5 | 17.7 | 29.4 | 20.2 | 22.6 |
| P/B | 5.4 | 4.5 | 4.2 | 3.7 | 4.2 |
| Current Ratio | 0.86 | 0.76 | 1.24 | 0.90 | 0.85 |
| Quick Ratio | 0.77 | 0.66 | 1.14 | 0.82 | 0.85 |
| D/E | 1.04 | 1.22 | 1.37 | 1.22 | 1.10 |
| Debt-to-Assets | 37.0% | 40.1% | 42.2% | 40.0% | 37.8% |
| Interest Coverage | 6.76 | 6.84 | 3.89 | 4.66 | 5.06 |
| Asset Turnover | 0.29 | 0.33 | 0.29 | 0.28 | 0.27 |
| Fixed Asset Turnover | 0.35 | 0.40 | 0.36 | 0.34 | 0.00 |
| Dividend Yield | 1.40% | 2.02% | 2.28% | 2.30% | 1.87% |
Evolution of Financial Ratios
Norfolk Southern’s Return on Equity (ROE) showed a generally positive trend, improving from 14.3% in 2023 to 18.5% in 2025. The Current Ratio declined from 1.24 in 2023 to 0.85 in 2025, indicating weakening short-term liquidity. Debt-to-Equity Ratio decreased from 1.37 in 2023 to 1.10 in 2025, suggesting modest deleveraging while profitability remained stable.
Are the Financial Ratios Favorable?
In 2025, profitability metrics like net margin (23.6%) and ROE (18.5%) are favorable, reflecting efficient capital use. Liquidity ratios, including the current ratio at 0.85, are unfavorable, raising caution on short-term obligations. Leverage remains moderately high with a debt-to-equity of 1.1, marked unfavorable. Market valuation ratios such as price-to-book at 4.17 are also unfavorable. Overall, the ratio profile is slightly unfavorable.
Shareholder Return Policy
Norfolk Southern Corporation maintains a dividend payout ratio near 42%, with dividends per share steadily increasing to 5.4 USD in 2025. The dividend yield stands at 1.87%, supported by free cash flow coverage, while share buybacks also contribute to shareholder returns.
This balanced approach aligns with sustainable value creation, as dividends remain covered by operating cash flow and capital expenditures. However, investors should monitor leverage levels and cash ratios to guard against distribution risks amid economic shifts.
Score analysis
The following radar chart presents Norfolk Southern Corporation’s key financial scores for a balanced overview:
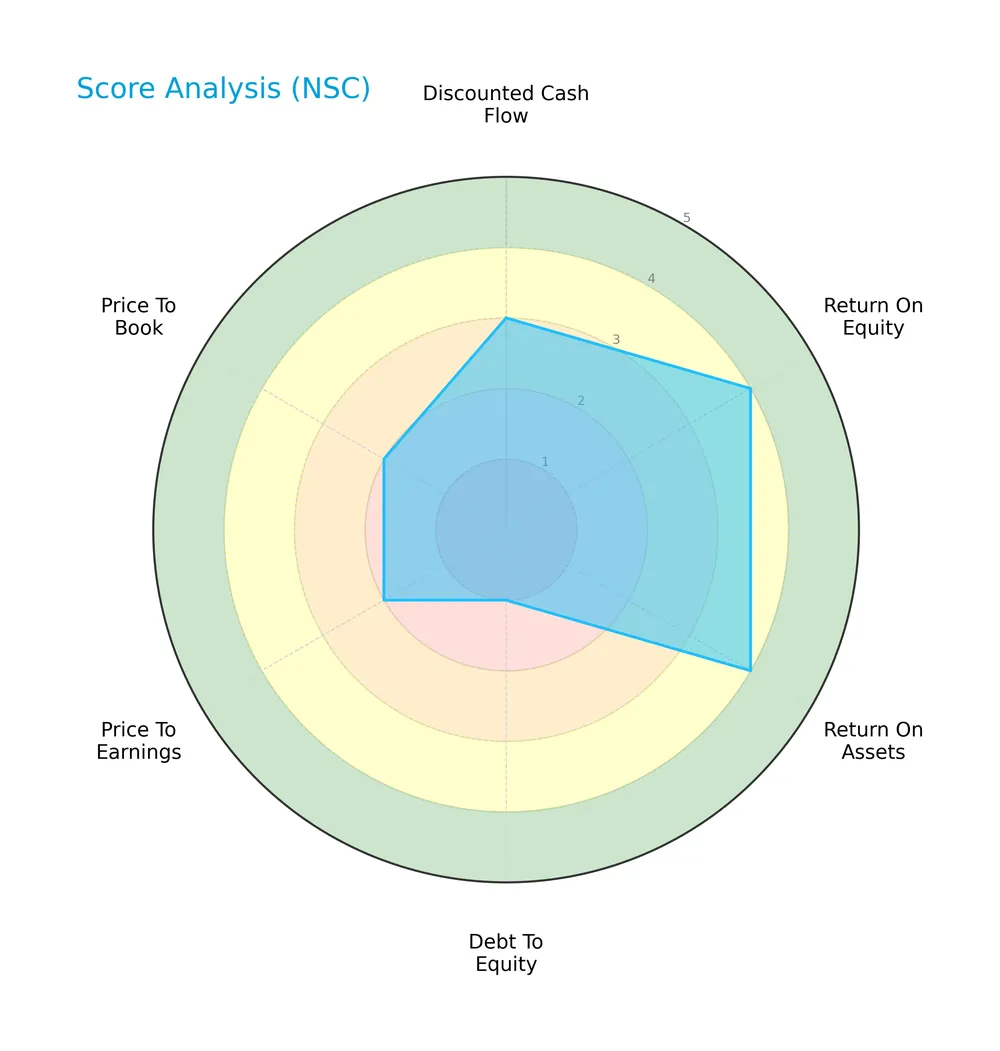
Norfolk Southern shows favorable returns on equity and assets, scoring 4 in both. However, its debt-to-equity score is very unfavorable at 1, dragging the overall score to a moderate 3. Valuation metrics (PE and PB) also score low, indicating potential market concerns.
Analysis of the company’s bankruptcy risk
Norfolk Southern’s Altman Z-Score places it in the grey zone, signaling a moderate risk of bankruptcy and financial caution:

Is the company in good financial health?
The Piotroski Score diagram highlights Norfolk Southern’s solid financial strength and operational efficiency:

With a score of 7, Norfolk Southern demonstrates strong financial health, reflecting effective profitability and balance sheet management despite some leverage concerns.
Competitive Landscape & Sector Positioning
This sector analysis examines Norfolk Southern Corporation’s strategic positioning, revenue streams, and key products. I will assess whether Norfolk Southern holds a competitive advantage over its main competitors.
Strategic Positioning
Norfolk Southern concentrates on rail transportation across merchandise, coal, and intermodal segments, with merchandise revenues leading at $7.68B in 2025. It operates roughly 19,300 route miles in 22 states plus D.C., focusing geographically on the U.S. East Coast and Midwest regions.
Revenue by Segment
This pie chart illustrates Norfolk Southern Corporation’s revenue distribution by segment for the fiscal year 2025, highlighting merchandise, coal, and intermodal contributions.
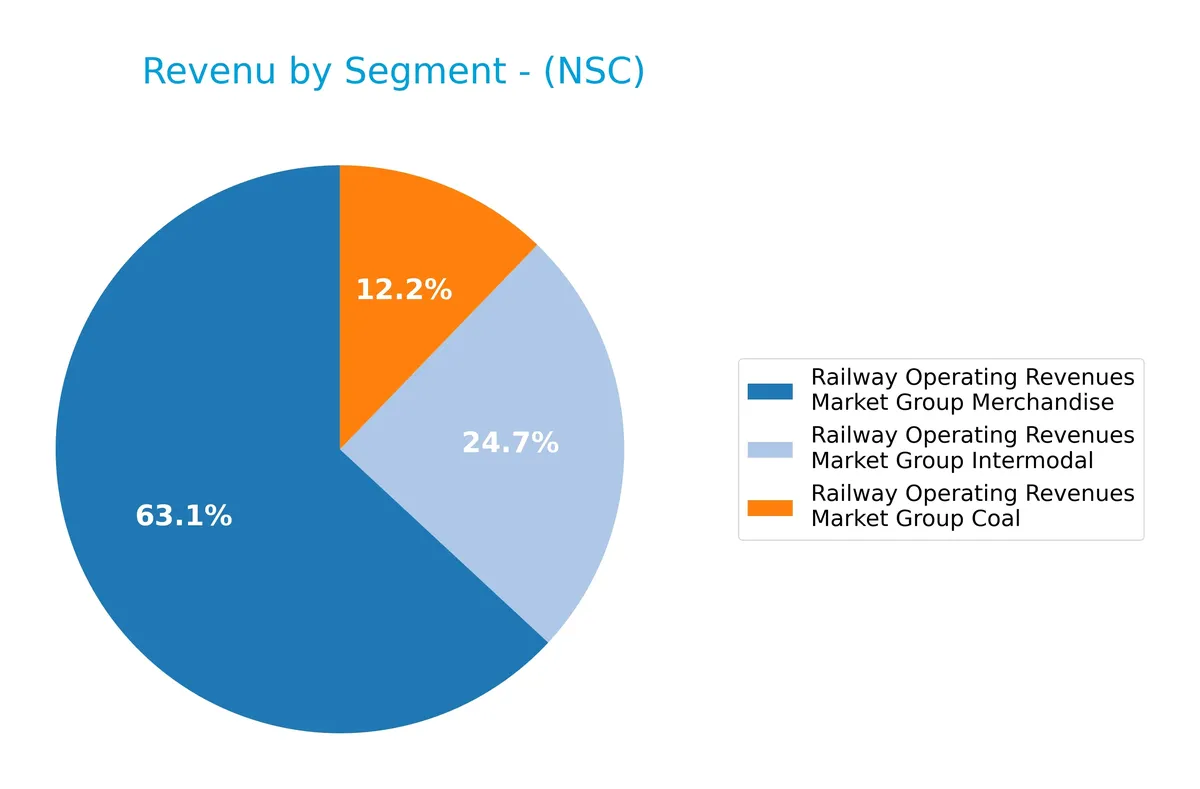
Merchandise dominates with $7.7B, reflecting steady growth since 2021. Intermodal holds $3B but shows a slight decline from prior years, signaling potential market shifts. Coal revenue at $1.5B decreased, consistent with long-term sector headwinds. The 2025 data reveals a concentration in merchandise, with intermodal and coal under pressure, emphasizing Norfolk Southern’s reliance on its core freight operations.
Key Products & Brands
Norfolk Southern Corporation’s key products and services are detailed in the table below:
| Product | Description |
|---|---|
| Merchandise | Rail transportation of agriculture, forest, consumer products, chemicals, metals, and automotive. |
| Coal | Rail transportation of coal for energy and industrial use. |
| Intermodal | Rail transportation combining truck and rail for containerized freight shipments. |
Norfolk Southern generates most revenue from merchandise transport, covering diverse sectors from agriculture to automotive. Coal and intermodal services contribute significant but smaller shares, reflecting varied industrial demand.
Main Competitors
There are 4 competitors in the Railroads industry; below is a table of the top 10 leaders by market capitalization:
| Competitor | Market Cap. |
|---|---|
| Union Pacific Corporation | 138B |
| CSX Corporation | 68B |
| Norfolk Southern Corporation | 65B |
| Westinghouse Air Brake Technologies Corporation | 37B |
Norfolk Southern Corporation ranks 3rd among its competitors. Its market cap stands at 54.39% of the leader, Union Pacific Corporation. The company is below the average market cap of the top 10 but above the median for the sector. It maintains a 9.72% gap to the next competitor above, CSX Corporation.
Comparisons with competitors
Check out how we compare the company to its competitors:
Does NSC have a competitive advantage?
Norfolk Southern Corporation currently lacks a competitive advantage, as its ROIC falls below WACC by 1.26%, indicating value destruction. The company’s declining ROIC trend further signals weakening profitability over 2021-2025.
Looking ahead, NSC’s extensive network of 19,300 route miles and diverse freight mix position it to explore opportunities in intermodal transport and Atlantic/Gulf Coast port markets. New product or market developments could influence its competitive standing.
SWOT Analysis
This SWOT analysis highlights Norfolk Southern Corporation’s key internal and external factors shaping its strategic outlook.
Strengths
- strong net margin of 23.6%
- solid ROE at 18.5%
- favorable income growth in profits and EPS
Weaknesses
- declining ROIC below WACC indicates value destruction
- low current ratio at 0.85 signals liquidity risk
- high debt-to-equity ratio of 1.1 raises financial leverage concerns
Opportunities
- expanding intermodal network and overseas freight potential
- rising demand for sustainable transport solutions
- technological upgrades to improve asset turnover
Threats
- intense competition in rail and intermodal sectors
- regulatory risks in environmental policies
- economic slowdown impacting freight volumes
Norfolk Southern combines strong profitability with operational challenges. The company must address liquidity and capital efficiency while leveraging growth in intermodal transport. Strategic focus on reducing leverage and improving asset utilization will be critical to sustain its competitive moat.
Stock Price Action Analysis
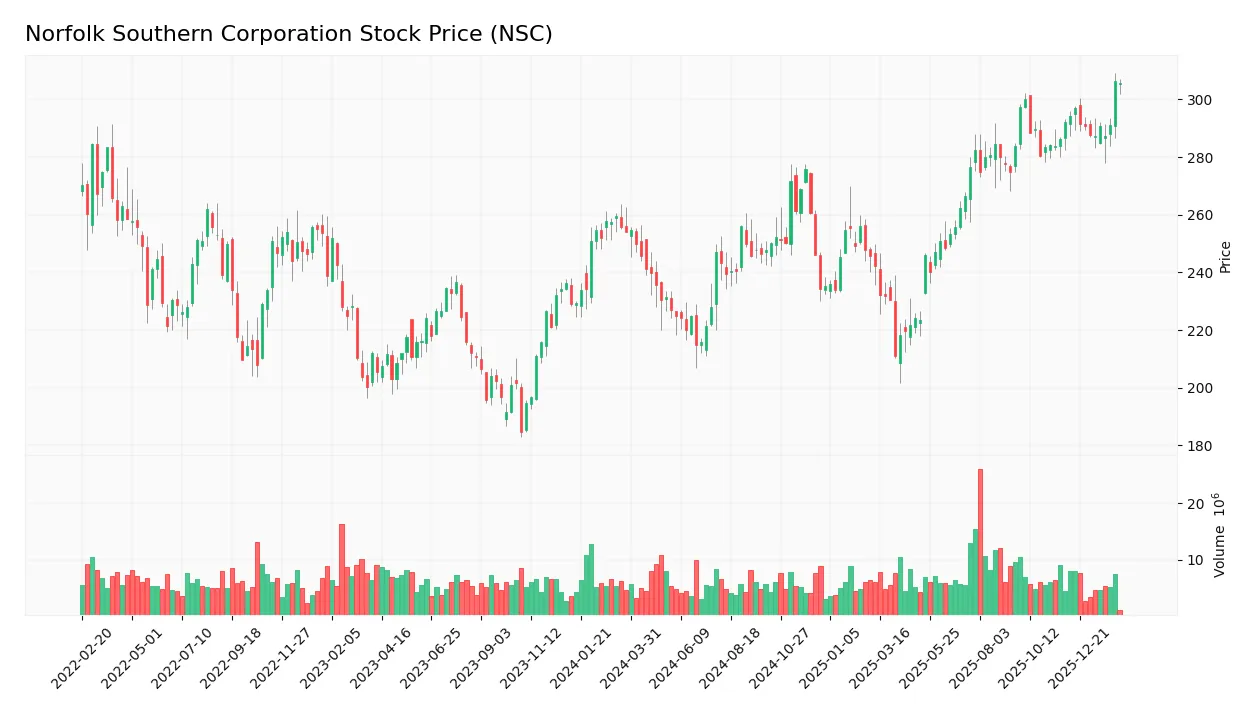
The weekly stock chart for Norfolk Southern Corporation (NSC) displays price movements and volume trends over the past 12 months:
Trend Analysis
Over the past year, NSC’s stock rose by 20.31%, confirming a bullish trend with accelerating momentum. The price ranged from a low of 210.93 to a high of 306.48, showing strong upward movement despite a high volatility level of 24.62%. Recent months show a moderate 4.67% gain with lower volatility, indicating steady trend continuation.
Volume Analysis
Trading volumes have increased, totaling 778M shares with buyers accounting for 56%. In the recent period, buyer dominance strengthened to 60%, signaling buyer-driven activity. This rising volume suggests growing investor interest and confidence in NSC’s stock, reinforcing the positive price trend.
Target Prices
Analysts set a target consensus that reflects cautious optimism for Norfolk Southern Corporation (NSC).
| Target Low | Target High | Consensus |
|---|---|---|
| 288 | 342 | 312.43 |
The target range between 288 and 342 indicates moderate upside potential. The consensus at 312.43 suggests analysts expect steady growth, aligned with sector trends.

Don’t Let Luck Decide Your Entry Point
Optimize your entry points with our advanced ProRealTime indicators. You’ll get efficient buy signals with precise price targets for maximum performance. Start outperforming now!
Analyst & Consumer Opinions
This section examines Norfolk Southern Corporation’s analyst ratings and consumer feedback to provide a balanced performance overview.
Stock Grades
Here are the recent analyst grades for Norfolk Southern Corporation from leading financial institutions:
| Grading Company | Action | New Grade | Date |
|---|---|---|---|
| Baird | Maintain | Neutral | 2026-02-02 |
| Citigroup | Maintain | Neutral | 2026-01-30 |
| JP Morgan | Maintain | Neutral | 2026-01-30 |
| RBC Capital | Maintain | Sector Perform | 2026-01-30 |
| Barclays | Maintain | Overweight | 2026-01-30 |
| JP Morgan | Maintain | Neutral | 2026-01-12 |
| Citigroup | Maintain | Neutral | 2026-01-08 |
| Barclays | Maintain | Overweight | 2025-12-16 |
| Deutsche Bank | Downgrade | Hold | 2025-12-11 |
| RBC Capital | Maintain | Sector Perform | 2025-10-24 |
The grades show a stable pattern with most firms maintaining neutral or sector perform ratings. Barclays stands out with consistent overweight ratings, while Deutsche Bank downgraded from buy to hold in late 2025. The consensus remains cautious, leaning toward holding the stock.
Consumer Opinions
Norfolk Southern Corporation evokes strong opinions from its customers, reflecting its critical role in freight logistics.
| Positive Reviews | Negative Reviews |
|---|---|
| Reliable delivery schedules keep supply chains smooth. | Occasional delays during peak seasons frustrate clients. |
| Efficient communication from service representatives. | Customer service response times can be slow. |
| Strong network coverage across key industrial regions. | Pricing sometimes feels higher than competitors. |
Overall, consumers praise Norfolk Southern’s reliability and extensive network. However, recurring complaints about service delays and customer support suggest areas needing improvement.
Risk Analysis
Below is a summary table of Norfolk Southern Corporation’s key risks, their likelihood, and potential impact on performance:
| Category | Description | Probability | Impact |
|---|---|---|---|
| Liquidity Risk | Current ratio at 0.85 signals tight short-term liquidity. | High | Moderate |
| Leverage Risk | Debt-to-equity ratio above 1.1 raises financial leverage concerns. | Medium | High |
| Valuation Risk | Price-to-book of 4.17 suggests potential overvaluation. | Medium | Moderate |
| Operational Risk | Asset turnover of 0.27 indicates underutilization of assets. | Medium | Moderate |
| Market Volatility | Beta of 1.32 exposes stock to above-market price swings. | High | Moderate |
Liquidity constraints and high financial leverage stand out as the most pressing risks. The low current ratio may restrict operational flexibility amid economic downturns. Meanwhile, debt levels above industry norms increase vulnerability to interest rate hikes. Operational inefficiencies also temper upside potential despite strong profitability metrics.
Should You Buy Norfolk Southern Corporation?
Norfolk Southern Corporation appears to have robust profitability and operational efficiency, yet its competitive moat seems very unfavorable due to declining ROIC versus WACC. Despite a manageable leverage profile, the overall rating suggests a moderate investment profile with notable risks.
Strength & Efficiency Pillars
Norfolk Southern Corporation posts solid profitability with a net margin of 23.59% and a return on equity (ROE) of 18.48%. The company’s EBIT margin of 36.59% underscores operational efficiency. However, its return on invested capital (ROIC) stands at 7.47%, slightly below its weighted average cost of capital (WACC) at 8.73%, indicating value erosion rather than creation. Despite this, the firm’s strong Piotroski score of 7 suggests robust financial fundamentals amid moderate growth trends.
Weaknesses and Drawbacks
The company faces valuation and leverage concerns. Its price-to-book ratio of 4.17 signals an expensive valuation relative to book value, while a debt-to-equity ratio of 1.1 raises red flags on financial leverage. Additionally, a current ratio of 0.85 points to liquidity constraints, potentially limiting short-term flexibility. These factors combined highlight risks in capital structure and market pricing that investors must weigh carefully despite the solid profitability.
Our Final Verdict about Norfolk Southern Corporation
Norfolk Southern’s profile suggests moderate operational strength tempered by financial structure risks. Its Altman Z-Score of 2.50 places it in the grey zone, indicating moderate bankruptcy risk but not distress. The bullish long-term stock trend and buyer dominance in recent periods might suggest potential upside. However, valuation and leverage metrics may warrant a cautious, wait-and-see approach before committing fresh capital.
Disclaimer: This content is for informational purposes only and does not constitute financial, investment, or other professional advice. Investing in financial markets involves a significant risk of loss, and past performance is not indicative of future results.
Additional Resources
- NORFOLK SOUTHERN CORP SEC 10-K Report – TradingView (Feb 09, 2026)
- Norfolk Southern Corp (NSC) Q4 2025 Earnings Call Highlights: Navigating Challenges with … – Yahoo Finance (Jan 29, 2026)
- Norfolk Southern rail fuels more than $7.7B in industrial development activity in 2025 – PR Newswire (Feb 02, 2026)
- 5 Insightful Analyst Questions From Norfolk Southern’s Q4 Earnings Call – Finviz (Feb 05, 2026)
- Union Pacific and Norfolk Southern to Create America’s First Transcontinental Railroad – Union Pacific (Jul 29, 2025)
For more information about Norfolk Southern Corporation, please visit the official website: norfolksouthern.com