Home > Analyses > Industrials > Nordson Corporation
Nordson Corporation revolutionizes how industries control and apply adhesives, coatings, and fluids, shaping the manufacturing processes behind countless everyday products. As a recognized leader in industrial machinery, Nordson’s precision dispensing and coating systems serve diverse sectors, from packaging to semiconductors, earning a reputation for innovation and quality. As the company navigates evolving market demands and technological advances, investors must ask: do Nordson’s fundamentals and growth prospects still justify its premium valuation?
Table of contents
Business Model & Company Overview
Nordson Corporation, founded in 1935 and headquartered in Westlake, Ohio, stands as a dominant player in the industrial machinery sector. It engineers and manufactures an integrated ecosystem of precision dispensing and coating systems that serve diverse markets, from adhesives and sealants to biomaterials and specialty coatings. Its two segments, Industrial Precision Solutions and Advanced Technology Solutions, collectively empower industries with innovative fluid application and surface treatment technologies, underpinning its core mission to enhance manufacturing efficiency worldwide.
Nordson’s revenue engine balances hardware sales with recurring service and consumable products across global markets in the Americas, Europe, and Asia. Its offering includes automated dispensing systems, curing equipment, and inspection technologies, blending physical components with software-driven precision. This strategic global footprint and broad product portfolio create a robust economic moat, positioning Nordson as a key influencer shaping the future of fluid dispensing and surface treatment industries.
Financial Performance & Fundamental Metrics
In this section, I analyze Nordson Corporation’s income statement, key financial ratios, and dividend payout policy to assess its overall financial health and investment appeal.
Income Statement
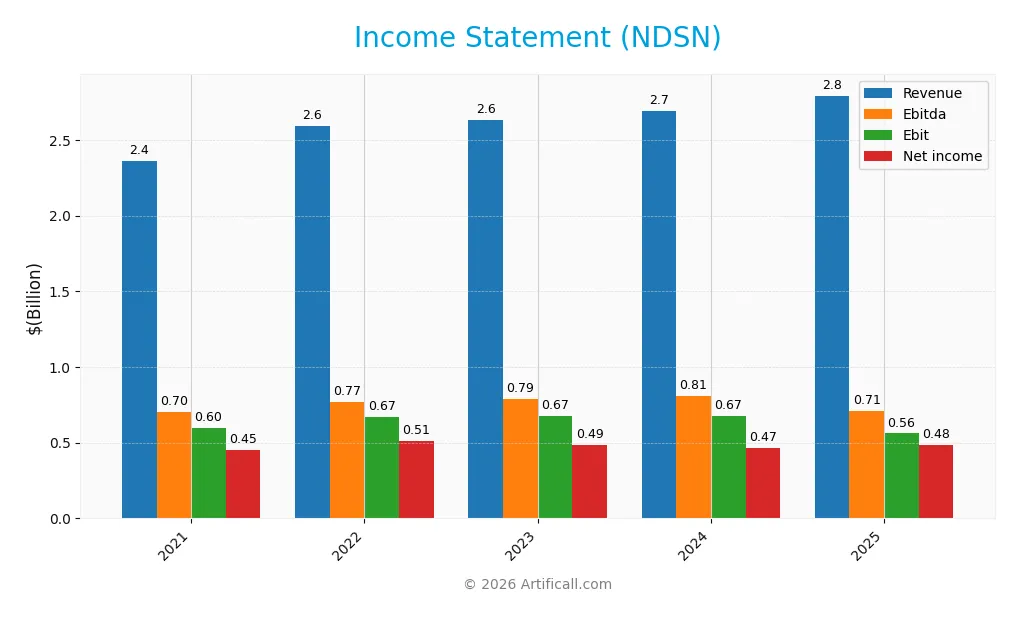
Below is Nordson Corporation’s income statement overview for fiscal years 2021 to 2025, showing key financial performance indicators in USD.
| 2021 | 2022 | 2023 | 2024 | 2025 | |
|---|---|---|---|---|---|
| Revenue | 2.36B | 2.59B | 2.63B | 2.69B | 2.79B |
| Cost of Revenue | 1.04B | 1.16B | 1.20B | 1.20B | 1.25B |
| Operating Expenses | 709M | 724M | 753M | 812M | 828M |
| Gross Profit | 1.32B | 1.43B | 1.43B | 1.49B | 1.54B |
| EBITDA | 704M | 772M | 787M | 811M | 712M |
| EBIT | 600M | 672M | 675M | 674M | 561M |
| Interest Expense | 25M | 22M | 60M | 89M | 101M |
| Net Income | 454M | 513M | 487M | 467M | 484M |
| EPS | 7.82 | 8.90 | 8.54 | 8.17 | 8.56 |
| Filing Date | 2021-12-17 | 2022-12-19 | 2023-12-20 | 2024-12-18 | 2025-12-17 |
Income Statement Evolution
From 2021 to 2025, Nordson Corporation experienced a steady revenue increase of 18.18%, with a 3.78% growth in the last year, indicating moderate acceleration. Net income grew by 6.63% over the period but showed a marginal decline in margin, with net margin decreasing by 9.78%. Gross and EBIT margins remained favorable at 55.16% and 20.1%, respectively, despite a 16.79% EBIT decline in the most recent year.
Is the Income Statement Favorable?
The 2025 income statement reveals generally favorable fundamentals for Nordson, with a net margin of 17.35% and an interest expense ratio of 3.62%, both positive indicators. Although EBIT and net margin growth were slightly unfavorable last year, EPS increased by 4.93%, reflecting efficient earnings per share management. Overall, the company’s income statement shows solid profitability and controlled expenses, supporting a favorable evaluation.
Financial Ratios
The table below presents key financial ratios for Nordson Corporation (NDSN) over the last five fiscal years, illustrating profitability, liquidity, leverage, valuation, and efficiency metrics:
| Ratios | 2021 | 2022 | 2023 | 2024 | 2025 |
|---|---|---|---|---|---|
| Net Margin | 19% | 20% | 19% | 17% | 17% |
| ROE | 21% | 22% | 19% | 16% | 16% |
| ROIC | 14% | 16% | 11% | 10% | 10% |
| P/E | 33.1 | 25.3 | 24.9 | 30.6 | 27.1 |
| P/B | 7.0 | 5.7 | 4.7 | 4.9 | 4.3 |
| Current Ratio | 2.62 | 1.36 | 2.11 | 2.41 | 1.64 |
| Quick Ratio | 1.88 | 0.90 | 1.33 | 1.51 | 1.05 |
| D/E | 0.44 | 0.38 | 0.72 | 0.79 | 0.69 |
| Debt-to-Assets | 25% | 23% | 35% | 39% | 35% |
| Interest Coverage | 24.1 | 31.3 | 11.3 | 7.6 | 7.0 |
| Asset Turnover | 0.62 | 0.68 | 0.50 | 0.45 | 0.47 |
| Fixed Asset Turnover | 6.64 | 7.33 | 5.27 | 4.21 | 4.70 |
| Dividend Yield | 0.65% | 0.97% | 1.24% | 1.13% | 1.36% |
Evolution of Financial Ratios
Nordson Corporation’s Return on Equity (ROE) showed a slight decrease from 22.36% in 2022 to 15.92% in 2025, indicating a moderation in profitability. The Current Ratio declined from 2.41 in 2024 to 1.64 in 2025, suggesting reduced liquidity. The Debt-to-Equity Ratio increased from 0.38 in 2022 to 0.69 in 2025, reflecting a higher leverage position over the period.
Are the Financial Ratios Favorable?
In 2025, profitability ratios like net margin (17.35%), ROE (15.92%), and ROIC (10.49%) were favorable, indicating solid earnings performance. Liquidity ratios, including Current Ratio (1.64) and Quick Ratio (1.05), were also favorable, supporting short-term financial stability. However, valuation ratios like P/E (27.1) and Price-to-Book (4.31) were unfavorable, suggesting potential overvaluation. Leverage ratios remained neutral, and overall, the financial ratios present a slightly favorable profile.
Shareholder Return Policy
Nordson Corporation maintains a consistent dividend payout ratio around 31-37%, with dividends per share rising from $1.68 in 2021 to $3.16 in 2025, supporting a stable annual yield near 1.2%. The dividend is well covered by free cash flow, indicating prudent capital allocation.
The company does not report share buyback activity, focusing on dividend payments supported by solid profitability and cash flow. This policy suggests a balanced approach aimed at sustainable long-term shareholder value without excessive distribution risks.
Score analysis
The radar chart below presents an overview of Nordson Corporation’s key financial scores for investor assessment:
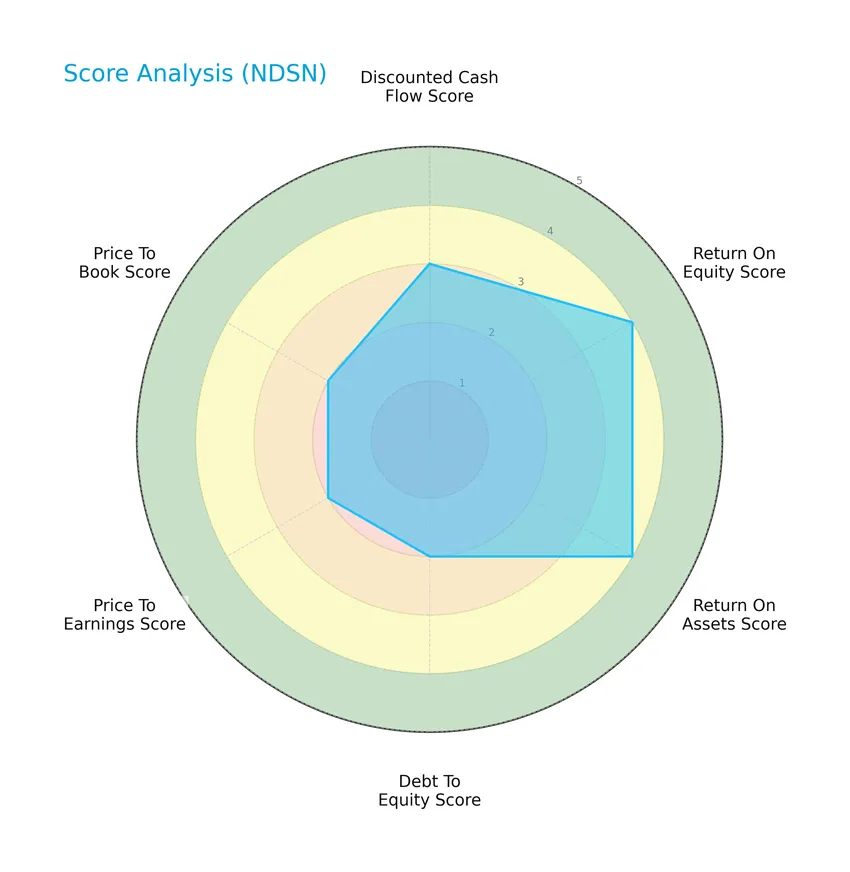
Nordson Corporation shows moderate strength in discounted cash flow (3) and moderate leverage with a debt-to-equity score of 2. Profitability metrics such as return on equity (4) and return on assets (4) are favorable. Valuation ratios price-to-earnings (2) and price-to-book (2) are moderate, reflecting balanced market pricing.
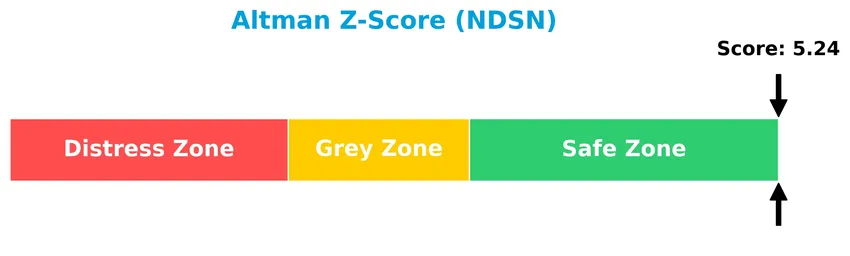
Analysis of the company’s bankruptcy risk
Nordson Corporation’s Altman Z-Score places it securely in the safe zone, indicating low bankruptcy risk and solid financial stability:
Is the company in good financial health?
The Piotroski Score diagram below illustrates Nordson Corporation’s financial strength based on nine accounting criteria:
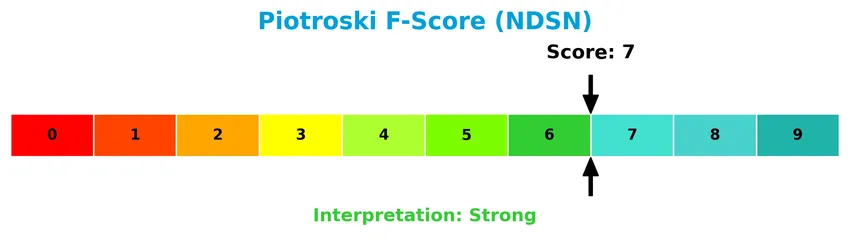
With a Piotroski Score of 7, Nordson demonstrates strong financial health, indicating good profitability, efficient operations, and sound financial structure relative to peers.
Competitive Landscape & Sector Positioning
This sector analysis will explore Nordson Corporation’s strategic positioning, revenue by segment, key products, main competitors, and competitive advantages. I will evaluate whether Nordson holds a competitive edge relative to its industry peers.
Strategic Positioning
Nordson Corporation maintains a diversified product portfolio across Industrial Precision Solutions, Medical and Fluid Solutions, and Advanced Technology Systems, generating over $2.7B in 2024 revenue. Geographically, it balances exposure with significant sales in Americas ex-US ($1.18B), Asia Pacific ex-Japan ($785M), and Europe ($726M).
Revenue by Segment
This pie chart displays Nordson Corporation’s revenue distribution across its main business segments for the fiscal year 2024.
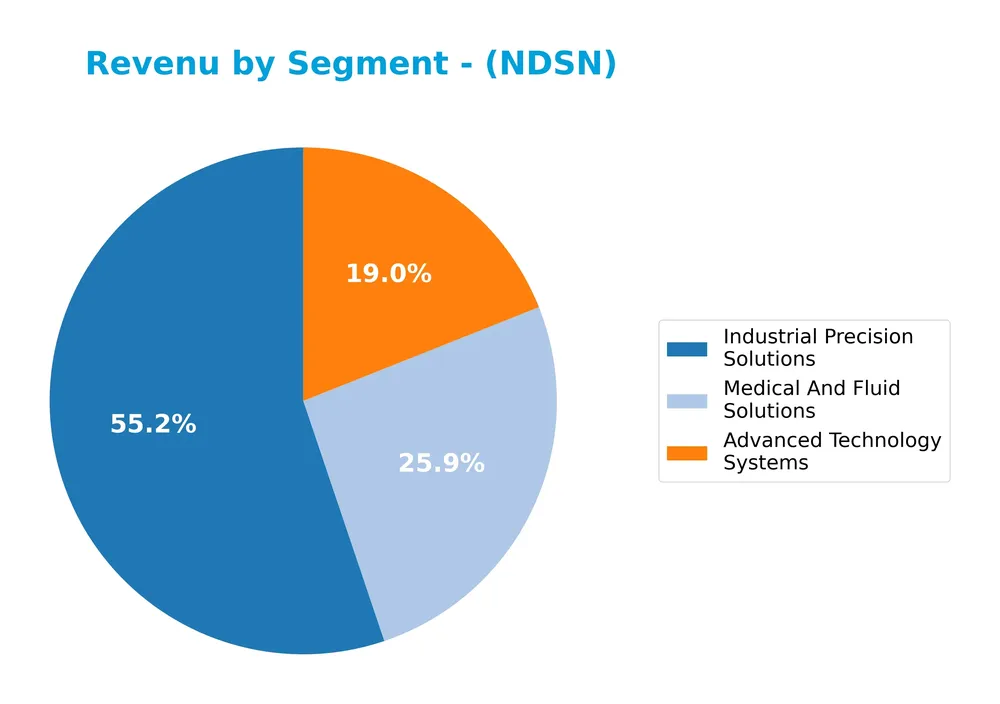
In 2024, Industrial Precision Solutions led with $1.48B, followed by Medical And Fluid Solutions at $695M and Advanced Technology Systems at $510M. The data shows a steady rise in Industrial Precision Solutions over recent years, highlighting its growing role. Meanwhile, Advanced Technology Systems experienced a slight decline compared to 2023, signaling potential shifts in segment dynamics and the importance of monitoring concentration risks going forward.
Key Products & Brands
The following table outlines Nordson Corporation’s key products and brands with their descriptions:
| Product | Description |
|---|---|
| Industrial Precision Solutions (IPS) | Dispensing, coating, and laminating systems for adhesives, lotions, liquids, and fibers; automated adhesive dispensing; components for thermoplastic melt stream; product assembly systems for paper, plastic, metal, and wood products; coating and curing systems for containers; powder and liquid paint application systems; ultraviolet curing equipment. |
| Advanced Technology Solutions (ATS) | Automated dispensing systems for attachment, protection, and coating of fluids; gas plasma treatment systems; precision manual and semi-automated dispensers; minimally invasive interventional delivery devices; plastic molded syringes, cartridges, tips, tubing, balloons, catheters; bond testing and automated inspection systems for semiconductors and printed circuit boards. |
| Medical and Fluid Solutions | Specialized medical devices and fluid handling components, including minimally invasive delivery devices and fluid connection products. |
Nordson Corporation’s product portfolio spans precision dispensing and coating systems across industrial and medical applications, supported by advanced technologies for fluid control and surface treatment.
Main Competitors
There are 24 competitors in the Industrials – Industrial Machinery sector, with the table below showing the top 10 leaders by market capitalization:
| Competitor | Market Cap. |
|---|---|
| Eaton Corporation plc | 127B |
| Parker-Hannifin Corporation | 114B |
| Howmet Aerospace Inc. | 85.2B |
| Emerson Electric Co. | 76.3B |
| Illinois Tool Works Inc. | 73B |
| Cummins Inc. | 71.9B |
| AMETEK, Inc. | 48.3B |
| Roper Technologies, Inc. | 46.8B |
| Rockwell Automation, Inc. | 44.8B |
| Symbotic Inc. | 35.9B |
Nordson Corporation ranks 17th among 24 competitors, with a market capitalization about 12% that of the sector leader, Eaton Corporation plc. The company is positioned below both the average market cap of the top 10 competitors (72.4B) and the median market cap of the sector (32.4B). It maintains a 10.76% market cap gap with its nearest competitor above, indicating a moderate distance in scale within this competitive landscape.
Comparisons with competitors
Check out how we compare the company to its competitors:
Does NDSN have a competitive advantage?
Nordson Corporation presents a slight competitive advantage, evidenced by its ROIC exceeding WACC by 2.39%, indicating value creation despite a declining ROIC trend. The company maintains favorable margins with a 55.16% gross margin and a 20.1% EBIT margin, supporting efficient capital use.
Looking ahead, Nordson’s operations in Industrial Precision Solutions and Advanced Technology Solutions offer opportunities to expand in adhesive dispensing and coating systems globally. Continued innovation and geographic diversification, especially in the Americas and Asia Pacific, are key for future growth potential.
SWOT Analysis
This SWOT analysis highlights Nordson Corporation’s key internal strengths and weaknesses alongside external opportunities and threats to guide informed investment decisions.
Strengths
- strong gross margin at 55.16%
- solid net margin of 17.35%
- diversified industrial product portfolio
Weaknesses
- declining EBIT growth (-16.79%)
- relatively high P/E ratio (27.1)
- modest asset turnover (0.47)
Opportunities
- expanding demand in Asia Pacific and Europe
- growing automation in manufacturing
- innovation in precision dispensing technologies
Threats
- global supply chain disruptions
- intense competition in industrial machinery
- macroeconomic uncertainties impacting capex budgets
Overall, Nordson demonstrates robust profitability and a diversified product base, but slowing earnings growth and valuation warrant caution. Strategic focus on innovation and geographic expansion could drive future growth while managing operational risks remains critical.
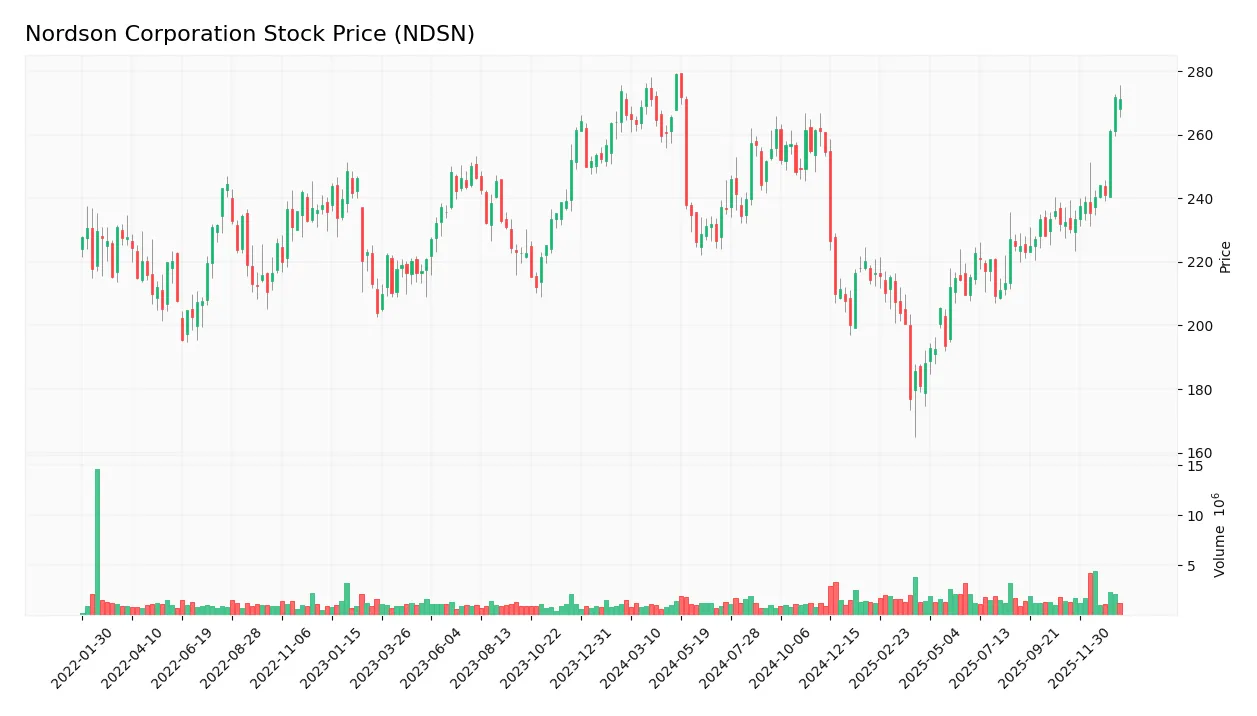
Stock Price Action Analysis
The weekly stock chart below illustrates Nordson Corporation’s price movements over the last 100 weeks, highlighting key fluctuations and trend developments:
Trend Analysis
Over the past 12 months, Nordson Corporation’s stock price increased by 1.95%, indicating a bullish trend by a narrow margin. The price range spanned from a low of 176.73 to a high of 278.89, with an acceleration in upward momentum and a standard deviation of 23.53, reflecting moderate volatility.
Volume Analysis
Trading volume over the last three months shows a clear buyer dominance, with buyers accounting for 67.2% of activity. Volume has been increasing, signaling growing market participation and positive investor sentiment toward the stock. Total volume reached approximately 17.2M shares, supporting the recent upward price momentum.
Target Prices
The consensus target prices for Nordson Corporation indicate a positive outlook among analysts.
| Target High | Target Low | Consensus |
|---|---|---|
| 295 | 240 | 274.17 |
Analysts expect Nordson’s stock price to trade between 240 and 295, with a consensus target around 274, reflecting moderate growth potential.

Don’t Let Luck Decide Your Entry Point
Optimize your entry points with our advanced ProRealTime indicators. You’ll get efficient buy signals with precise price targets for maximum performance. Start outperforming now!
Analyst & Consumer Opinions
This section examines the latest analyst ratings and consumer feedback related to Nordson Corporation (NDSN).
Stock Grades
Here is a summary of Nordson Corporation’s recent stock grades from established financial analysts:
| Grading Company | Action | New Grade | Date |
|---|---|---|---|
| DA Davidson | Maintain | Buy | 2025-12-12 |
| Baird | Maintain | Neutral | 2025-12-12 |
| Keybanc | Maintain | Overweight | 2025-12-11 |
| DA Davidson | Maintain | Buy | 2025-12-11 |
| Oppenheimer | Maintain | Outperform | 2025-08-25 |
| Baird | Maintain | Neutral | 2025-08-22 |
| Keybanc | Maintain | Overweight | 2025-07-15 |
| Oppenheimer | Upgrade | Outperform | 2025-05-30 |
| Baird | Maintain | Neutral | 2025-05-30 |
| Keybanc | Maintain | Overweight | 2025-04-08 |
The consensus ratings indicate a generally positive outlook with multiple firms maintaining buy or outperform grades, while Baird consistently holds a neutral stance. Overall, the trend suggests steady confidence in the stock without recent downgrades.
Consumer Opinions
Nordson Corporation enjoys a mix of praise and criticism from its consumer base, reflecting both its innovation and areas needing improvement.
| Positive Reviews | Negative Reviews |
|---|---|
| High-quality products with reliable performance | Customer service can be slow to respond |
| Innovative solutions that enhance productivity | Pricing is sometimes higher than competitors |
| Strong technical support and knowledgeable staff | Occasional delays in product delivery |
| Durable equipment that lasts over time | Limited availability of certain replacement parts |
Overall, consumers appreciate Nordson’s durable, innovative products and strong technical support. However, some express concerns about customer service responsiveness and product pricing, indicating areas for potential improvement.
Risk Analysis
Below is a table summarizing key risks associated with Nordson Corporation, considering their likelihood and potential impact on investment value:
| Category | Description | Probability | Impact |
|---|---|---|---|
| Market Valuation | Elevated P/E (27.1) and P/B (4.31) ratios indicate potential overvaluation risk. | Medium | High |
| Competitive Pressure | Industrial machinery sector faces intense competition, possibly affecting future margins. | Medium | Medium |
| Economic Cyclicality | Sensitivity to industrial demand fluctuations could impact revenues and profitability. | Medium | Medium |
| Operational Risks | Dependence on advanced technology and manufacturing precision may lead to production delays. | Low | Medium |
| Financial Leverage | Moderate debt-to-equity ratio (0.69) requires monitoring to avoid solvency issues. | Low | Medium |
The most significant risks for Nordson are overvaluation and cyclical demand shifts, as its valuation metrics are stretched despite solid profitability. The company’s Altman Z-Score of 5.24 confirms strong financial health, reducing bankruptcy risk. Nonetheless, investors should remain cautious of market corrections and sector downturns.
Should You Buy Nordson Corporation?
Nordson Corporation appears to be a moderately profitable company with a slightly favorable moat characterized by value creation but declining returns on invested capital. Despite a manageable leverage profile and strong financial health signals, its overall rating could be seen as a cautious B, suggesting balanced risk and opportunity.
Strength & Efficiency Pillars
Nordson Corporation exhibits robust profitability metrics, with a net margin of 17.35% and a return on equity (ROE) of 15.92%, reflecting efficient capital use. Its return on invested capital (ROIC) stands at 10.49%, notably above the weighted average cost of capital (WACC) of 8.1%, confirming that the company is a clear value creator. Financial health is solid, supported by a strong Altman Z-score of 5.24 indicating minimal bankruptcy risk, and a Piotroski score of 7, underscoring operational strength and financial discipline.
Weaknesses and Drawbacks
Despite its strengths, Nordson faces valuation challenges, with a price-to-earnings (P/E) ratio of 27.1 and a price-to-book (P/B) ratio of 4.31, both flagged as unfavorable and suggesting a premium market valuation that may limit upside. Leverage metrics present moderate risk; the debt-to-equity ratio of 0.69 is neutral but calls for caution. While liquidity ratios are favorable, the company’s asset turnover ratio of 0.47 is weak, potentially signaling inefficiencies in asset utilization that could pressure returns under market stress.
Our Verdict about Nordson Corporation
Nordson Corporation’s long-term fundamental profile is favorable, supported by strong profitability and financial stability. The bullish overall stock trend combined with recent buyer dominance (67.2%) suggests positive momentum may continue. This profile could appeal to investors seeking long-term exposure, though the elevated valuation metrics might encourage a cautious stance, implying that timing entry points carefully could be prudent.
Disclaimer: This content is for informational purposes only and does not constitute financial, investment, or other professional advice. Investing in financial markets involves a significant risk of loss, and past performance is not indicative of future results.
Additional Resources
- Vest Financial LLC Cuts Holdings in Nordson Corporation $NDSN – MarketBeat (Jan 21, 2026)
- Will Earnings Momentum and Medical Automation Push Nordson’s (NDSN) Strategy Into a New Phase? – Yahoo Finance (Jan 21, 2026)
- Assessing Nordson (NDSN) Valuation After Recent Short Term Share Price Weakness – simplywall.st (Jan 21, 2026)
- NORDSON CORP ($NDSN) CEO 2025 Pay Revealed – Quiver Quantitative (Jan 16, 2026)
- Nordson EFD Takes Assembly Automation to Center Stage at MD&M West, February 3 – 5, 2026 (2026-01-20) – Seeking Alpha (Jan 20, 2026)
For more information about Nordson Corporation, please visit the official website: nordson.com