Home > Analyses > Technology > Nokia Oyj
Nokia shapes the global communication landscape by powering networks that connect billions daily. As a stalwart in mobile and fixed network solutions, it leads with cutting-edge 5G technology, cloud services, and optical transport innovations. Renowned for steady innovation and industry influence, Nokia balances heritage with modern demand. The key question: does its current financial strength and strategic positioning justify its market valuation and growth prospects in a fiercely competitive sector?
Table of contents
Business Model & Company Overview
Nokia Oyj, founded in 1865 and headquartered in Espoo, Finland, stands as a dominant player in the Communication Equipment industry. Its core mission unites mobile, fixed, and cloud network solutions into a cohesive ecosystem spanning 2G to 5G technologies, optical networks, and enterprise software. This integrated approach underpins Nokia’s position as a global technology leader.
The company’s revenue engine balances hardware, software, and recurring services across four segments: Mobile Networks, Network Infrastructure, Cloud and Network Services, and Nokia Technologies. Nokia operates strategically across the Americas, Europe, and Asia, serving service providers, hyperscalers, and governments worldwide. Its economic moat relies on a broad portfolio of patented technologies and a deep integration into global digital infrastructure.
Financial Performance & Fundamental Metrics
I analyze Nokia Oyj’s income statement, key financial ratios, and dividend payout policy to assess its core financial health and shareholder value creation.
Income Statement
The following table presents Nokia Oyj’s key income statement figures for fiscal years 2021 through 2025, reported in EUR.

| 2021 | 2022 | 2023 | 2024 | 2025 | |
|---|---|---|---|---|---|
| Revenue | 22.2B | 24.9B | 21.1B | 19.2B | 19.1B |
| Cost of Revenue | 13.4B | 14.7B | 12.4B | 10.4B | 11.1B |
| Operating Expenses | 6.7B | 7.9B | 7.0B | 6.9B | 6.5B |
| Gross Profit | 8.8B | 10.2B | 8.7B | 8.9B | 8.0B |
| EBITDA | 2.7B | 3.5B | 2.9B | 3.4B | 1.9B |
| EBIT | 1.8B | 2.4B | 2.0B | 2.4B | 0.9B |
| Interest Expense | 0.3B | 0.3B | 0.3B | 0.4B | 0.0B |
| Net Income | 1.6B | 4.3B | 0.7B | 1.3B | 0.6B |
| EPS | 0.29 | 0.76 | 0.12 | 0.23 | 0.11 |
| Filing Date | 2022-03-03 | 2023-03-02 | 2024-02-29 | 2025-03-13 | 2026-03-05 |
Income Statement Evolution
Nokia’s revenue declined by 0.6% in 2025 and by nearly 14% over five years, reflecting a contraction in sales. Gross profit fell 9.3% year-on-year. Margins showed mixed signals: gross margin remained favorable at 42.1%, while EBIT and net margins held neutral levels near 4.5% and 3.2%, respectively, indicating margin pressure despite cost control.
Is the Income Statement Favorable?
The 2025 income statement reveals net income dropping 52.4% from 2024, compressing net margin to 3.2%. EBIT plunged 64.4%, signaling operational challenges. Interest expense is negligible, a positive note. Despite some favorable cost trends, the overall fundamentals are weakened by declining profitability and shrinking earnings per share, resulting in an unfavorable income statement profile.
Financial Ratios
The table below presents key financial ratios for Nokia Oyj over the last five fiscal years, offering insight into profitability, leverage, liquidity, valuation, and operational efficiency:
| Ratios | 2021 | 2022 | 2023 | 2024 | 2025 |
|---|---|---|---|---|---|
| Net Margin | 7.3% | 17.1% | 3.1% | 6.6% | 3.2% |
| ROE | 9.3% | 19.9% | 3.2% | 6.2% | 2.9% |
| ROIC | 6.6% | 7.6% | 2.5% | 5.7% | 3.8% |
| P/E | 19.0 | 5.7 | 25.8 | 18.3 | 49.4 |
| P/B | 1.77 | 1.14 | 0.84 | 1.13 | 1.42 |
| Current Ratio | 1.62 | 1.59 | 1.66 | 1.58 | 1.58 |
| Quick Ratio | 1.42 | 1.33 | 1.41 | 1.39 | 1.36 |
| D/E | 0.33 | 0.26 | 0.25 | 0.23 | 0.25 |
| Debt-to-Assets | 14.1% | 12.9% | 13.0% | 12.1% | 13.9% |
| Interest Coverage | 7.7x | 8.6x | 5.5x | 5.5x | 0 |
| Asset Turnover | 0.55 | 0.58 | 0.53 | 0.49 | 0.51 |
| Fixed Asset Turnover | 7.91 | 8.46 | 7.40 | 9.07 | 7.68 |
| Dividend Yield | 0.03% | 1.45% | 3.56% | 3.09% | 2.43% |
Evolution of Financial Ratios
Nokia’s Return on Equity (ROE) declined significantly from 19.9% in 2022 to 2.9% in 2025, indicating weakening profitability. The Current Ratio remained stable around 1.58, reflecting consistent liquidity. Meanwhile, the Debt-to-Equity Ratio improved slightly, decreasing from 0.33 in 2021 to 0.25 in 2025, signaling a modest reduction in leverage.
Are the Financial Ratios Favorable?
In 2025, Nokia’s profitability ratios, including net margin and ROE, were unfavorable, with net margin at 3.16% and ROE at 2.88%, both below sector averages. Liquidity ratios like the current ratio (1.58) and quick ratio (1.36) were favorable, indicating solid short-term financial health. Leverage remained conservative with a debt-to-equity ratio of 0.25. Market valuation showed mixed signals: a high PE ratio of 49.36 was unfavorable, but price-to-book at 1.42 was favorable. Overall, 64% of ratios were favorable, supporting a generally positive financial assessment.
Shareholder Return Policy
Nokia Oyj maintains a consistent dividend policy with a payout ratio around 56-120% in recent years and a dividend yield near 2.4%. The dividend per share has gradually increased, supported by free cash flow coverage exceeding 70%, while share buybacks remain part of capital returns.
This distribution approach balances shareholder income and reinvestment needs. However, payout ratios exceeding 100% in 2025 suggest caution, as sustained high distributions could pressure cash flow. Overall, the policy aims to sustain long-term shareholder value amid evolving market conditions.
Score analysis
The radar chart below illustrates Nokia Oyj’s key financial scores across valuation, profitability, and leverage metrics:

Nokia shows a favorable discounted cash flow score of 4, indicating reasonable intrinsic value. Return on equity and assets scores are moderate at 3 each. However, debt-to-equity is unfavorable at 2, and price-to-earnings is very unfavorable at 1, suggesting valuation concerns. Price-to-book remains moderate at 3.
Analysis of the company’s bankruptcy risk
Nokia’s Altman Z-Score places it in the grey zone, signaling a moderate risk of financial distress and bankruptcy:

Is the company in good financial health?
The Piotroski Score diagram presents Nokia’s financial health assessment:
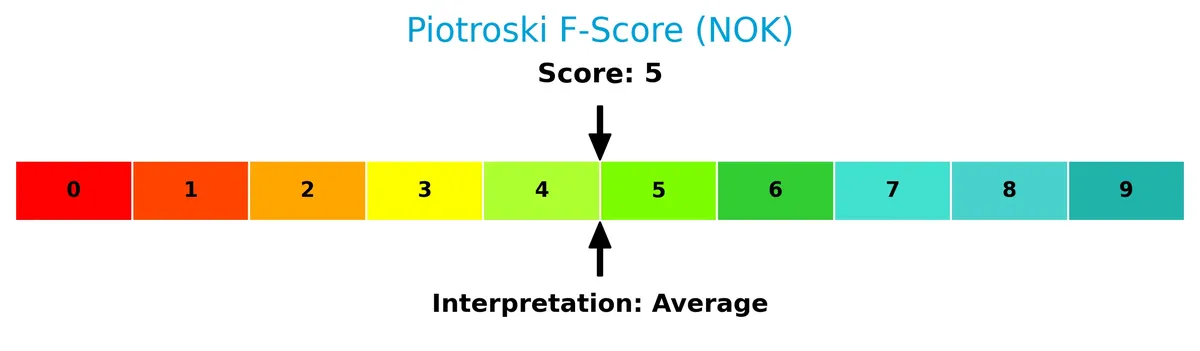
With a Piotroski Score of 5, Nokia reflects average financial strength, indicating neither a particularly strong nor weak financial position based on profitability, leverage, and liquidity criteria.
Competitive Landscape & Sector Positioning
This analysis explores Nokia Oyj’s strategic position within the communication equipment sector, focusing on its business segments and product offerings. I will assess whether Nokia holds a competitive advantage over its main industry rivals.
Strategic Positioning
Nokia Oyj maintains a diversified geographic revenue base, with significant exposure in EMEA (€8.3B), Americas (€7B), and Asia Pacific (€4.6B) regions. Its portfolio spans mobile, fixed, cloud networks, and IP routing, addressing multiple technology layers from 2G to 5G globally, reflecting broad market engagement.
Key Products & Brands
Nokia Oyj’s product portfolio spans communication equipment and network solutions, including hardware and software offerings:
| Product | Description |
|---|---|
| Mobile Networks | Radio access network products supporting technologies from 2G to 5G. |
| Network Infrastructure | Fixed networking solutions with fiber and copper access infrastructure, microwave radio links, and IP routing solutions. |
| Cloud and Network Services | Cloud, virtualization, and Wi-Fi portfolio including mesh solutions and cloud-based controllers. |
| Optical Networks | Coherent optical transponders, optical transport network switchers, wavelength-division multiplexers, and optical line systems. |
| Submarine Networks | Solutions for metro access, data center interconnect, regional, long-haul, and ultra-long-haul applications. |
| Business Applications Software | Software for cloud, cognitive services, core networks, and enterprise solutions. |
| Nokia Technologies | Licensing of intellectual property including patents, technologies, and brand rights. |
Nokia’s diversified product suite addresses a broad range of telecom infrastructure needs. It combines legacy network hardware with advanced software and cloud services, serving global communications providers and digital industries.
Main Competitors
There are 7 main competitors in the Communication Equipment industry; the table lists the top 7 leaders by market capitalization:
| Competitor | Market Cap. |
|---|---|
| Cisco Systems, Inc. | 300B |
| Motorola Solutions, Inc. | 63B |
| Nokia Oyj | 35B |
| Hewlett Packard Enterprise Company | 32B |
| Credo Technology Group Holding Ltd | 25B |
| Zebra Technologies Corporation | 13B |
| AudioCodes Ltd. | 255M |
Nokia ranks 3rd among its competitors with a market cap at 13.9% of the leader, Cisco Systems. It sits below the average market cap of the top 10 (67B) but above the sector median (32B). Nokia is 51.7% smaller than Motorola Solutions, its closest larger rival.
Does Nokia have a competitive advantage?
Nokia currently lacks a competitive advantage as it is destroying value with a declining ROIC that remains below its WACC, reflecting inefficient capital use and decreasing profitability. Its gross margin is favorable at 42%, but earnings and net margin trends are unfavorable, signaling operational challenges.
Looking ahead, Nokia’s diverse network solutions portfolio—from 2G to 5G, cloud services, and optical networks—positions it for opportunities in expanding markets and emerging technologies. Continued innovation and market expansion are crucial to reversing its value destruction trend.
Comparisons with competitors
Check out how we compare the company to its competitors:
SWOT Analysis
This SWOT analysis highlights Nokia Oyj’s key strategic factors shaping its competitive position and growth potential.
Strengths
- strong global footprint
- diversified product portfolio
- favorable financial ratios (low debt, good liquidity)
Weaknesses
- declining revenue and profitability
- negative ROIC vs. WACC
- high P/E ratio signals overvaluation
Opportunities
- 5G network expansion
- growth in cloud and virtualization services
- rising demand in emerging markets
Threats
- intense competition in telecom equipment
- rapid technology shifts
- geopolitical risks affecting supply chains
Nokia’s strengths in scale and financial health provide a solid base. However, persistent earnings decline and value destruction warrant cautious capital allocation. The company must innovate aggressively to capture 5G and cloud growth while managing competitive and geopolitical pressures.
Stock Price Action Analysis
The weekly stock chart below illustrates Nokia Oyj’s price movements over the past 12 months, highlighting key turning points and trend shifts:
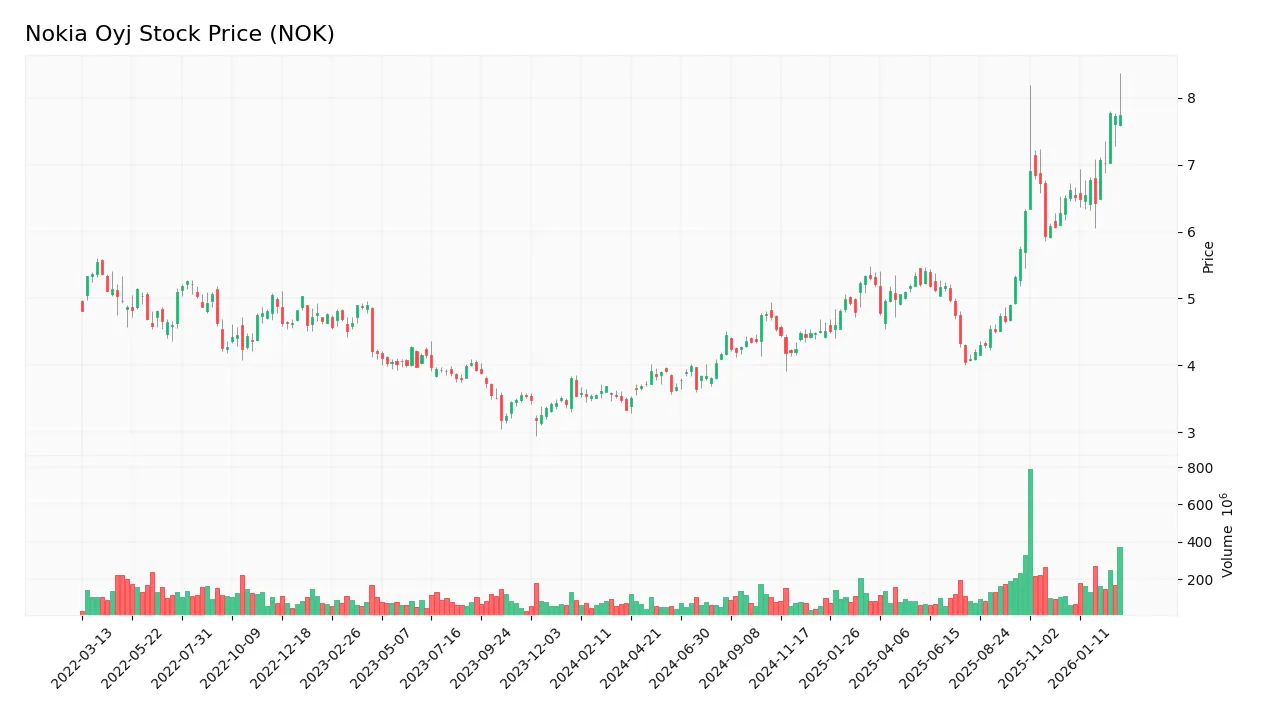
Trend Analysis
Nokia’s stock price surged 132.43% over the past year, indicating a strong bullish trend with clear acceleration. The price ranged between 3.33 and 7.77, with low volatility at 1.04 standard deviation. Recent months show a 19.08% gain with a mild upward slope of 0.13 and reduced volatility at 0.51.
Volume Analysis
Trading volume increased notably over the last three months, driven by buyers who accounted for 60.07% of activity. Buyer dominance and rising volumes suggest growing investor confidence and robust market participation in Nokia’s shares.
Target Prices
Analysts present a clear target consensus for Nokia Oyj, reflecting moderate upside potential.
| Target Low | Target High | Consensus |
|---|---|---|
| 6.57 | 8.5 | 7.54 |
The consensus target price of $7.54 suggests steady growth expectations, with a balanced range between $6.57 and $8.50. Analysts generally anticipate a positive trajectory for Nokia in the near term.
Analyst & Consumer Opinions
This section reviews recent analyst ratings and consumer feedback to provide a balanced view of Nokia Oyj’s market perception.

Don’t Let Luck Decide Your Entry Point
Optimize your entry points with our advanced ProRealTime indicators. You’ll get efficient buy signals with precise price targets for maximum performance. Start outperforming now!
Stock Grades
Here are the latest verified analyst grades for Nokia Oyj from prominent financial firms:
| Grading Company | Action | New Grade | Date |
|---|---|---|---|
| JP Morgan | Maintain | Overweight | 2025-12-01 |
| Jefferies | Upgrade | Buy | 2025-10-28 |
| JP Morgan | Maintain | Overweight | 2025-10-24 |
| JP Morgan | Maintain | Overweight | 2025-07-29 |
| JP Morgan | Maintain | Overweight | 2025-02-21 |
| Craig-Hallum | Maintain | Buy | 2025-01-06 |
| JP Morgan | Upgrade | Overweight | 2024-12-09 |
| JP Morgan | Maintain | Neutral | 2024-10-21 |
| Northland Capital Markets | Maintain | Outperform | 2024-10-18 |
| Northland Capital Markets | Maintain | Outperform | 2024-09-04 |
The consensus reflects a positive tilt with repeated upgrades and mostly overweight or buy ratings. Stability in JP Morgan’s view and Jefferies’ recent upgrade highlight growing confidence.
Consumer Opinions
Nokia Oyj draws mixed reactions from its global customer base, reflecting its complex market position.
| Positive Reviews | Negative Reviews |
|---|---|
| Reliable network infrastructure with strong uptime. | Customer service response times can be slow. |
| Competitive pricing on 5G equipment. | Software updates sometimes cause compatibility issues. |
| Solid product durability and robust build quality. | Limited innovation compared to peers. |
Overall, consumers praise Nokia’s reliability and cost-effectiveness. However, slow support and occasional software glitches remain pain points, indicating areas for improvement in customer experience and product innovation.
Risk Analysis
Below is a concise overview of key risks facing Nokia Oyj, including their likelihood and potential impact on performance:
| Category | Description | Probability | Impact |
|---|---|---|---|
| Financial Health | Altman Z-Score in grey zone (2.14) signals moderate bankruptcy risk. | Medium | High |
| Profitability | Low net margin (3.16%) and ROE (2.88%) indicate weak earnings. | High | Medium |
| Valuation | Elevated P/E ratio (49.36) suggests overvaluation risk. | High | Medium |
| Debt Levels | Low debt-to-equity (0.25) is favorable but rising debt could harm. | Low | Low |
| Market Volatility | Beta of 0.61 reflects lower sensitivity but market shifts pose risk. | Medium | Medium |
| Competitive Pressure | Intense telecom competition could pressure margins and growth. | High | High |
The most pressing concerns are Nokia’s moderate bankruptcy risk and weak profitability metrics. Despite a strong balance sheet, the company’s high valuation and fierce industry competition amplify downside risks. Investors should weigh these factors carefully.
Should You Buy Nokia Oyj?
Nokia appears to be in a grey zone with moderate profitability and operational efficiency, yet it suffers from a very unfavorable moat due to declining ROIC and value destruction. Despite a manageable leverage profile, its B rating suggests cautious value creation.
Strength & Efficiency Pillars
Nokia Oyj shows operational resilience with a gross margin of 42.08%, reflecting solid cost control. However, profitability metrics reveal challenges: net margin stands at a modest 3.16%, and return on equity is a low 2.88%. The company’s ROIC of 3.82% falls below its WACC of 6.12%, indicating it is not currently a value creator. Despite favorable leverage ratios and interest coverage, the declining ROIC trend signals deteriorating capital efficiency over time.
Weaknesses and Drawbacks
Nokia resides in the Altman Z-Score grey zone at 2.14, signaling moderate bankruptcy risk and financial vulnerability. The company suffers from an unfavorable P/E of 49.36, suggesting an expensive valuation relative to earnings. Additionally, revenue and net income have contracted sharply, with net income down 62.77% over the period. While leverage is moderate (debt-to-equity 0.25), the weak profitability and valuation premium create headwinds that could pressure the stock in a risk-off environment.
Our Final Verdict about Nokia Oyj
Nokia presents a mixed fundamental profile with operational strengths but significant value erosion and moderate solvency risk. Despite a bullish long-term trend and buyer dominance recently, the modest profitability and elevated valuation might suggest a cautious stance. The company could appear speculative for conservative investors, and the current market action may warrant a wait-and-see approach before committing capital.
Disclaimer: This content is for informational purposes only and does not constitute financial, investment, or other professional advice. Investing in financial markets involves a significant risk of loss, and past performance is not indicative of future results.
Additional Resources
- Nokia Corporation (NYSE:NOK) Short Interest Update – MarketBeat (Mar 04, 2026)
- Here is Why Nokia Oyj (NOK) is Highly Favored by Hedge Funds – Yahoo Finance (Feb 12, 2026)
- How Is The Market Feeling About Nokia Oyj? – Nokia (NYSE:NOK) – Benzinga (Mar 03, 2026)
- Nokia shares jump as MWC announcements spotlight AI-RAN and AI-native 6G momentum – Quiver Quantitative (Mar 02, 2026)
- Nokia: From Paper Mill To AI And Defense — With Iconic Mobile Phones In Between (NYSE:NOK) – Seeking Alpha (Dec 16, 2025)
For more information about Nokia Oyj, please visit the official website: nokia.com