Home > Analyses > Utilities > NiSource Inc.
NiSource powers millions of homes and businesses across the Midwest and Mid-Atlantic, making energy a seamless part of daily life. It commands a leading position in regulated natural gas and electric utilities, underpinned by a vast network of pipelines and diverse generation assets. Known for its steady innovation and operational reliability, NiSource shapes regional energy landscapes with resilience. The key question: does its solid utility franchise still justify investor enthusiasm amid evolving market dynamics?

Table of contents
Business Model & Company Overview
NiSource Inc., founded in 1847 and headquartered in Merrillville, Indiana, dominates the regulated gas and electric utility sector. It serves a broad ecosystem, distributing natural gas to over 3.2M customers across multiple states and delivering electricity to nearly half a million in northern Indiana. The company integrates gas distribution with electric generation, transmission, and wholesale transactions, creating a robust energy platform underpinned by diversified fuel sources, including coal, natural gas, hydro, and wind.
NiSource’s revenue engine balances regulated gas distribution with electric operations, combining stable, recurring service fees from millions of residential and commercial customers. Its extensive 54,600 miles of gas pipelines and 1,000 miles of transmission mains underpin reliable service across the Americas. This geographic footprint and asset mix establish a competitive advantage that fortifies NiSource’s economic moat and positions it as a key influencer in the future of U.S. energy infrastructure.
Financial Performance & Fundamental Metrics
I analyze NiSource Inc.’s income statement, key financial ratios, and dividend payout policy to assess its profitability, efficiency, and shareholder return strategy.
Income Statement
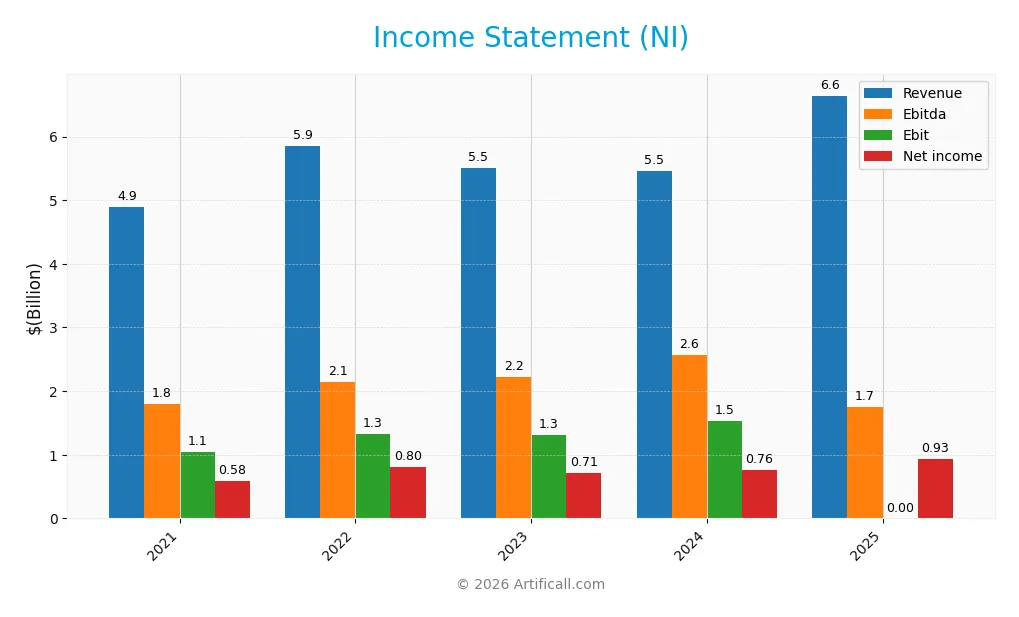
The table below summarizes NiSource Inc.’s income statement for the fiscal years 2021 through 2025, highlighting key financial metrics and filing dates.
| 2021 | 2022 | 2023 | 2024 | 2025 | |
|---|---|---|---|---|---|
| Revenue | 4.90B | 5.85B | 5.51B | 5.46B | 6.64B |
| Cost of Revenue | 2.85B | 3.60B | 3.03B | 2.65B | 1.71B |
| Operating Expenses | 1.04B | 0.98B | 1.18B | 1.35B | 4.81B |
| Gross Profit | 2.05B | 2.25B | 2.48B | 2.81B | 4.93B |
| EBITDA | 1.80B | 2.15B | 2.22B | 2.57B | 1.75B |
| EBIT | 1.05B | 1.33B | 1.32B | 1.53B | 0.00 |
| Interest Expense | 0.34B | 0.36B | 0.49B | 0.52B | 0.64B |
| Net Income | 0.58B | 0.80B | 0.71B | 0.76B | 0.93B |
| EPS | 1.35 | 1.84 | 1.59 | 1.63 | 1.96 |
| Filing Date | 2022-02-23 | 2023-02-22 | 2024-02-21 | 2025-02-12 | 2026-02-11 |
Income Statement Evolution
NiSource Inc. shows strong revenue growth of 21.8% in 2025, reaching $6.64B, up from $5.46B in 2024. Net income rose to $929.5M, up 22.2% year-over-year. Gross margin improved markedly to 74.3%, signaling better cost control, despite operating expenses growing at the same pace as revenue. Net margin held steady near 14%.
Is the Income Statement Favorable?
The 2025 income statement presents generally favorable fundamentals. Revenue and net income exhibit consistent growth, with net income up nearly 59% over five years. Despite a 100% decline in EBIT growth, the company maintains a strong gross margin and a favorable net margin of 14%. Interest expense remains manageable at 9.6% of revenue, supporting profitability in a challenging cost environment.
Financial Ratios
The table below presents key financial ratios for NiSource Inc. over the last five fiscal years, highlighting profitability, valuation, liquidity, leverage, and efficiency metrics:
| Ratios | 2021 | 2022 | 2023 | 2024 | 2025 |
|---|---|---|---|---|---|
| Net Margin | 12% | 14% | 13% | 14% | 14% |
| ROE | 8.4% | 11% | 8.6% | 8.8% | 9.8% |
| ROIC | 3.8% | 4.4% | 3.7% | 4.1% | 11.7% |
| P/E | 18.6 | 13.9 | 15.5 | 22.0 | 21.2 |
| P/B | 1.6 | 1.5 | 1.3 | 1.9 | 2.1 |
| Current Ratio | 0.70 | 0.55 | 0.85 | 0.51 | 0.00 |
| Quick Ratio | 0.52 | 0.39 | 0.76 | 0.41 | 0.00 |
| D/E | 1.44 | 1.52 | 1.71 | 1.61 | 1.64 |
| Debt-to-Assets | 41% | 43% | 45% | 44% | 0.00 |
| Interest Coverage | 2.95 | 3.51 | 2.65 | 2.81 | -2.87 |
| Asset Turnover | 0.20 | 0.22 | 0.18 | 0.17 | 0.00 |
| Fixed Asset Turnover | 0.27 | 0.29 | 0.25 | 0.21 | 0.00 |
| Dividend Yield | 3.7% | 3.9% | 4.1% | 2.9% | 2.7% |
Evolution of Financial Ratios
NiSource’s Return on Equity (ROE) fluctuated, peaking near 10.6% in 2022 before declining to 9.84% in 2025. The Current Ratio showed instability, dropping to zero in 2025 from 0.85 in 2023, signaling deteriorating liquidity. Debt-to-Equity Ratio rose steadily, reaching 1.64 in 2025, indicating increased leverage. Profitability margins remained relatively stable, with net margin around 14%.
Are the Financial Ratios Fovorable?
In 2025, NiSource’s profitability ratios, including net margin (13.99%) and ROIC (11.67%), appear favorable relative to its 5.23% WACC. However, liquidity ratios are unfavorable, with a zero current and quick ratio, signaling potential short-term risk. Leverage is elevated, with a debt-to-equity ratio at 1.64 and negative interest coverage. Market valuation ratios like P/E (21.25) and P/B (2.09) remain neutral. Overall, the ratio profile is slightly unfavorable.
Shareholder Return Policy
NiSource Inc. maintains a consistent dividend payout ratio near 57%, with dividends per share steadily rising to $1.12 in 2025. The annual yield remains around 2.7%, supported by moderate free cash flow coverage, while share buybacks are also part of its capital return strategy.
Despite sound dividend payments, free cash flow remains negative, indicating potential risks for sustaining distributions long term. The balance between dividends and buybacks reflects a cautious approach, but ongoing negative free cash flow warrants close monitoring to ensure enduring shareholder value creation.
Score analysis
The following radar chart illustrates NiSource Inc.’s key valuation and financial performance scores:
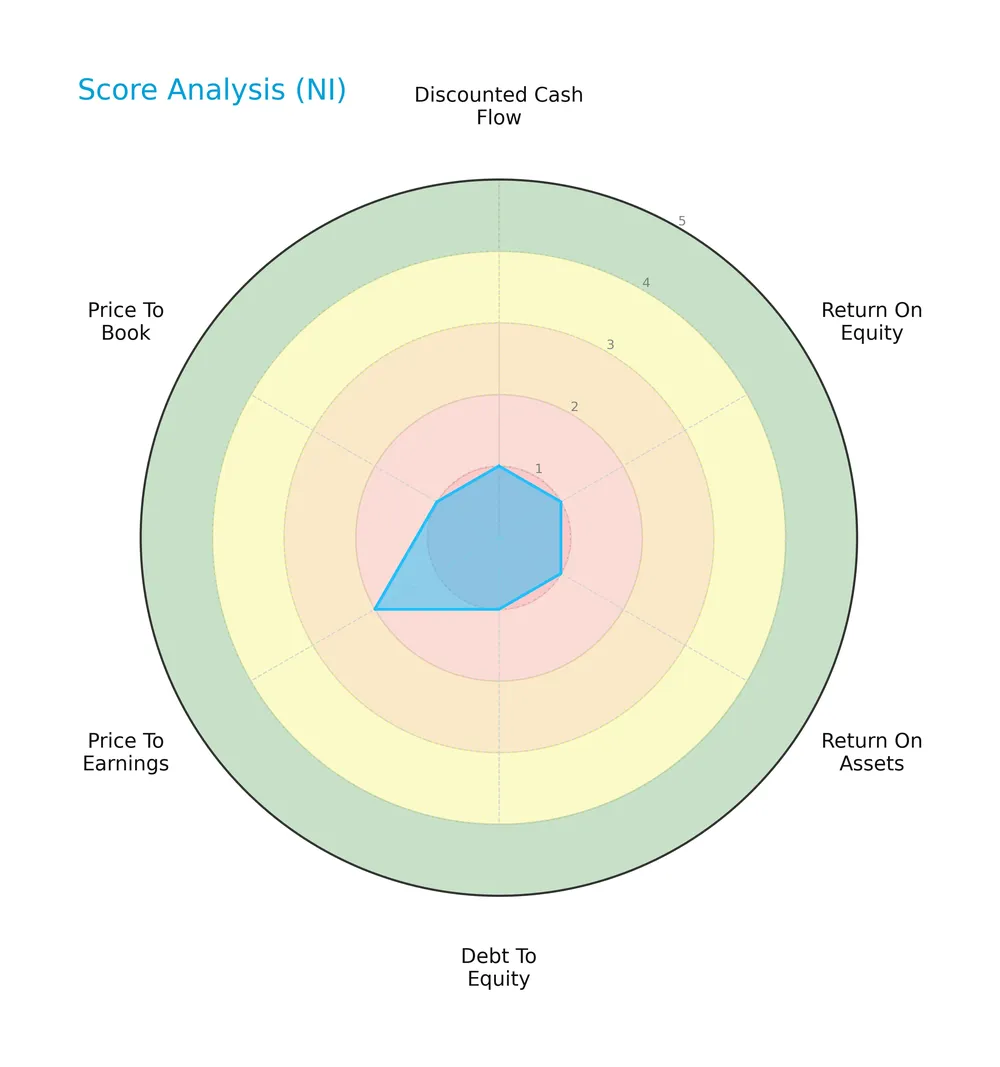
NiSource scores very low across discounted cash flow, ROE, ROA, debt-to-equity, and price-to-book metrics, indicating financial weakness. The price-to-earnings score slightly improves but remains unfavorable overall.
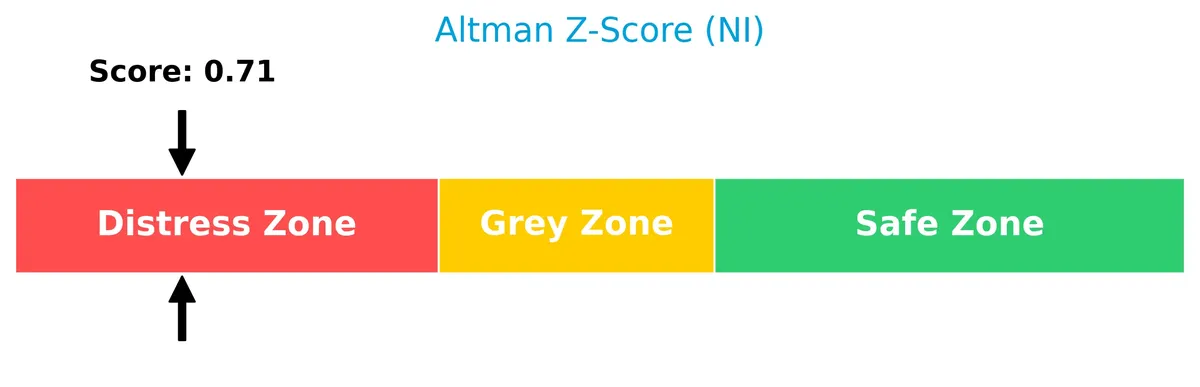
Analysis of the company’s bankruptcy risk
NiSource’s Altman Z-Score sits in the distress zone, signaling a high risk of financial distress and potential bankruptcy:
Is the company in good financial health?
The Piotroski Score diagram presents NiSource’s moderate financial strength based on nine fundamental criteria:

With a Piotroski Score of 5, NiSource shows average financial health, reflecting neither strong nor poor financial fundamentals at this time.
Competitive Landscape & Sector Positioning
This analysis examines NiSource Inc.’s strategic positioning within the regulated gas and electric utility sector. We will review revenue by segment, key products, and main competitors. I will assess whether NiSource holds a competitive advantage over its industry peers.
Strategic Positioning
NiSource Inc. maintains a concentrated product portfolio focused on regulated gas and electric utilities. It operates primarily in the US Midwest and Mid-Atlantic regions, serving over 3.7M customers across gas distribution and electric operations, with a consistent revenue split favoring gas distribution.
Revenue by Segment
This pie chart presents NiSource Inc.’s revenue distribution by segment, covering fiscal year 2023 and highlighting the contributions of Electric and Gas Distribution Operations.
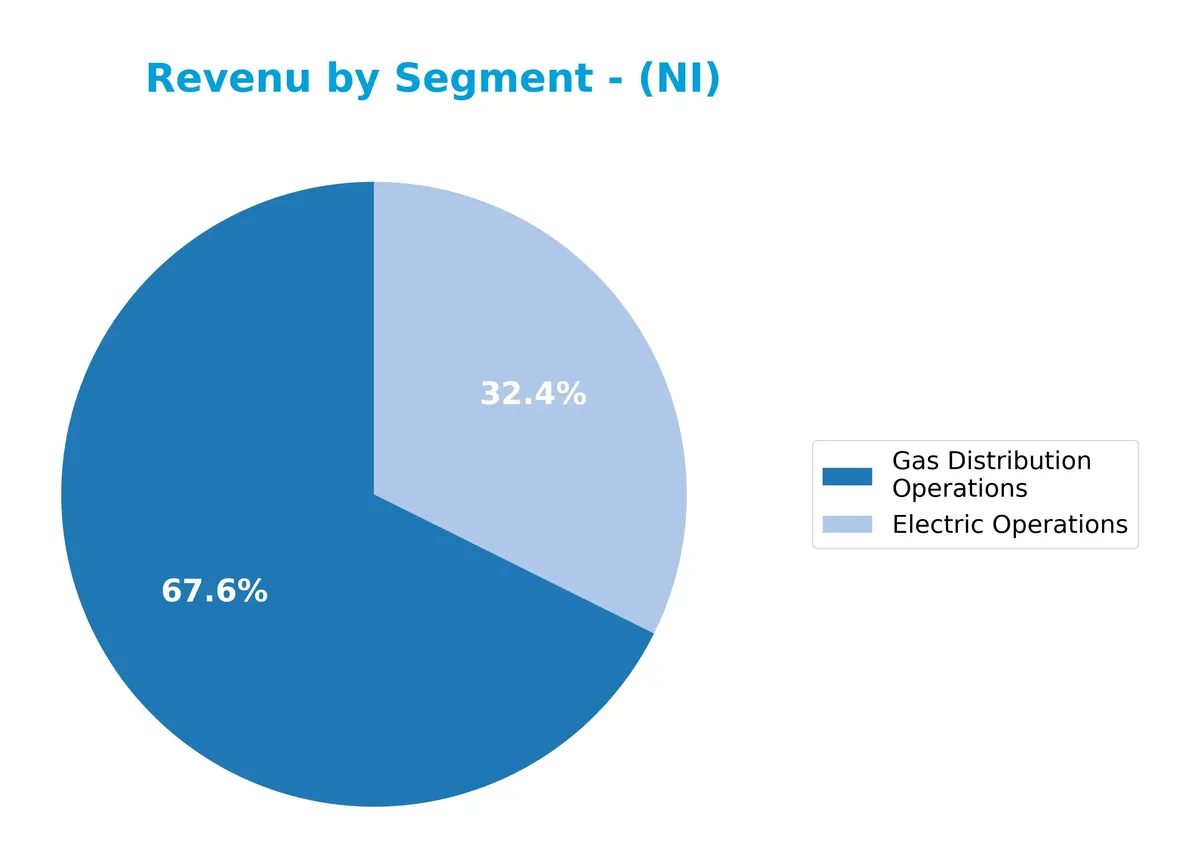
NiSource’s revenue primarily stems from Gas Distribution Operations, generating $3.73B in 2023, compared to $1.79B from Electric Operations. Historically, gas distribution dominates, reflecting a steady core business. However, both segments experienced a slight revenue decline from 2022, signaling a mild deceleration. The concentration risk remains moderate, with gas distribution consistently accounting for roughly two-thirds of total segment revenue.
Key Products & Brands
NiSource Inc. operates two main segments with distinct products and services as detailed below:
| Product | Description |
|---|---|
| Gas Distribution Operations | Distributes natural gas to 3.25M customers across IN, OH, PA, VA, KY, and MD via 54.6K miles of main pipelines. |
| Electric Operations | Generates and distributes electricity to 483K customers in northern Indiana, operating multiple generating plants. |
NiSource’s core business lies in regulated natural gas distribution and electric utility services. Gas distribution serves a larger customer base and generates higher revenue than electric operations.
Main Competitors
In the Regulated Gas industry, there are 2 main competitors. The table lists the top 10 leaders by market capitalization:
| Competitor | Market Cap. |
|---|---|
| Atmos Energy Corporation | 27.4B |
| NiSource Inc. | 19.8B |
NiSource Inc. ranks 2nd among its competitors, holding 77.2% of the market cap of the leader, Atmos Energy Corporation. The company sits below both the average market cap of the top 10 and the median market cap in the sector. It trails its closest rival by a significant 29.5% margin, indicating a notable gap in scale.
Comparisons with competitors
Check out how we compare the company to its competitors:
Does NiSource have a competitive advantage?
NiSource demonstrates a sustainable competitive advantage, reflected in a ROIC significantly above its WACC and a strong growth trend in profitability. Its regulated utility operations and extensive pipeline network provide durable economic moats in the energy sector.
Looking ahead, NiSource’s diverse generation assets—including coal, gas, hydro, and wind—position it to capitalize on evolving energy markets. Expansion opportunities exist in both gas distribution and electric operations across several U.S. states.
SWOT Analysis
This SWOT analysis highlights NiSource Inc.’s strategic position by identifying key internal and external factors affecting its future.
Strengths
- strong regulated utility presence
- growing ROIC well above WACC
- diversified energy generation assets
Weaknesses
- weak liquidity ratios
- high debt-to-equity ratio
- negative interest coverage
Opportunities
- expansion in clean energy capacity
- favorable natural gas demand trends
- potential regulatory support for utilities
Threats
- regulatory risks and policy changes
- commodity price volatility
- infrastructure aging and maintenance costs
NiSource shows durable competitive advantages with improving profitability, but liquidity and leverage pose risks. Strategic focus should balance clean energy growth with disciplined capital management to mitigate regulatory and financial threats.
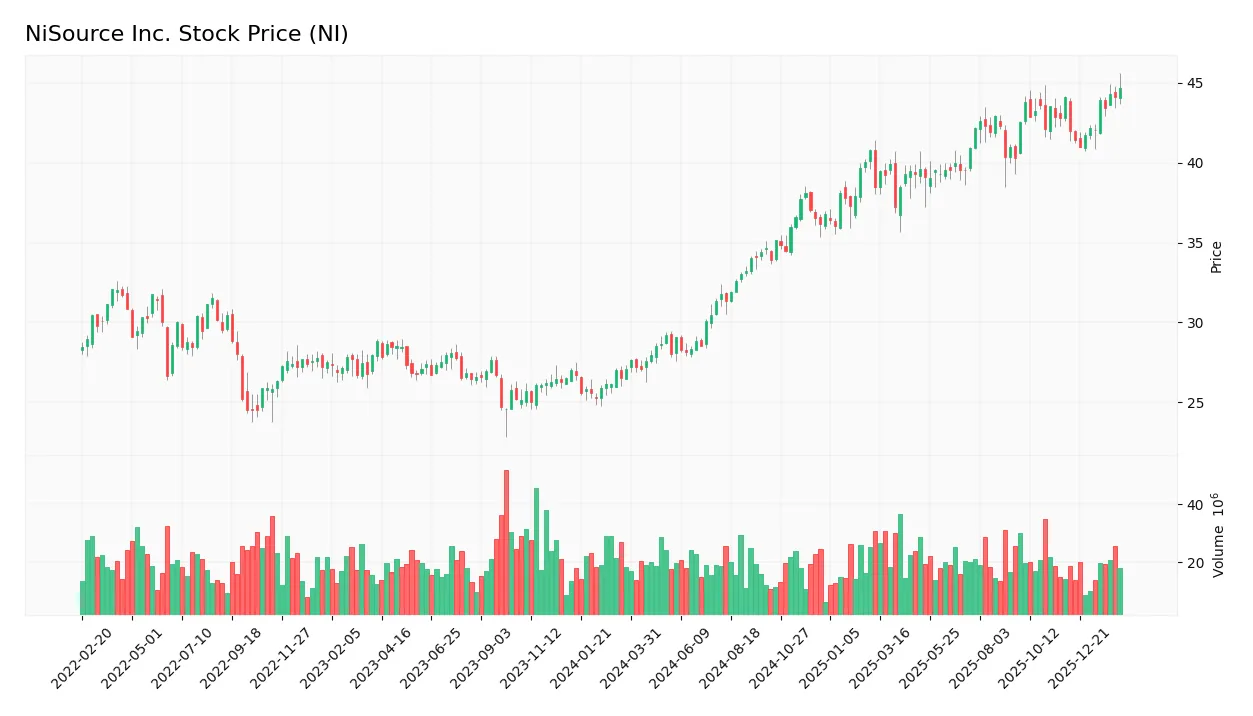
Stock Price Action Analysis
The weekly chart for NiSource Inc. (NI) displays the stock’s price fluctuations and key support and resistance levels over the last 100 weeks:
Trend Analysis
Over the past 12 months, NiSource’s stock price increased by 64.8%, indicating a strong bullish trend with acceleration. The price ranged between a low of 27.07 and a high of 44.66, showing high volatility with a standard deviation of 5.2. Recent weeks show a neutral trend with a modest 1.2% gain.
Volume Analysis
Total trading volume reached 2.45B shares, with buyers accounting for 58.62%, reflecting buyer-driven activity overall. However, volume trends are decreasing. In the recent quarter, seller volume slightly surpassed buyers (55% seller dominance), suggesting cautious investor sentiment and reduced market participation.
Target Prices
Analysts set a consensus target price of $47.33 for NiSource Inc., reflecting moderate upside potential.
| Target Low | Target High | Consensus |
|---|---|---|
| 45 | 50 | 47.33 |
This range suggests a stable outlook with limited volatility, indicating steady market confidence in NiSource’s prospects.

Don’t Let Luck Decide Your Entry Point
Optimize your entry points with our advanced ProRealTime indicators. You’ll get efficient buy signals with precise price targets for maximum performance. Start outperforming now!
Analyst & Consumer Opinions
This section examines analyst ratings and consumer feedback concerning NiSource Inc., providing insight into market perceptions and user experiences.
Stock Grades
The following table presents the latest verified grades for NiSource Inc. from reputable analysts as of early 2026:
| Grading Company | Action | New Grade | Date |
|---|---|---|---|
| Wells Fargo | Maintain | Overweight | 2026-01-20 |
| UBS | Maintain | Buy | 2025-12-17 |
| Mizuho | Maintain | Outperform | 2025-12-04 |
| Jefferies | Upgrade | Buy | 2025-10-31 |
| Evercore ISI Group | Maintain | In Line | 2025-10-30 |
| Barclays | Maintain | Overweight | 2025-10-21 |
| Evercore ISI Group | Maintain | In Line | 2025-10-20 |
| BMO Capital | Maintain | Outperform | 2025-09-29 |
| Jefferies | Downgrade | Hold | 2025-09-05 |
| Barclays | Maintain | Overweight | 2025-08-04 |
Overall, analyst grades on NiSource show a predominantly positive trend with multiple buy and overweight ratings. Notably, Jefferies upgraded from hold to buy recently, reflecting improving sentiment despite a prior downgrade.
Consumer Opinions
NiSource Inc. garners mixed consumer sentiment, reflecting both satisfaction with service reliability and frustration over pricing and customer support.
| Positive Reviews | Negative Reviews |
|---|---|
| “Consistent energy delivery with minimal outages.” | “Customer service is slow and unresponsive.” |
| “Competitive rates compared to local providers.” | “Billing errors caused delays in payments.” |
| “Easy-to-use online account management tools.” | “Occasional unexpected fee increases.” |
Overall, customers appreciate NiSource’s dependable energy supply and user-friendly digital tools. However, slow customer service and billing issues remain persistent pain points.
Risk Analysis
The table below highlights key risks facing NiSource Inc., focusing on their likelihood and potential impact:
| Category | Description | Probability | Impact |
|---|---|---|---|
| Financial Health | Altman Z-Score in distress zone signals high bankruptcy risk | High | High |
| Leverage | Debt-to-equity ratio at 1.64, indicating heavy reliance on debt | High | Medium |
| Liquidity | Current and quick ratios are zero, showing poor short-term liquidity | High | High |
| Profitability | ROE at 9.84% is below industry averages, suggesting weak equity returns | Medium | Medium |
| Operational Risk | Asset turnover metrics at zero, implying inefficiency or data gaps | Medium | Medium |
| Market Volatility | Beta of 0.65 indicates moderate sensitivity to market fluctuations | Medium | Low |
NiSource’s most pressing risks are its distressed financial health and poor liquidity, which threaten solvency. Despite favorable net margin and ROIC, its high debt load and weak coverage ratios compound vulnerability. Investors must weigh these factors cautiously.
Should You Buy NiSource Inc.?
NiSource appears to be delivering improving operational efficiency and robust value creation through a growing ROIC, suggesting a durable moat. Despite a substantial leverage profile and distress-zone Altman Z-score, its overall rating remains very favorable, indicating mixed but cautiously optimistic financial health.
Strength & Efficiency Pillars
NiSource Inc. shows operational resilience with a strong net margin of 13.99% and a favorable gross margin of 74.25%. Its return on invested capital (ROIC) stands at 11.67%, comfortably above its weighted average cost of capital (WACC) of 5.23%, confirming the company as a clear value creator. Although return on equity (ROE) at 9.84% is below ideal levels, the growing ROIC trend suggests improving capital efficiency over time.
Weaknesses and Drawbacks
NiSource is currently in financial distress, evidenced by an Altman Z-Score of 0.71, signaling a high bankruptcy risk. This red flag overshadows profitability. The company’s debt-to-equity ratio of 1.64 and zero current and quick ratios highlight liquidity challenges and leverage concerns. Moreover, interest coverage is negative, indicating difficulty servicing debt. Market pressure is apparent too, with recent seller dominance at 55.06%, adding short-term headwinds.
Our Final Verdict about NiSource Inc.
Despite operational strengths, NiSource’s solvency risk marked by its distress-zone Z-Score makes the investment profile highly speculative. The company might appear as a value creator but remains too risky for conservative capital. Investors should exercise extreme caution until the firm stabilizes its financial health and improves liquidity metrics.
Disclaimer: This content is for informational purposes only and does not constitute financial, investment, or other professional advice. Investing in financial markets involves a significant risk of loss, and past performance is not indicative of future results.
Additional Resources
- NiSource (NI) Q4 Earnings and Revenues Top Estimates – Yahoo Finance (Feb 11, 2026)
- NiSource Inc (NI) Q4 2025 Earnings Call Highlights: Strong EPS Growth and Ambitious Investment Plans – GuruFocus (Feb 11, 2026)
- NiSource: Q4 Earnings Snapshot – king5.com (Feb 11, 2026)
- NiSource Amazon data center deal ties to $28B grid plan, $1B customer savings – Stock Titan (Feb 11, 2026)
- NiSource Q4 Earnings Surpass Estimates, Revenues Increase Y/Y – The Globe and Mail (Feb 11, 2026)
For more information about NiSource Inc., please visit the official website: nisource.com