Home > Analyses > Consumer Cyclical > NIKE, Inc.
NIKE, Inc. redefines how millions experience sports and lifestyle through its iconic footwear and apparel. As a dominant force in the athletic and casual wear industry, NIKE leads with innovation, quality, and powerful brand influence under its flagship NIKE, Jordan, and Converse lines. With a global footprint and a reputation for setting trends, NIKE’s ability to sustain growth amid evolving consumer preferences raises the key question: do its fundamentals still justify its current market valuation and future potential?

Table of contents
Business Model & Company Overview
NIKE, Inc., founded in 1964 and headquartered in Beaverton, Oregon, stands as a global leader in the Apparel – Footwear & Accessories industry. The company orchestrates a dynamic ecosystem comprising athletic footwear, apparel, and performance equipment, marketed under iconic brands such as NIKE, Jumpman, and Converse. Its broad product portfolio caters to men, women, and kids, blending sport and casual lifestyle seamlessly.
NIKE’s revenue engine balances innovative hardware—footwear and equipment—with software-driven services, including licensed digital applications and platforms. Its expansive global footprint spans the Americas, Europe, and Asia, distributing through retail stores, online platforms, and independent channels. This robust, diversified model fosters a durable competitive advantage, underpinning NIKE’s role in shaping the future of athletic wear worldwide.
Financial Performance & Fundamental Metrics
I will analyze NIKE, Inc.’s income statement, key financial ratios, and dividend payout policy to provide a clear picture of its fundamental health and investment potential.
Income Statement
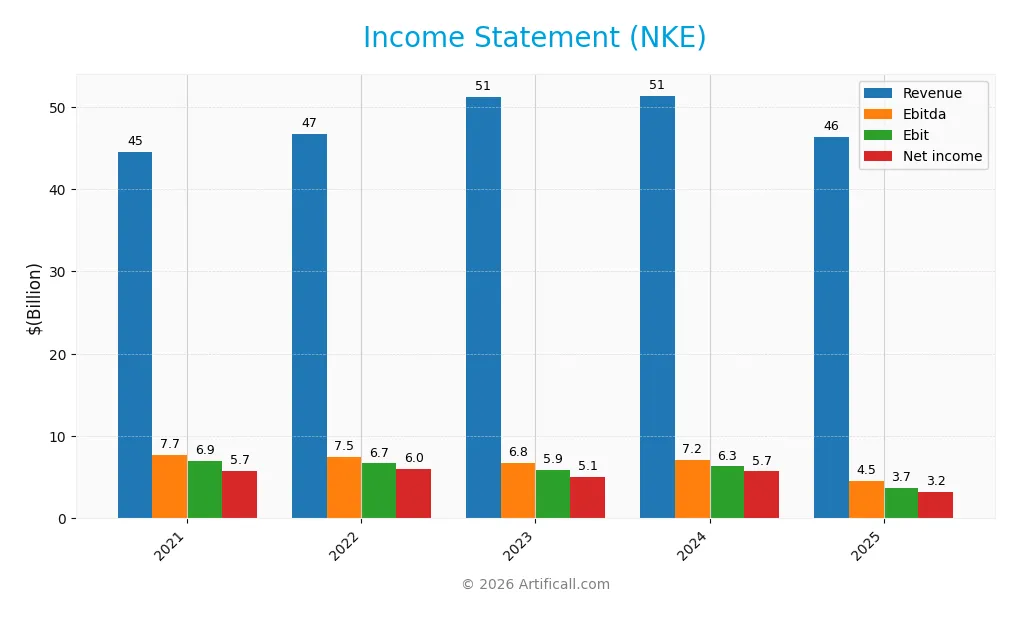
The table below summarizes NIKE, Inc.’s key income statement figures for fiscal years 2021 through 2025, measured in USD.
| 2021 | 2022 | 2023 | 2024 | 2025 | |
|---|---|---|---|---|---|
| Revenue | 44.5B | 46.7B | 51.2B | 51.4B | 46.3B |
| Cost of Revenue | 24.6B | 25.2B | 28.9B | 28.5B | 26.5B |
| Operating Expenses | 13.0B | 14.8B | 16.4B | 16.6B | 16.1B |
| Gross Profit | 19.9B | 21.5B | 22.3B | 22.9B | 19.8B |
| EBITDA | 7.7B | 7.5B | 6.8B | 7.2B | 4.5B |
| EBIT | 6.9B | 6.7B | 5.9B | 6.3B | 3.7B |
| Interest Expense | 0.29B | 0.29B | 0.28B | 0.26B | 0.29B |
| Net Income | 5.7B | 6.0B | 5.1B | 5.7B | 3.2B |
| EPS | 3.64 | 3.83 | 3.27 | 3.76 | 2.17 |
| Filing Date | 2021-07-20 | 2022-07-21 | 2023-07-20 | 2024-07-25 | 2025-07-17 |
Income Statement Evolution
From 2021 to 2025, NIKE, Inc.’s revenue showed a modest overall growth of 3.98%, but experienced a notable decline of 9.84% in the latest year. Net income, however, declined sharply by 43.79% over the same period, with a significant 37.36% drop in net margin in the most recent year. Gross margin remained relatively favorable at 42.73%, while EBIT margin was neutral at 7.99%, indicating margin pressures alongside falling profitability.
Is the Income Statement Favorable?
In 2025, NIKE reported revenue of $46.3B and net income of $3.2B, reflecting a challenging year with a 9.8% revenue decrease and a 37.4% decline in net margin. Operating expenses and cost of goods reduced in line with revenue, but EBIT fell 41.3% to $3.7B, producing a neutral EBIT margin of 7.99%. Despite favorable gross and net margins, the overall fundamentals are considered unfavorable due to significant declines in earnings and margin contraction.
Financial Ratios
The table below presents key financial ratios for NIKE, Inc. over the last five fiscal years, providing insight into profitability, valuation, liquidity, leverage, and efficiency:
| Ratios | 2021 | 2022 | 2023 | 2024 | 2025 |
|---|---|---|---|---|---|
| Net Margin | 13% | 13% | 10% | 11% | 7% |
| ROE | 45% | 40% | 36% | 40% | 24% |
| ROIC | 21% | 20% | 17% | 19% | 12% |
| P/E | 37 | 31 | 32 | 25 | 28 |
| P/B | 17 | 12 | 12 | 10 | 7 |
| Current Ratio | 2.72 | 2.63 | 2.72 | 2.40 | 2.21 |
| Quick Ratio | 2.01 | 1.84 | 1.81 | 1.69 | 1.50 |
| D/E | 1.00 | 0.83 | 0.87 | 0.83 | 0.83 |
| Debt-to-Assets | 34% | 31% | 32% | 31% | 30% |
| Interest Coverage | 24.0 | 22.9 | 20.9 | 24.2 | 12.8 |
| Asset Turnover | 1.18 | 1.16 | 1.36 | 1.35 | 1.27 |
| Fixed Asset Turnover | 5.56 | 6.05 | 6.40 | 6.65 | 6.14 |
| Dividend Yield | 0.77% | 0.98% | 1.23% | 1.50% | 2.56% |
Evolution of Financial Ratios
From 2021 to 2025, NIKE, Inc.’s Return on Equity (ROE) declined from 44.86% to 24.36%, indicating a slowdown in profitability. The Current Ratio decreased from 2.72 to 2.21, reflecting a slight reduction in liquidity but remaining healthy. The Debt-to-Equity Ratio showed minor fluctuations, stabilizing around 0.83 in 2025, suggesting consistent leverage levels over the period.
Are the Financial Ratios Favorable?
In 2025, NIKE’s profitability ratios present a mixed picture: ROE at 24.36% and Return on Invested Capital (ROIC) at 11.57% are favorable, yet the net profit margin at 6.95% is neutral. Liquidity ratios are strong, with a Current Ratio of 2.21 and Quick Ratio of 1.5 deemed favorable. Leverage ratios such as Debt-to-Equity at 0.83 and Debt-to-Assets at 30.12% are neutral, while interest coverage of 12.81 times is favorable. Market valuation ratios like Price-to-Earnings (27.95) and Price-to-Book (6.81) are unfavorable, though overall, 57.14% of key ratios are favorable, supporting a generally positive financial profile.
Shareholder Return Policy
NIKE, Inc. has maintained a consistent dividend payout with a payout ratio around 71% in 2025 and a dividend yield near 2.56%. Dividend coverage by free cash flow remains adequate, supported by stable free cash flow per share and moderate capital expenditures. Share buybacks are also part of the capital return strategy.
This balanced approach of dividends and buybacks reflects a sustainable distribution policy aligned with long-term shareholder value. The relatively high payout ratio warrants monitoring, but overall, NIKE’s returns appear supported by solid profitability and cash flow generation.
Score analysis
The following radar chart presents an overview of NIKE, Inc.’s key financial scores to illustrate its current valuation and profitability metrics:
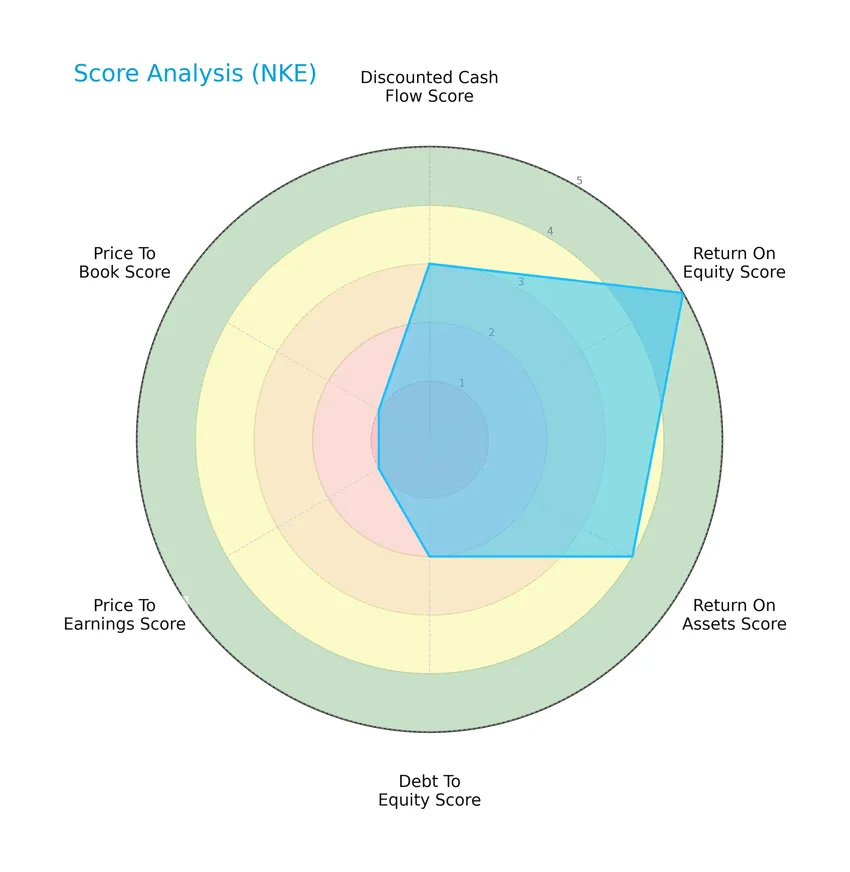
NIKE shows a very favorable return on equity score of 5 and a favorable return on assets score of 4, indicating strong profitability. However, valuation metrics such as price-to-earnings and price-to-book scores are very unfavorable at 1, while debt-to-equity is moderate at 2, reflecting mixed signals on pricing and leverage.
Analysis of the company’s bankruptcy risk
NIKE’s Altman Z-Score of 4.32 places it comfortably in the safe zone, indicating a low risk of bankruptcy and financial stability:

Is the company in good financial health?
The Piotroski Score diagram below highlights NIKE’s current financial health based on profitability, leverage, and efficiency criteria:

With a Piotroski Score of 6, NIKE is considered to have average financial health, reflecting moderate strength but room for improvement to reach a stronger investment profile.
Competitive Landscape & Sector Positioning
This section presents a detailed sector analysis of NIKE, Inc., covering strategic positioning, revenue by segment, key products, main competitors, and competitive advantages. I will also seek to determine whether NIKE maintains a competitive advantage over its industry peers.
Strategic Positioning
NIKE, Inc. maintains a concentrated product portfolio focused primarily on footwear ($31B in 2025) and apparel ($15B), complemented by smaller categories. Geographically, it is diversified across North America ($19.6B), EMEA ($12.3B), Greater China ($6.6B), and Asia Pacific/Latin America ($6.3B), balancing global market exposure.
Revenue by Segment
This pie chart illustrates NIKE, Inc.’s revenue distribution by segment for the fiscal year 2025, highlighting how different product categories contribute to the company’s overall sales.
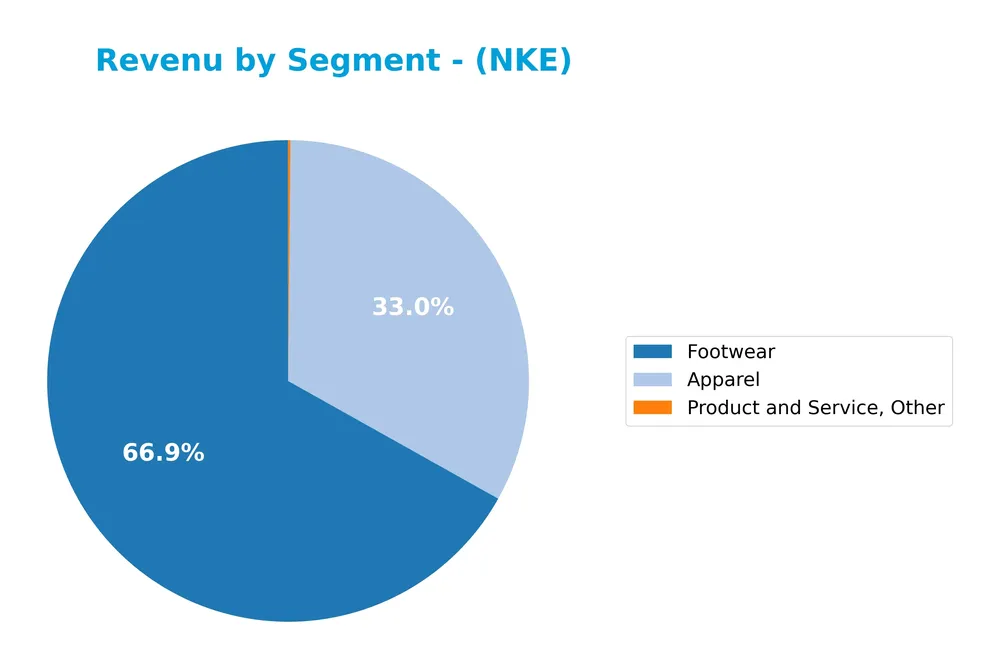
In 2025, Footwear remains the dominant revenue driver with $31B, followed by Apparel at $15B, and a smaller contribution from Product and Service, Other at $74M. Compared to 2024, both Footwear and Apparel segments experienced a noticeable slowdown, with Footwear declining from $35B and Apparel from nearly $16B, indicating some revenue concentration risk as growth decelerates in the primary categories.
Key Products & Brands
The table below summarizes NIKE, Inc.’s main products and brands along with their descriptions:
| Product | Description |
|---|---|
| Footwear | Athletic and casual footwear for men, women, and kids, including performance and lifestyle sneakers. |
| Apparel | Athletic and casual clothing marketed with licensed team and league logos, covering multiple sportswear categories. |
| Equipment | Performance equipment such as bags, socks, sport balls, eyewear, timepieces, digital devices, bats, gloves, and protective gear. |
| Other Products | Various plastic products sold to other manufacturers and additional accessories under NIKE-owned trademarks. |
| Brands | Includes NIKE, Jumpman, Converse, Chuck Taylor, All Star, One Star, Star Chevron, and Jack Purcell trademarks. |
NIKE, Inc. offers a diversified portfolio of footwear, apparel, and equipment, supported by strong brand names that span athletic performance and casual lifestyle markets worldwide.
Main Competitors
There are 2 competitors in total; the table below lists the top 10 leaders by market capitalization:
| Competitor | Market Cap. |
|---|---|
| NIKE, Inc. | 93.5B |
| Deckers Outdoor Corporation | 16.0B |
NIKE, Inc. ranks 1st among its competitors with a market cap slightly above the leader benchmark (relative market cap 1.03). It is positioned well above both the average market cap of the top 10 (54.8B) and the median market cap in its sector. The company has a significant market cap gap compared to its closest competitor below, Deckers Outdoor Corporation.
Comparisons with competitors
Check out how we compare the company to its competitors:
Does NKE have a competitive advantage?
NIKE, Inc. demonstrates a competitive advantage by creating value with an ROIC exceeding its WACC by 2.35%, indicating efficient use of invested capital despite a declining profitability trend. Its strong global brand presence and diversified product portfolio support this position.
Looking ahead, NIKE’s future opportunities lie in expanding markets such as Asia Pacific and Latin America, as well as innovation in athletic and casual footwear and apparel segments. The company’s ability to capitalize on digital platforms and licensing further enhances its growth potential.
SWOT Analysis
This analysis highlights NIKE, Inc.’s key internal and external factors to guide investment decisions effectively.
Strengths
- Strong global brand recognition
- Solid ROE at 24.36%
- Robust liquidity ratios (current 2.21, quick 1.5)
Weaknesses
- Recent revenue decline (-9.84% in 1 year)
- Falling profitability margins
- High valuation multiples (PE 27.95, PB 6.81)
Opportunities
- Expanding presence in Asia Pacific and Greater China
- Growth potential in digital and direct-to-consumer sales
- Innovation in performance and lifestyle products
Threats
- Intense competition in athletic apparel
- Economic downturn impacting discretionary spending
- Supply chain disruptions and raw material cost inflation
NIKE’s strengths in brand and financial stability contrast with recent profitability challenges and valuation concerns. Strategic focus on emerging markets and innovation is crucial to offset competitive and economic risks.
Stock Price Action Analysis
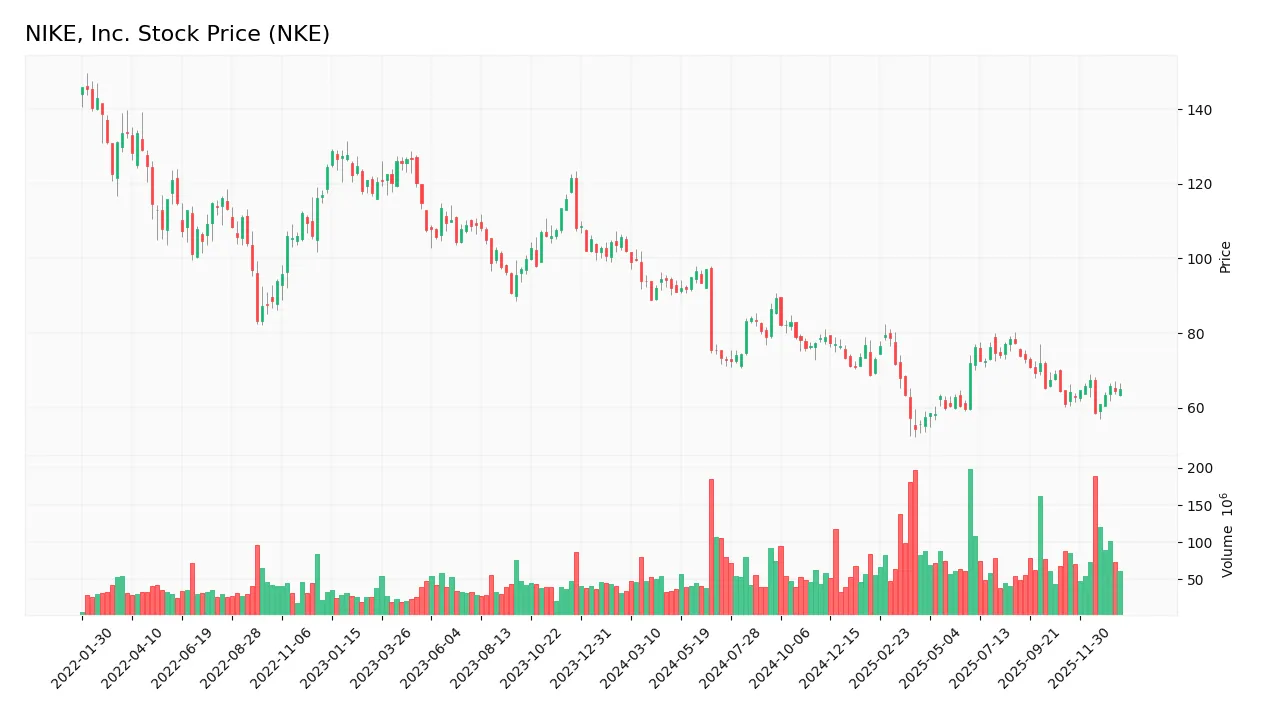
The weekly stock chart of NIKE, Inc. (NKE) over the past 100 weeks displays key price movements and volatility patterns:
Trend Analysis
Over the past 12 months, NIKE’s stock price decreased by 36.16%, indicating a bearish trend with acceleration. The price fluctuated between a high of 101.88 and a low of 54.39, showing significant volatility with a standard deviation of 11.39. Recent weeks from November 2025 to January 2026 show a modest 6.47% recovery, indicating a short-term bullish slope of 0.13.
Volume Analysis
Trading volumes have been increasing overall, with total volume reaching approximately 7.87B shares. Historically, sellers slightly dominated with 53.52% of total volume, but in the recent period from November 2025 to January 2026, buyer activity led with 60.11% dominance, suggesting growing bullish investor sentiment and higher market participation.
Target Prices
Analysts present a balanced target price consensus for NIKE, Inc.
| Target High | Target Low | Consensus |
|---|---|---|
| 110 | 62 | 75.35 |
The target prices indicate moderate optimism, with a wide range reflecting some uncertainty in NIKE’s near-term performance.

Don’t Let Luck Decide Your Entry Point
Optimize your entry points with our advanced ProRealTime indicators. You’ll get efficient buy signals with precise price targets for maximum performance. Start outperforming now!
Analyst & Consumer Opinions
This section reviews the grades and consumer feedback related to NIKE, Inc., providing an objective overview.
Stock Grades
Here is the latest overview of NIKE, Inc. stock grades from reputable financial analysts and institutions:
| Grading Company | Action | New Grade | Date |
|---|---|---|---|
| Keybanc | Maintain | Overweight | 2026-01-22 |
| Needham | Downgrade | Hold | 2026-01-08 |
| RBC Capital | Maintain | Outperform | 2026-01-06 |
| Needham | Maintain | Buy | 2025-12-19 |
| Bernstein | Maintain | Outperform | 2025-12-19 |
| Guggenheim | Maintain | Buy | 2025-12-19 |
| Telsey Advisory Group | Maintain | Market Perform | 2025-12-19 |
| Stifel | Maintain | Hold | 2025-12-19 |
| Wells Fargo | Maintain | Overweight | 2025-12-19 |
| Goldman Sachs | Maintain | Buy | 2025-12-19 |
The consensus among analysts remains generally positive with the majority rating NIKE as Buy or Overweight, though a recent downgrade to Hold by Needham indicates some caution. Overall, the grades suggest confidence in the stock’s performance with some variation in near-term outlooks.
Consumer Opinions
Consumer sentiment around NIKE, Inc. reflects a mix of strong brand loyalty and some concerns over product pricing and availability.
| Positive Reviews | Negative Reviews |
|---|---|
| “Excellent quality and stylish designs.” | “Prices have increased significantly lately.” |
| “Comfortable shoes that last long.” | “Occasional delays in shipping and delivery.” |
| “Wide variety of products for all sports.” | “Limited customization options compared to competitors.” |
Overall, NIKE enjoys praise for its product quality and style, but some consumers express frustration with rising prices and occasional service delays. These insights suggest a need for improved customer experience while maintaining product excellence.
Risk Analysis
Below is a concise overview of the key risks associated with investing in NIKE, Inc., highlighting their likelihood and potential impact:
| Category | Description | Probability | Impact |
|---|---|---|---|
| Market Volatility | NIKE’s beta of 1.284 indicates higher sensitivity to market swings, affecting stock price. | High | Medium |
| Valuation Risk | Elevated P/E (27.95) and P/B (6.81) ratios suggest potential overvaluation risk. | Medium | High |
| Competitive Risk | Intense competition in athletic apparel could pressure margins and market share. | Medium | Medium |
| Supply Chain | Disruptions in global supply chains may impact product availability and costs. | Medium | Medium |
| Economic Cycles | As a consumer cyclical company, NIKE is vulnerable to economic downturns reducing demand. | Medium | High |
| Debt Level | Moderate debt-to-equity ratio (0.83) implies manageable leverage but requires monitoring. | Low | Medium |
The most significant concerns are valuation risk, due to unfavorable P/E and P/B ratios, and economic sensitivity inherent to consumer cyclical firms like NIKE. Despite a strong Altman Z-score (4.32, safe zone) and favorable return on equity, investors should remain cautious of market volatility and competitive pressures impacting profitability.
Should You Buy NIKE, Inc.?
NIKE, Inc. appears to be generating strong value creation with a durable competitive moat, despite a declining return on invested capital trend. The company’s leverage profile is manageable, supported by a safe Altman Z-score, while the overall rating suggests a very favorable but cautiously moderate investment profile.
Strength & Efficiency Pillars
NIKE, Inc. demonstrates solid profitability with a return on equity of 24.36% and a net margin of 6.95%, reflecting efficient profit generation. The company is a clear value creator, as its return on invested capital stands at 11.57%, comfortably above its weighted average cost of capital of 9.22%. Financial health is reinforced by an Altman Z-Score of 4.32, placing NIKE firmly in the safe zone, and a Piotroski score of 6, indicating average financial strength. Favorable liquidity ratios, including a current ratio of 2.21, further underpin its operational stability.
Weaknesses and Drawbacks
Despite operational strengths, NIKE’s valuation metrics raise concerns. The price-to-earnings ratio is elevated at 27.95, suggesting a premium valuation that may limit upside potential. Similarly, a high price-to-book ratio of 6.81 points to an expensive stock relative to its book value. Leverage is moderate with a debt-to-equity ratio of 0.83, but the company faces bearish market pressure with a historic price decline of 36.16%. Although recent trading shows buyer dominance, the overall seller volume outpaces buyers, indicating potential short-term volatility and market skepticism.
Our Verdict about NIKE, Inc.
The company’s long-term fundamentals appear favorable, supported by value creation and financial resilience. Coupled with recent buyer dominance and a modest positive price trend, NIKE may appear attractive for investors seeking exposure. However, the elevated valuation and prior bearish trend suggest caution; despite underlying strength, NIKE could face near-term headwinds and might warrant a wait-and-see approach for a more opportune entry point.
Disclaimer: This content is for informational purposes only and does not constitute financial, investment, or other professional advice. Investing in financial markets involves a significant risk of loss, and past performance is not indicative of future results.
Additional Resources
- Nike: Too Little Room For Error (NYSE:NKE) – Seeking Alpha (Jan 22, 2026)
- Analyst Expectations For Nike’s Future – Benzinga (Jan 22, 2026)
- NIKE, Inc. Announces New Geography Leadership Appointments – Business Wire (Jan 20, 2026)
- Jennison Associates LLC Buys 3,518,666 Shares of NIKE, Inc. $NKE – MarketBeat (Jan 24, 2026)
- NIKE, Inc. (NKE): A Bull Case Theory – Yahoo Finance (Jan 20, 2026)
For more information about NIKE, Inc., please visit the official website: investors.nike.com