Home > Analyses > Utilities > NextEra Energy, Inc.
NextEra Energy transforms how millions power their lives by leading the clean energy revolution. It dominates the regulated electric sector with a vast portfolio of wind, solar, nuclear, and natural gas assets. Renowned for innovation and reliability, it operates one of North America’s largest renewable fleets and a sprawling transmission network. As the energy landscape shifts rapidly, I ask: does NextEra’s strong foundation still justify its premium valuation and ambitious growth prospects?

Table of contents
Business Model & Company Overview
NextEra Energy, Inc. stands as a giant in the regulated electric industry, founded in 1925 and headquartered in Juno Beach, Florida. It operates a vast ecosystem that integrates electricity generation, transmission, and distribution. The company serves roughly 11M people through 5.7M customer accounts, primarily along Florida’s east and lower west coasts. Its portfolio spans wind, solar, nuclear, coal, and natural gas facilities, reflecting a comprehensive commitment to energy provision across multiple sources.
NextEra’s revenue engine balances long-term contracted clean energy assets, battery storage, and electric transmission with wholesale and retail power sales. It commands 28,564 MW of net generating capacity and manages 77,000 circuit miles of transmission lines. Its strategic footprint covers key North American markets, reinforcing its competitive advantage. This scale and diversification create a formidable economic moat, positioning NextEra as a pivotal force shaping the future of clean energy infrastructure.
Financial Performance & Fundamental Metrics
I analyze NextEra Energy’s income statement, key financial ratios, and dividend payout policy to assess its operational efficiency and shareholder returns.
Income Statement
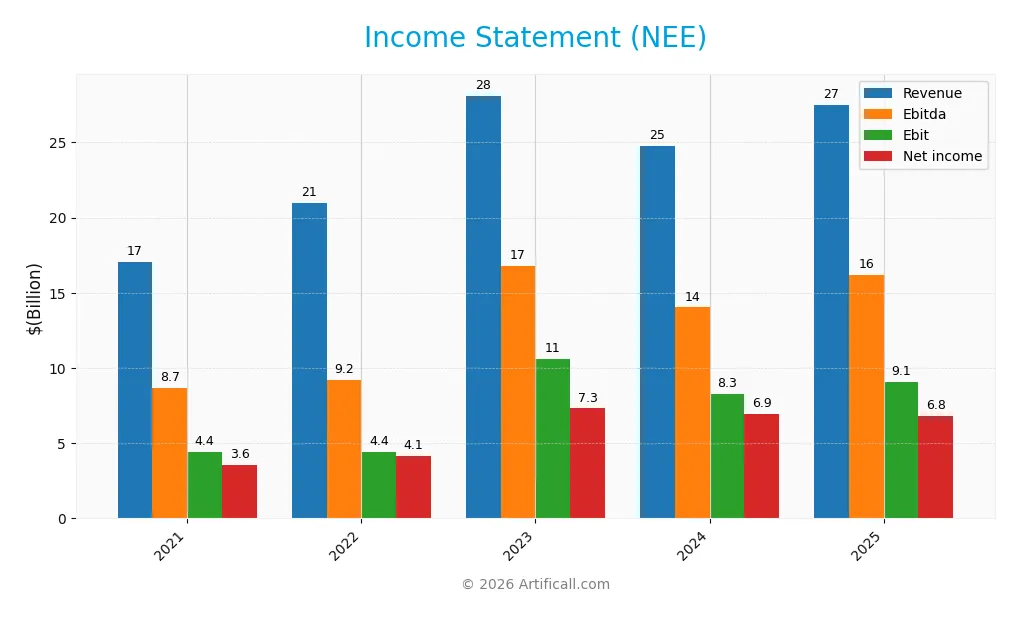
The table below summarizes NextEra Energy’s key income statement figures for the fiscal years 2021 through 2025. All values are in USD.
| 2021 | 2022 | 2023 | 2024 | 2025 | |
|---|---|---|---|---|---|
| Revenue | 17.1B | 20.96B | 28.11B | 24.75B | 27.48B |
| Cost of Revenue | 8.51B | 10.82B | 10.14B | 9.89B | 10.22B |
| Operating Expenses | 5.65B | 6.06B | 7.74B | 7.39B | 8.98B |
| Gross Profit | 8.56B | 10.14B | 17.98B | 14.87B | 17.26B |
| EBITDA | 8.66B | 9.21B | 16.76B | 14.03B | 16.17B |
| EBIT | 4.45B | 4.42B | 10.61B | 8.27B | 9.10B |
| Interest Expense | 1.27B | 585M | 3.32B | 2.24B | 4.57B |
| Net Income | 3.57B | 4.15B | 7.31B | 6.95B | 6.83B |
| EPS | 1.82 | 2.10 | 3.61 | 3.38 | 3.31 |
| Filing Date | 2022-02-18 | 2023-02-17 | 2024-02-16 | 2025-02-14 | 2026-02-13 |
Income Statement Evolution
NextEra Energy’s revenue rose 61% from 2021 to 2025, with a favorable 11% growth in 2025 alone. Net income nearly doubled over the period, driven by expanding net margins, which improved by 19%. Gross and EBIT margins remained strong, signaling efficient cost management despite a rise in operating expenses aligned with revenue growth.
Is the Income Statement Favorable?
In 2025, NextEra’s fundamentals show strength with a 62.8% gross margin and 33.1% EBIT margin, both favorable against industry standards. However, the 16.6% interest expense ratio and a 11.4% decline in net margin growth last year introduce caution. Overall, 71% of income statement metrics rate favorable, supporting a generally positive financial profile.
Financial Ratios
The following table summarizes key financial ratios for NextEra Energy, Inc. over the past five fiscal years, providing insight into profitability, leverage, liquidity, and market valuation:
| Ratios | 2021 | 2022 | 2023 | 2024 | 2025 |
|---|---|---|---|---|---|
| Net Margin | 21% | 20% | 26% | 28% | 25% |
| ROE | 9.6% | 11% | 15.4% | 13.9% | 12.5% |
| ROIC | 2.0% | 2.4% | 5.5% | 4.0% | 4.2% |
| P/E | 51.3 | 39.8 | 16.8 | 21.2 | 24.5 |
| P/B | 4.9 | 4.2 | 2.6 | 2.9 | 3.1 |
| Current Ratio | 0.53 | 0.51 | 0.55 | 0.47 | 0.60 |
| Quick Ratio | 0.44 | 0.43 | 0.47 | 0.38 | 0.49 |
| D/E | 1.47 | 1.66 | 1.54 | 1.64 | 1.75 |
| Debt-to-Assets | 39% | 41% | 41% | 43% | 45% |
| Interest Coverage | 2.3 | 7.0 | 3.1 | 3.3 | 1.8 |
| Asset Turnover | 0.12 | 0.13 | 0.16 | 0.13 | 0.13 |
| Fixed Asset Turnover | 0.17 | 0.19 | 0.22 | 0.18 | 0.18 |
| Dividend Yield | 1.7% | 2.0% | 3.1% | 2.9% | 2.8% |
Evolution of Financial Ratios
NextEra Energy’s Return on Equity (ROE) showed a gradual rise until 2024, peaking at 15.4%, then declined to 12.5% in 2025. The Current Ratio remained consistently below 1.0, indicating persistent liquidity constraints. Debt-to-Equity Ratio increased steadily, reaching 1.75 in 2025, reflecting higher leverage. Profitability margins showed mixed trends but remained relatively stable.
Are the Financial Ratios Favorable?
In 2025, profitability appears moderate with a net margin of 24.87%, rated favorable, while ROE at 12.5% is neutral. Liquidity ratios (Current and Quick) are unfavorable, below the 1.0 benchmark. Leverage is high with a 1.75 debt-to-equity ratio and weak interest coverage of 1.99. Market valuation metrics are mixed; price-to-earnings is neutral, but price-to-book is unfavorable. Overall, the financial ratios lean toward an unfavorable assessment.
Shareholder Return Policy
NextEra Energy, Inc. maintains a dividend payout ratio around 60-85% over recent years, with dividends per share rising from $1.54 in 2021 to $2.24 in 2025. The annual dividend yield stands near 2.8%, supported by consistent free cash flow coverage, though free cash flow per share turned negative in 2025, indicating potential distribution risks.
The company also engages in share buybacks, complementing its dividend policy. This balanced approach suggests a commitment to returning capital while investing in growth. However, the recent dip in free cash flow coverage warrants monitoring to ensure sustainable long-term shareholder value creation.
Score analysis
The following radar chart presents a snapshot of key financial metric scores for NextEra Energy, Inc.:
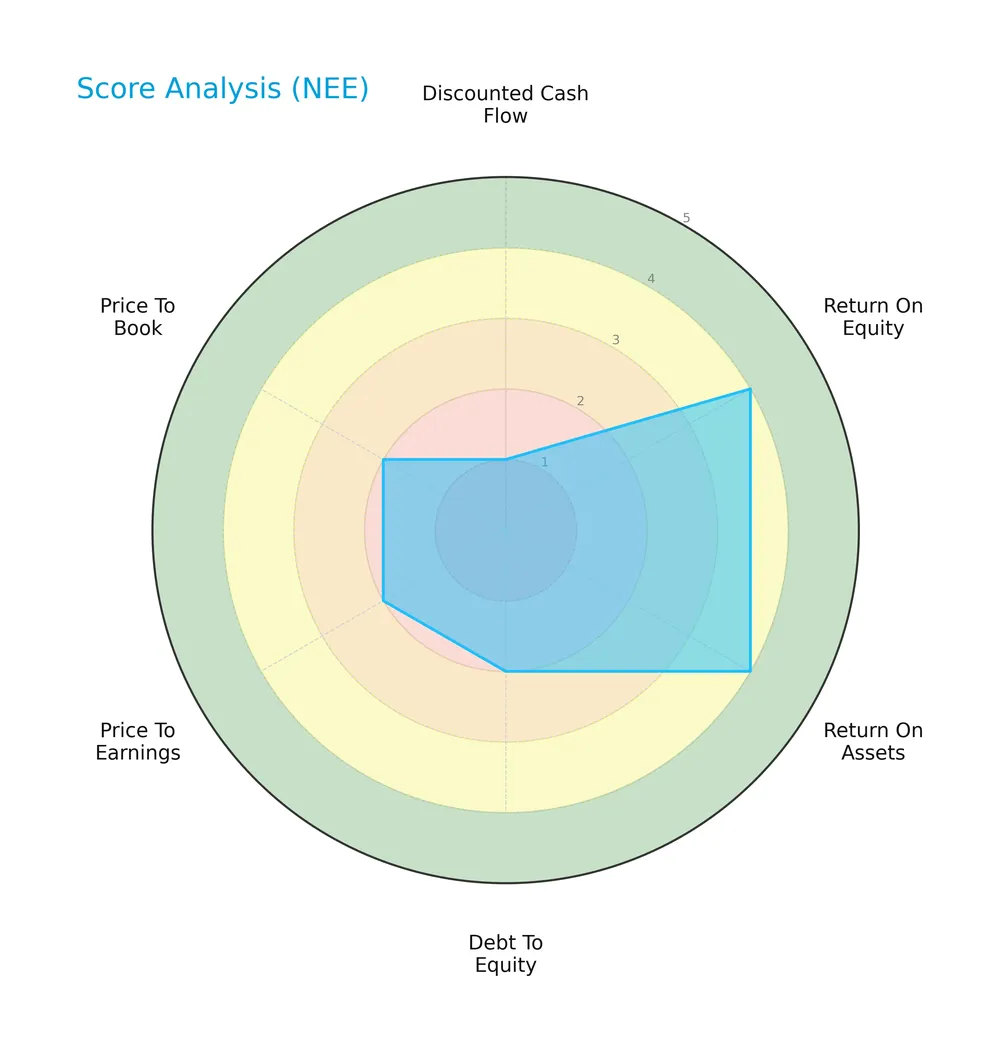
The company shows favorable returns on equity and assets with scores of 4 each. However, valuation and leverage metrics are weaker, with discounted cash flow scoring very unfavorable at 1, and price multiples and debt-to-equity rated unfavorable at 2. Overall, the score sits at a moderate level of 3.
Analysis of the company’s bankruptcy risk
NextEra Energy’s Altman Z-Score places it in the distress zone, signaling a higher risk of financial distress and potential bankruptcy:

Is the company in good financial health?
The Piotroski Score diagram illustrates the company’s financial strength based on nine critical criteria:

Scoring 7 out of 9, NextEra Energy demonstrates strong financial health, indicating solid profitability, leverage, liquidity, and operational efficiency. This suggests it maintains good fundamentals despite some valuation and leverage concerns.
Competitive Landscape & Sector Positioning
This sector analysis examines NextEra Energy, Inc.’s strategic positioning, revenue segments, key products, and competitors. I will evaluate whether the company holds a competitive advantage within the regulated electric utilities sector.
Strategic Positioning
NextEra Energy concentrates heavily on its Florida Power & Light segment, generating $18.7B in 2025, while its NextEra Energy Resources segment, focused on clean energy, contributes $8.8B. The company operates primarily in North American regulated electric markets, emphasizing renewable generation and transmission assets.
Revenue by Segment
This pie chart illustrates NextEra Energy, Inc.’s revenue distribution by segment for fiscal year 2025. It highlights the contribution of key business units in USD.
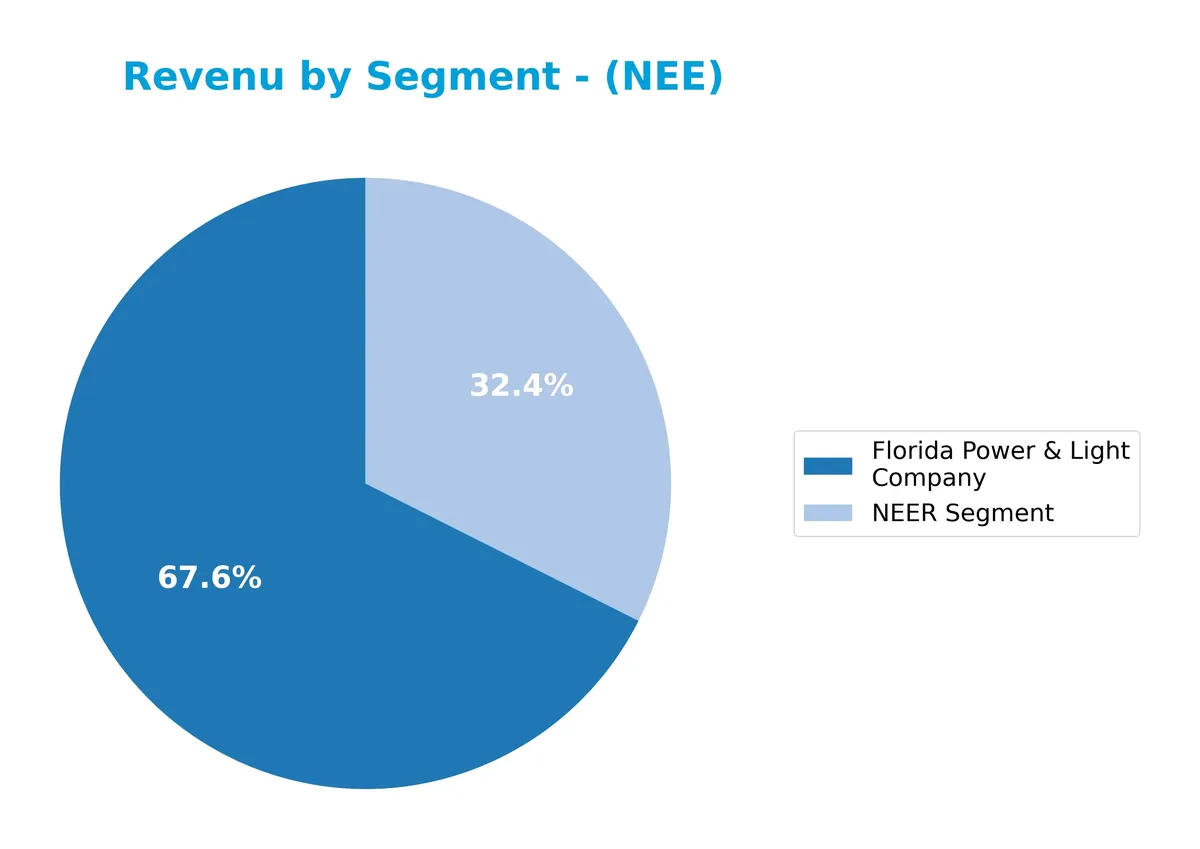
In 2025, Florida Power & Light Company leads revenue with $18.3B, followed by the NEER Segment at $8.8B. The data shows steady growth in both segments, reflecting NextEra’s focus on regulated utilities and renewable energy resources. The rising share of NEER signals accelerating investment in clean energy, while Florida Power & Light remains a stable cash generator, balancing growth and risk effectively.
Key Products & Brands
NextEra Energy’s main business segments and their core offerings are detailed below:
| Product | Description |
|---|---|
| Florida Power & Light Company | Regulated electric utility serving approximately 5.7M customer accounts in Florida. |
| NextEra Energy Resources (NEER Segment) | Develops and operates clean energy assets including wind, solar, nuclear, and battery storage. |
| Franchise And Gross Receipts Taxes | Tax revenues related to the company’s regulated utility operations. |
NextEra Energy’s revenues primarily derive from its regulated utility Florida Power & Light and its clean energy development via NextEra Energy Resources. The company also accounts for franchise and gross receipt taxes within its financials.
Main Competitors
NextEra Energy, Inc. operates among 23 competitors in the Regulated Electric industry; here are the top 10 leaders by market capitalization:
| Competitor | Market Cap. |
|---|---|
| NextEra Energy, Inc. | 168.6B |
| The Southern Company | 95.9B |
| Duke Energy Corporation | 91.3B |
| American Electric Power Company, Inc. | 61.9B |
| Dominion Energy, Inc. | 50.6B |
| Exelon Corporation | 44.4B |
| Xcel Energy Inc. | 44.2B |
| Entergy Corporation | 41.9B |
| Public Service Enterprise Group Incorporated | 40.4B |
| Consolidated Edison, Inc. | 36.1B |
NextEra Energy, Inc. ranks 1st among 23 competitors and has a market cap 16% above the next largest rival. It stands well above both the average market cap of the top 10 competitors (67.5B) and the sector median (34.0B). The substantial gap to the second-largest competitor highlights its dominant scale in this sector.
Comparisons with competitors
Check out how we compare the company to its competitors:
Does NEE have a competitive advantage?
NextEra Energy currently faces a slightly unfavorable moat, as its ROIC falls below its WACC, indicating value destruction despite growing profitability. This suggests challenges in efficiently deploying capital relative to its cost.
Looking ahead, the company leverages its diverse energy portfolio, including wind, solar, nuclear, and battery storage projects, to expand clean energy assets and transmission infrastructure. These initiatives target growing markets and support long-term contracted revenue streams.
SWOT Analysis
This analysis highlights NextEra Energy’s core competitive position and strategic challenges.
Strengths
- Leading renewable energy capacity
- Strong revenue and net income growth
- Solid dividend yield
Weaknesses
- Low current and quick ratios
- High interest expense
- ROIC below WACC indicates value destruction
Opportunities
- Expansion in clean energy projects
- Growth in battery storage solutions
- Increasing demand for transmission infrastructure
Threats
- Regulatory risks in utilities sector
- Rising debt levels
- Volatility in energy commodity prices
NextEra Energy combines robust growth and market leadership with financial weaknesses in liquidity and capital efficiency. Its strategy must balance aggressive clean energy expansion with prudent debt and cost management.
Stock Price Action Analysis
NextEra Energy, Inc. stock shows a clear pattern of price growth and volatility over the past year, highlighting key support and resistance levels:
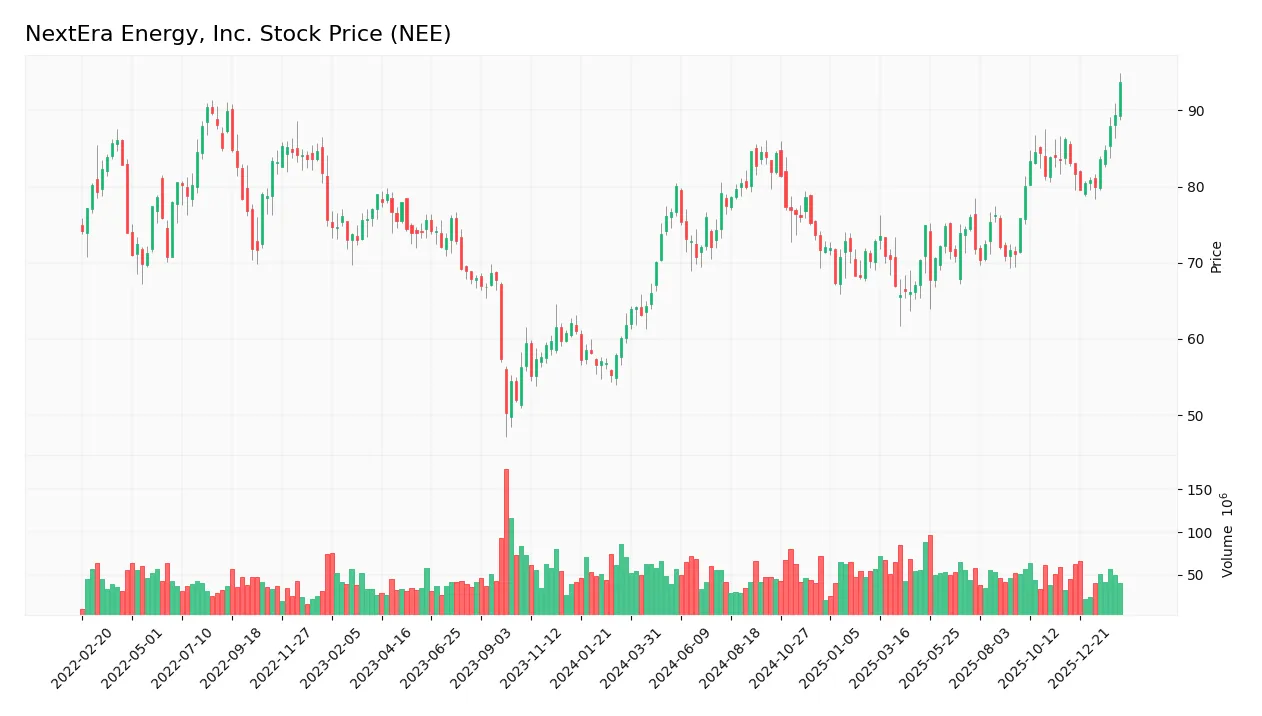
Trend Analysis
Over the past 12 months, NEE stock gained 51.83%, indicating a strong bullish trend with accelerating momentum. Price volatility remains moderate with a 6.45 standard deviation. The stock reached a high of 93.8 and a low of 61.78, confirming robust upward movement.
Volume Analysis
Trading volume totals 6.29B over the last three months, with buyer volume slightly dominant at 52.03%. Volume is decreasing, suggesting waning market participation despite a buyer-driven bias, which may indicate cautious optimism among investors.
Target Prices
Analysts set a clear target price consensus for NextEra Energy, Inc. reflecting steady growth expectations.
| Target Low | Target High | Consensus |
|---|---|---|
| 84 | 104 | 93.09 |
The target range between $84 and $104 indicates moderate optimism. The consensus near $93 suggests confidence in NextEra’s stable energy sector positioning.

Don’t Let Luck Decide Your Entry Point
Optimize your entry points with our advanced ProRealTime indicators. You’ll get efficient buy signals with precise price targets for maximum performance. Start outperforming now!
Analyst & Consumer Opinions
This section examines grades and consumer feedback to provide insights into NextEra Energy, Inc.’s market perception.
Stock Grades
Here is the latest verified grading summary for NextEra Energy, Inc. from major financial institutions:
| Grading Company | Action | New Grade | Date |
|---|---|---|---|
| Argus Research | Maintain | Buy | 2026-01-28 |
| Mizuho | Maintain | Neutral | 2026-01-28 |
| BMO Capital | Maintain | Outperform | 2026-01-27 |
| Wells Fargo | Maintain | Overweight | 2026-01-20 |
| Barclays | Maintain | Equal Weight | 2026-01-15 |
| Jefferies | Maintain | Hold | 2025-12-31 |
| UBS | Maintain | Buy | 2025-12-17 |
| JP Morgan | Maintain | Overweight | 2025-12-11 |
| BMO Capital | Maintain | Outperform | 2025-12-10 |
| UBS | Maintain | Buy | 2025-12-10 |
The grades reflect a consistent pattern of positive and neutral stances, with multiple “Buy,” “Outperform,” and “Overweight” ratings. There is no recent downgrade, indicating steady analyst confidence.
Consumer Opinions
NextEra Energy, Inc. consistently draws praise for its innovation and sustainability efforts, but some customers express concerns about service reliability.
| Positive Reviews | Negative Reviews |
|---|---|
| “Impressed by their commitment to clean energy and innovation.” | “Occasional outages disrupt service unexpectedly.” |
| “Customer service is responsive and helpful.” | “Billing errors have been frustrating to resolve.” |
| “App and online tools make account management easy.” | “Rates have increased more than expected over the past year.” |
Overall, consumers appreciate NextEra’s green energy leadership and user-friendly platforms. However, reliability issues and billing frustrations remain common pain points that could affect customer satisfaction.
Risk Analysis
Below is a summary table of NextEra Energy’s key risks, highlighting their likelihood and potential impact:
| Category | Description | Probability | Impact |
|---|---|---|---|
| Financial Health | Altman Z-Score at 1.25 signals distress zone, risk of default | High | High |
| Liquidity | Current ratio 0.6 and quick ratio 0.49 indicate weak liquidity | Medium | Medium |
| Leverage | Debt-to-equity of 1.75 and interest coverage of 1.99 risk debt service problems | Medium | High |
| Valuation | Price-to-book 3.07 and PE 24.54 suggest overvaluation risk | Medium | Medium |
| Operational | Low asset turnover of 0.13 reflects potential inefficiency | Low | Low |
The most concerning risk is financial distress, as the Altman Z-Score places NextEra in the distress zone. Coupled with weak liquidity and high leverage, this elevates default risk despite strong operational scale. Investors should watch debt servicing closely amid market volatility.
Should You Buy NextEra Energy, Inc.?
NextEra Energy appears to be improving profitability with growing ROIC, yet it is shedding value relative to its cost of capital. Despite a manageable but unfavorable leverage profile, the company suggests a slightly unfavorable moat and a moderate B- rating overall.
Strength & Efficiency Pillars
NextEra Energy, Inc. exhibits robust operational profitability with a net margin of 24.87% and an EBIT margin of 33.13%. Its gross margin stands impressively at 62.8%, reflecting strong cost management. While return on equity is moderate at 12.51%, the return on invested capital (ROIC) at 4.23% trails behind the weighted average cost of capital (WACC) of 6.41%, indicating the company currently destroys value despite improving profitability trends.
Weaknesses and Drawbacks
The company is in financial distress, as evidenced by an Altman Z-Score of 1.25, signaling a high bankruptcy risk. Leverage is elevated with a debt-to-equity ratio of 1.75 and weak liquidity shown by a current ratio of 0.6. Valuation metrics are stretched, with a price-to-book ratio of 3.07 and a price-to-earnings ratio near market average at 24.54. Interest coverage of 1.99 raises concerns about debt servicing capacity under stress.
Our Final Verdict about NextEra Energy, Inc.
Despite operational strengths, NextEra’s solvency risk marked by the distress-zone Z-Score makes its investment profile highly speculative. The company’s improving profitability may appear encouraging, but the elevated leverage and liquidity weaknesses suggest it remains too risky for conservative capital. Investors should approach cautiously until financial health visibly improves.
Disclaimer: This content is for informational purposes only and does not constitute financial, investment, or other professional advice. Investing in financial markets involves a significant risk of loss, and past performance is not indicative of future results.
Additional Resources
- NEE Stock Outpaces Industry in a Month: Time to Buy, Hold or Sell? – The Globe and Mail (Feb 17, 2026)
- NextEra Energy Transmission and Exelon Welcome PJM Board Vote to Advance Grid Reliability Project – NextEra Energy Newsroom (Feb 13, 2026)
- Cibc World Market Inc. Grows Stake in NextEra Energy, Inc. $NEE – MarketBeat (Feb 12, 2026)
- Xcel Energy and NextEra Energy agree to deliver generation solutions and enable large load across Xcel Energy’s service territories – Xcel Energy Newsroom (Feb 04, 2026)
- NextEra Energy board declares quarterly dividend – PR Newswire (Feb 13, 2026)
For more information about NextEra Energy, Inc., please visit the official website: nexteraenergy.com