Home > Analyses > Energy > NexGen Energy Ltd.
NexGen Energy Ltd. drives the future of clean power by unlocking vast uranium resources critical for nuclear energy. Its flagship Rook I project dominates the Athabasca Basin, renowned for uranium’s highest grades worldwide. The company blends cutting-edge exploration with disciplined development, positioning itself as a pivotal energy sector innovator. As global demand for low-carbon energy intensifies, I ask: does NexGen’s asset quality and growth strategy still justify its current valuation and investor optimism?
Table of contents
Business Model & Company Overview
NexGen Energy Ltd. is a Canadian exploration and development stage company headquartered in Vancouver. Founded with a focus on uranium, it commands a dominant position through its core asset, the Rook I project. This 35,065-hectare contiguous mineral claim in Saskatchewan’s Athabasca Basin forms the backbone of its uranium exploration ecosystem, positioning NexGen as a critical player in the energy sector.
The company’s revenue engine centers on advancing uranium properties, with value derived primarily from mineral exploration rather than immediate production. While its operations are concentrated in Canada, NexGen’s strategic role in global uranium supply chains creates potential leverage in the Americas, Europe, and Asia. Its economic moat lies in the scale and quality of its resource base, shaping the future of nuclear energy sourcing.
Financial Performance & Fundamental Metrics
I analyze NexGen Energy Ltd.’s income statement, key financial ratios, and dividend payout policy to assess its profitability, efficiency, and shareholder returns.
Income Statement
The table below summarizes NexGen Energy Ltd.’s key income statement figures for fiscal years 2021 through 2025, all values in CAD.

| 2021 | 2022 | 2023 | 2024 | 2025 | |
|---|---|---|---|---|---|
| Revenue | 0 | 0 | 0 | 0 | 0 |
| Cost of Revenue | 0 | 0 | 0 | 0 | 2.2M |
| Operating Expenses | 51.2M | 59.8M | 84.7M | 75.9M | 87.6M |
| Gross Profit | 0 | 0 | 0 | 0 | -2.2M |
| EBITDA | -119.7M | -57.1M | 76.8M | -76.8M | -87.6M |
| EBIT | -121.8M | -58.9M | 75.0M | -78.2M | -89.8M |
| Interest Expense | 4.0M | 2.4M | 6.3M | 32.6M | 46.7M |
| Net Income | -119.1M | -56.6M | 80.8M | -77.6M | -309.4M |
| EPS | -0.26 | -0.12 | 0.16 | -0.14 | -0.52 |
| Filing Date | 2022-02-25 | 2023-02-24 | 2024-03-07 | 2025-03-04 | 2026-03-04 |
Income Statement Evolution
NexGen Energy Ltd. reported zero revenue from 2021 through 2025, with net income declining sharply over this period. The company’s net losses deepened from CAD -119M in 2021 to CAD -309M in 2025. Margins remained unfavorable, with gross and EBIT margins consistently at zero, reflecting no revenue generation and escalating operating expenses.
Is the Income Statement Favorable?
The 2025 income statement shows a net loss of CAD -309M on zero revenue, driven by high operating expenses of CAD 88M and significant net interest expense of CAD 29M. The fundamentals remain unfavorable, with negative EBIT and net margins. Despite a favorable interest expense ratio, deteriorating earnings per share and absence of revenue growth present substantial risks.
Financial Ratios
The table below presents key financial ratios for NexGen Energy Ltd. from 2021 to 2025, illustrating the company’s evolving financial condition:
| Ratios | 2021 | 2022 | 2023 | 2024 | 2025 |
|---|---|---|---|---|---|
| Net Margin | 0 | 0 | 0 | 0 | 0 |
| ROE | -27% | -14% | 10% | -7% | -17% |
| ROIC | -9% | -11% | -9% | -4% | -4% |
| P/E | -21.3 | -50.0 | 57.9 | -67.8 | -24.0 |
| P/B | 5.85 | 6.77 | 5.71 | 4.46 | 4.06 |
| Current Ratio | 26.0 | 1.49 | 1.65 | 1.03 | 1.82 |
| Quick Ratio | 26.0 | 1.49 | 1.65 | 1.03 | 1.82 |
| D/E | 0.17 | 0.39 | 0.39 | 0.39 | 0.32 |
| Debt-to-Assets | 14% | 29% | 32% | 28% | 24% |
| Interest Coverage | -12.8 | -25.1 | -13.6 | -2.3 | -1.9 |
| Asset Turnover | 0 | 0 | 0 | 0 | 0 |
| Fixed Asset Turnover | 0 | 0 | 0 | 0 | 0 |
| Dividend Yield | 0 | 0 | 0 | 0 | 0 |
Evolution of Financial Ratios
NexGen Energy’s current ratio improved steadily from 1.03 in 2024 to 1.82 in 2025, indicating better short-term liquidity. Debt-to-equity ratio decreased from 0.39 to 0.32, reflecting reduced leverage. Return on equity worsened from -6.6% in 2024 to -16.9% in 2025, showing declining profitability and operational challenges over the period.
Are the Financial Ratios Fovorable?
The 2025 ratios reveal mixed signals. Liquidity ratios like current and quick ratios at 1.82 are favorable, supporting near-term obligations. Leverage metrics, including debt-to-equity at 0.32 and debt-to-assets at 23.7%, remain manageable. However, profitability ratios such as ROE at -16.9% and net margin at 0% are unfavorable. Negative interest coverage of -1.92 signals financial risk. Overall, unfavorable ratios dominate at 64%, indicating caution.
Shareholder Return Policy
NexGen Energy Ltd. does not pay dividends, reflecting its ongoing net losses and negative free cash flow. The company prioritizes reinvestment and operational funding, showing no dividend payout or buyback activity in recent years.
This approach aligns with a typical growth-phase strategy focused on capital allocation to development rather than immediate shareholder distributions. While this may support long-term value, investors should monitor cash flow trends and capital efficiency for sustainability.
Score analysis
The following radar chart illustrates key financial scores relevant to NexGen Energy Ltd.’s valuation and stability:

NexGen Energy’s scores reveal significant weaknesses in profitability and valuation metrics. Return on equity, assets, price-to-earnings, and price-to-book scores all rank very unfavorable. Debt-to-equity shows moderate risk, while discounted cash flow remains unfavorable.
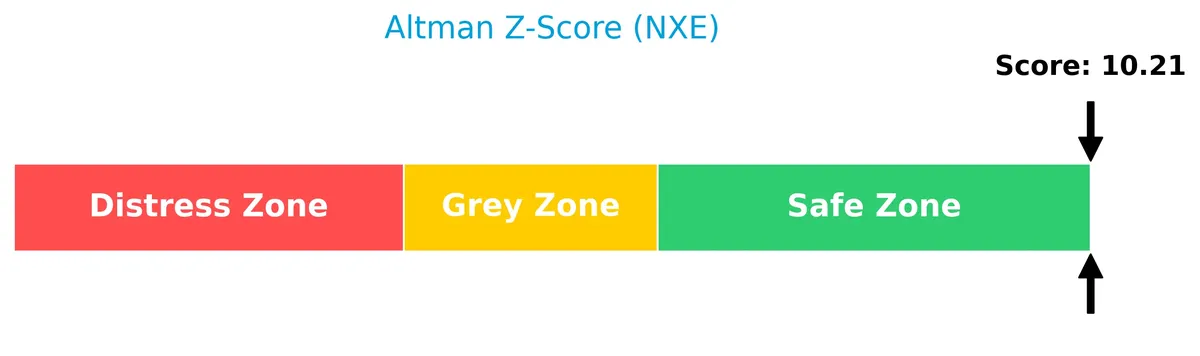
Analysis of the company’s bankruptcy risk
NexGen Energy’s Altman Z-Score places it firmly in the safe zone, indicating a very low risk of bankruptcy:
Is the company in good financial health?
This Piotroski diagram highlights NexGen Energy Ltd.’s weak financial health score:

With a Piotroski score of 2, the company falls into the very weak category, signaling poor financial strength despite a stable bankruptcy risk.
Competitive Landscape & Sector Positioning
This analysis explores NexGen Energy Ltd.’s strategic positioning within the uranium sector and its revenue segments. I will assess the company’s key products, main competitors, and competitive advantages. The goal is to determine whether NexGen holds a sustainable advantage over its peers in this market.
Strategic Positioning
NexGen Energy Ltd. concentrates its portfolio on uranium exploration and development, focusing solely on the Rook I project in Canada’s Athabasca Basin. This geographic and product concentration reflects a targeted strategy without diversification across minerals or regions.
Key Products & Brands
The table below outlines NexGen Energy Ltd.’s core products and brand focus in uranium exploration and development:
| Product | Description |
|---|---|
| Rook I Project | Principal uranium asset with 32 contiguous mineral claims covering 35,065 hectares in Canada. |
NexGen Energy Ltd. specializes exclusively in uranium exploration, centering its operations on the Rook I project in Saskatchewan’s Athabasca Basin. This project defines the company’s asset base and development strategy.
Main Competitors
There are 10 main competitors in the uranium industry, with the table below listing the top 10 leaders by market capitalization:
| Competitor | Market Cap. |
|---|---|
| Cameco Corporation | 39.8B |
| NexGen Energy Ltd. | 6.0B |
| Uranium Energy Corp. | 5.6B |
| Centrus Energy Corp. | 4.2B |
| Energy Fuels Inc. | 3.5B |
| Denison Mines Corp. | 2.4B |
| Ur-Energy Inc. | 507M |
| IsoEnergy Ltd. | 499M |
| Uranium Royalty Corp. | 471M |
| enCore Energy Corp. | 464M |
NexGen Energy Ltd. ranks second among its competitors with a market cap at 20.15% of the leader, Cameco Corporation. The company stands above both the average market cap of the top 10 (6.35B) and the sector median (2.92B). It enjoys a significant gap of +396.4% over its closest competitor above, underscoring a strong relative position.
Does NXE have a competitive advantage?
NexGen Energy Ltd. currently lacks a competitive advantage, as it is shedding value with a ROIC below its WACC and unfavorable income metrics. Its financial performance shows significant challenges in profitability and growth.
However, the company’s ROIC trend is improving, indicating increasing profitability. Future opportunities may arise from developing its Rook I uranium project in Canada’s Athabasca Basin, potentially expanding its market presence.
Comparisons with competitors
Check out how we compare the company to its competitors:
SWOT Analysis
This SWOT analysis highlights NexGen Energy Ltd.’s core strategic factors to guide investment decisions.
Strengths
- Large land position in Athabasca Basin
- Low debt levels with 0.32 D/E
- Strong current and quick ratios at 1.82
Weaknesses
- Negative ROIC at -3.7% indicating value destruction
- No revenue or profit generation yet
- Weak profitability and margins with zero net margin
Opportunities
- Growing uranium demand amid clean energy trends
- Potential value uplift from improving ROIC trend
- Exploration upside in a uranium-rich region
Threats
- Volatile uranium prices impacting project economics
- High beta at 1.68 signaling market risk
- Regulatory and environmental uncertainties in mining
NexGen’s strengths lie in its strategic assets and financial prudence. However, ongoing losses and lack of revenue pose clear risks. The company’s improving ROIC trend and uranium sector tailwinds offer growth potential, but investors must weigh cyclical and regulatory threats carefully.
Stock Price Action Analysis
The following weekly stock chart illustrates NexGen Energy Ltd.’s price movements and volatility over the last 12 months:
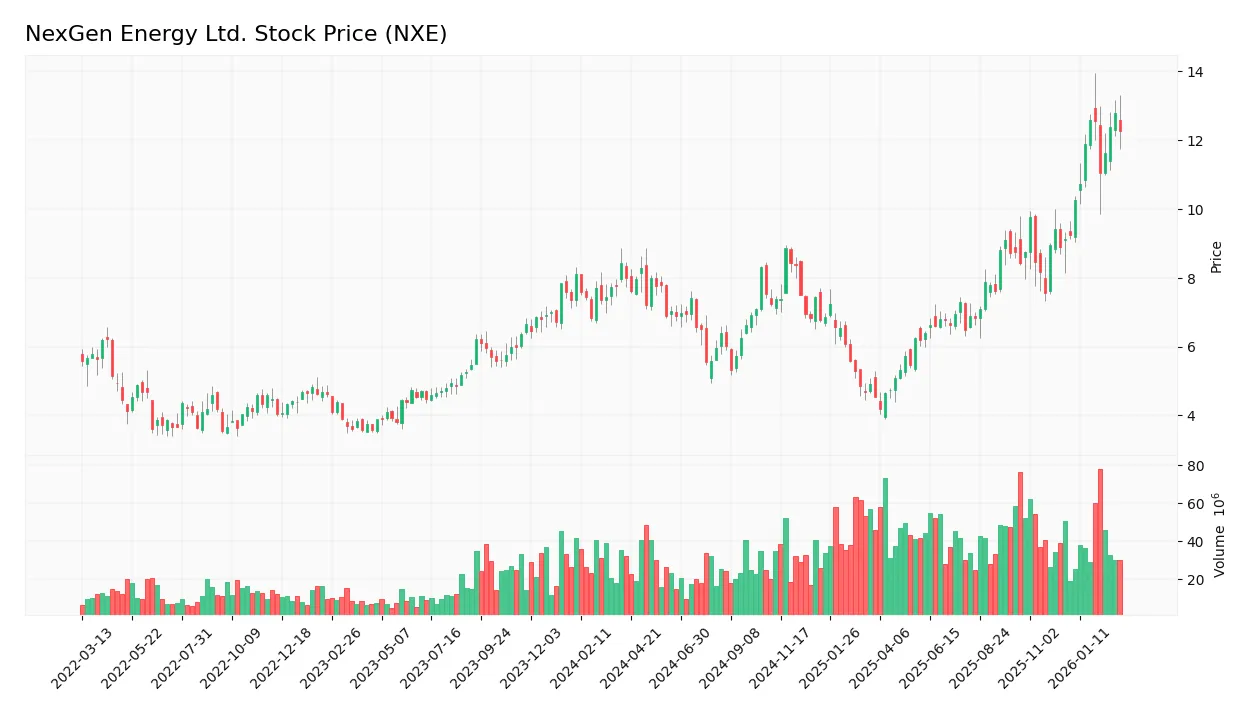
Trend Analysis
Over the past 12 months, NXE’s stock price increased by 53.0%, marking a clear bullish trend with acceleration. The price ranged from a low of 4.18 to a high of 12.78, with volatility moderate at a 1.88 standard deviation. Recent three-month gains of 34.23% confirm sustained momentum.
Volume Analysis
Trading volume is increasing, with buyer-driven activity dominating the last three months. Buyers accounted for 64.75% of volume, signaling strong investor demand and growing market participation. This buyer dominance supports the ongoing upward price trend and positive sentiment.
Target Prices
No verified target price data is available from recognized analysts for NexGen Energy Ltd. Market sentiment remains mixed amid sector volatility.
Analyst & Consumer Opinions
This section examines NexGen Energy Ltd.’s analyst ratings and consumer feedback to gauge market sentiment and reputation.

Don’t Let Luck Decide Your Entry Point
Optimize your entry points with our advanced ProRealTime indicators. You’ll get efficient buy signals with precise price targets for maximum performance. Start outperforming now!
Stock Grades
The current consensus ratings for NexGen Energy Ltd. reflect a clear positive sentiment among analysts: No verified stock grades were available from recognized analysts beyond a general “Buy” consensus.
Consumer Opinions
NexGen Energy Ltd. generates a mix of enthusiasm and caution among its consumer base, reflecting its position in the volatile energy sector.
| Positive Reviews | Negative Reviews |
|---|---|
| Strong commitment to sustainable uranium mining | Concerns over fluctuating uranium prices |
| Transparent communication on project developments | Delays in project timelines impacting confidence |
| Innovative extraction technology gaining praise | Limited market presence compared to larger peers |
Overall, consumers appreciate NexGen’s sustainable and innovative approach but worry about market volatility and execution risks. These concerns underscore the sector’s cyclical nature and the company’s growth-stage challenges.
Risk Analysis
Below is a summary table highlighting key risks NexGen Energy Ltd. faces in 2026, focusing on probability and impact:
| Category | Description | Probability | Impact |
|---|---|---|---|
| Financial Health | Negative ROE and ROIC with interest coverage below -1.9 | High | High |
| Market Volatility | Beta of 1.68 exposes stock to broad energy sector swings | Medium | Medium |
| Operational Risk | Exploration-stage asset with zero asset turnover and margins | High | High |
| Valuation Risk | High price-to-book ratio (4.06) despite weak profitability | High | Medium |
| Dividend Policy | No dividend yield, limiting income appeal | Medium | Low |
NexGen’s greatest concerns lie in its weak profitability and negative returns relative to capital costs. Despite a strong Altman Z-Score indicating solvency, the company’s very weak Piotroski score signals fragile financial strength. The uranium sector’s cyclical nature combined with market volatility heightens investment risk. I advise caution given these structural financial challenges.
Should You Buy NexGen Energy Ltd.?
NexGen Energy Ltd. appears to be shedding value with a slightly unfavorable moat despite a growing ROIC trend. Its leverage profile is moderate, while profitability remains weak. The overall rating could be seen as a C-, suggesting cautious analytical interpretation.
Strength & Efficiency Pillars
NexGen Energy Ltd. posts concerning profitability metrics, with a negative ROIC of -3.7% falling short of its 11.39% WACC, indicating value destruction rather than creation. However, the company remains financially solvent with an Altman Z-Score of 10.21, placing it safely away from bankruptcy risk. Favorable leverage ratios—debt-to-equity at 0.32 and a current ratio of 1.82—underscore solid liquidity and moderate debt levels. Interest expense remains manageable, signaling some operational discipline despite weak margins.
Weaknesses and Drawbacks
The company faces severe profitability challenges, reflected in a zero net margin and negative ROE at -16.9%. Its P/B ratio of 4.06 signals an expensive valuation relative to book value, while a negative interest coverage ratio of -1.92 raises alarms about its ability to service debt from earnings. Earnings per share have plunged drastically by 271.43% over the past year, amplifying risk. These factors, combined with an overall unfavorable income and ratio profile, weigh heavily against NexGen’s financial health.
Our Final Verdict about NexGen Energy Ltd.
NexGen Energy Ltd. presents a complex profile. Despite its safe solvency status and solid liquidity, persistent profitability erosion and expensive valuation metrics suggest caution. The bullish stock trend and buyer dominance might indicate speculative interest, but fundamental weaknesses could undermine long-term stability. This profile might appear attractive only to risk-tolerant investors seeking turnaround potential, while conservative capital should remain cautious.
Disclaimer: This content is for informational purposes only and does not constitute financial, investment, or other professional advice. Investing in financial markets involves a significant risk of loss, and past performance is not indicative of future results.
Additional Resources
- Rook I uranium mine cleared to build at NexGen (TSX: NXE) – Stock Titan (Mar 05, 2026)
- NexGen Energy Ltd. (NYSE:NXE) Q4 2025 Earnings Call Transcript – Insider Monkey (Mar 05, 2026)
- UBS initiates NexGen Energy stock with buy rating on project quality – Investing.com (Mar 05, 2026)
- NexGen Energy obtains final federal approval for Rook I Uranium Project, Saskatchewan – Resource World (Mar 05, 2026)
- NexGen Energy (TSE:NXE) Trading Up 3.3% – Here’s What Happened – MarketBeat (Mar 05, 2026)
For more information about NexGen Energy Ltd., please visit the official website: nexgenenergy.ca