Home > Analyses > Basic Materials > Newmont Corporation
Newmont Corporation shapes the global gold supply, influencing economies and everyday wealth preservation. It commands the gold mining industry with vast reserves and a diversified asset base across multiple continents. Renowned for operational excellence and sustainable practices, Newmont sets benchmarks in innovation and environmental stewardship. As market dynamics evolve, I question if Newmont’s solid fundamentals and strategic positioning continue to support its premium valuation and future growth prospects.

Table of contents
Business Model & Company Overview
Newmont Corporation, founded in 1916 and headquartered in Denver, Colorado, stands as a global leader in the gold mining industry. With a workforce of 22,200 and extensive operations across the Americas, Australia, and Africa, it orchestrates a core business centered on gold production and exploration. Its portfolio also includes copper, silver, zinc, and lead, creating a diversified ecosystem of precious and base metals that drives its strategic mission.
The company’s revenue engine balances mining of proven gold reserves—92.8M ounces as of 2021—with exploration activities spanning 62,800 sq km of land. Newmont’s presence in key global markets such as the United States, Peru, and Ghana supports steady cash flow through commodity cycles. Its economic moat lies in vast reserves and geographic diversification, positioning it to influence the metals sector’s future trajectory.
Financial Performance & Fundamental Metrics
I analyze Newmont Corporation’s income statement, key financial ratios, and dividend payout policy to assess its core financial health and shareholder returns.
Income Statement
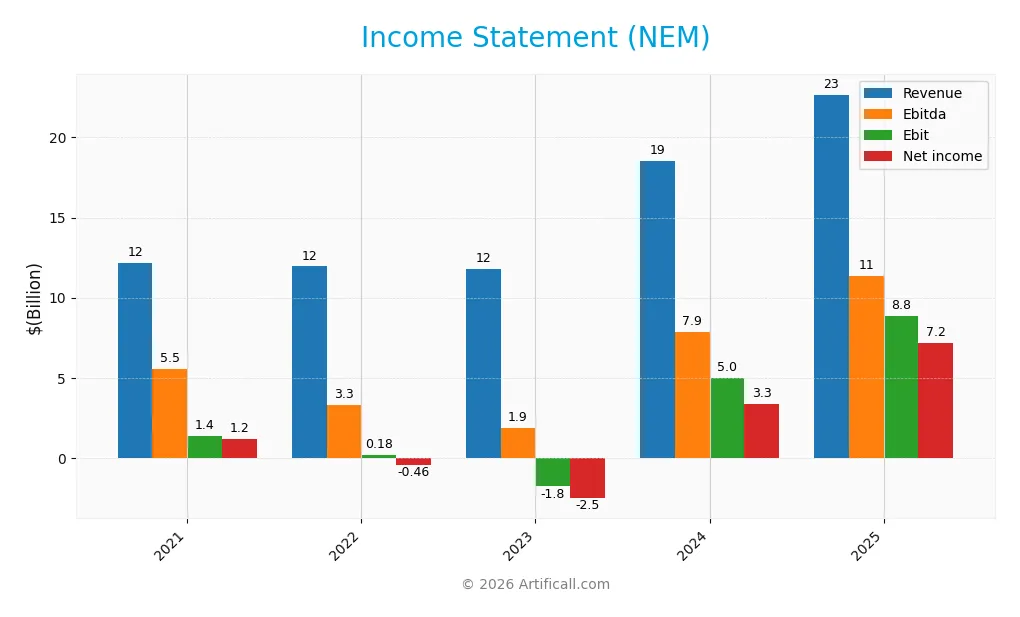
Below is Newmont Corporation’s income statement summary for fiscal years 2021 through 2025, expressed in USD.
| 2021 | 2022 | 2023 | 2024 | 2025 | |
|---|---|---|---|---|---|
| Revenue | 12.19B | 11.95B | 11.78B | 18.56B | 22.67B |
| Cost of Revenue | 9.81B | 9.81B | 10.61B | 12.13B | 8.08B |
| Operating Expenses | 460M | 523M | 520M | 676M | 791M |
| Gross Profit | 2.38B | 2.14B | 1.17B | 6.42B | 14.58B |
| EBITDA | 5.54B | 3.28B | 1.86B | 7.87B | 11.37B |
| EBIT | 1.37B | 176M | -1.78B | 4.96B | 8.85B |
| Interest Expense | 266M | 227M | 248M | 385M | 229M |
| Net Income | 1.17B | -459M | -2.52B | 3.35B | 7.17B |
| EPS | 1.46 | -0.58 | -3.00 | 2.86 | 6.41 |
| Filing Date | 2022-02-24 | 2023-02-23 | 2024-02-29 | 2025-02-21 | 2026-02-19 |
Income Statement Evolution
Newmont Corporation’s revenue jumped 22% in 2025, continuing strong growth since 2021’s $12.2B to $22.7B. Net income surged over fivefold to $7.2B. Gross margin improved dramatically, doubling to 64%. EBIT margin expanded to 39%, reflecting better cost control and operational leverage. Net margin also climbed significantly, underscoring improved profitability and efficiency.
Is the Income Statement Favorable?
The 2025 income statement shows robust fundamentals. Revenue growth is healthy at 22%, with gross profit surging 127%, signaling efficient cost management. EBIT of $8.8B and a 39% margin highlight strong core earnings. Interest expense remains low at 1% of revenue, reducing financial risk. Net margin at 31.6% and EPS growth of 124% confirm substantial shareholder value creation. Overall, the income statement is clearly favorable.
Financial Ratios
The table below summarizes key financial ratios for Newmont Corporation (NEM) over recent fiscal years, providing a clear view of profitability, liquidity, valuation, and leverage metrics:
| Ratios | 2021 | 2022 | 2023 | 2024 | 2025 |
|---|---|---|---|---|---|
| Net Margin | 9.57% | -3.84% | -21.41% | 18.04% | 31.62% |
| ROE | 5.29% | -2.37% | -8.69% | 11.19% | 21.16% |
| ROIC | 0.69% | -32.40% | 1.26% | 8.11% | 21.46% |
| P/E | 42.50 | -81.65 | -13.81 | 12.74 | 15.41 |
| P/B | 2.25 | 1.94 | 1.20 | 1.43 | 3.26 |
| Current Ratio | 2.90 | 2.23 | 1.25 | 1.63 | 1.72 |
| Quick Ratio | 2.23 | 1.63 | 0.81 | 1.34 | 1.46 |
| D/E | 0.29 | 0.32 | 0.33 | 0.30 | 0.01 |
| Debt-to-Assets | 15.54% | 15.93% | 17.00% | 15.92% | 0.83% |
| Interest Coverage | 7.20 | 7.14 | 2.62 | 14.93 | 60.23 |
| Asset Turnover | 0.30 | 0.31 | 0.21 | 0.33 | 0.40 |
| Fixed Asset Turnover | 0.51 | 0.50 | 0.31 | 0.55 | 0.68 |
| Dividend Yield | 3.55% | 4.66% | 4.07% | 2.68% | 1.00% |
Evolution of Financial Ratios
From 2021 to 2025, Newmont Corporation’s Return on Equity (ROE) improved significantly, rising from 5.3% to 21.2%. The Current Ratio showed steady growth from 2.9 to 1.72, indicating maintained liquidity despite a downward trend. Meanwhile, the Debt-to-Equity Ratio dropped sharply from 0.29 to 0.01, reflecting a substantial deleveraging and improved financial stability.
Are the Financial Ratios Favorable?
In 2025, profitability metrics like net margin (31.6%) and ROE (21.2%) are favorable, surpassing typical industry benchmarks. Liquidity ratios, including current (1.72) and quick (1.46), support operational flexibility. Leverage remains minimal with a debt-to-equity of 0.01. However, asset turnover (0.4) and fixed asset turnover (0.68) appear weak, suggesting inefficiencies. Market valuations show mixed signals with a neutral P/E of 15.4 and an unfavorable P/B of 3.26. Overall, 64% of ratios are favorable.
Shareholder Return Policy
Newmont Corporation maintains a consistent dividend policy with a payout ratio around 15% in 2025, yielding roughly 1%. The company supports dividends with strong free cash flow and modest share buybacks, reflecting prudent capital allocation.
This balanced distribution approach aligns with sustainable long-term value creation. Newmont’s coverage ratios indicate dividends and buybacks remain well within cash flow limits, minimizing risks of over-distribution or financial strain.
Score analysis
The following radar chart presents a detailed view of Newmont Corporation’s key financial scores:
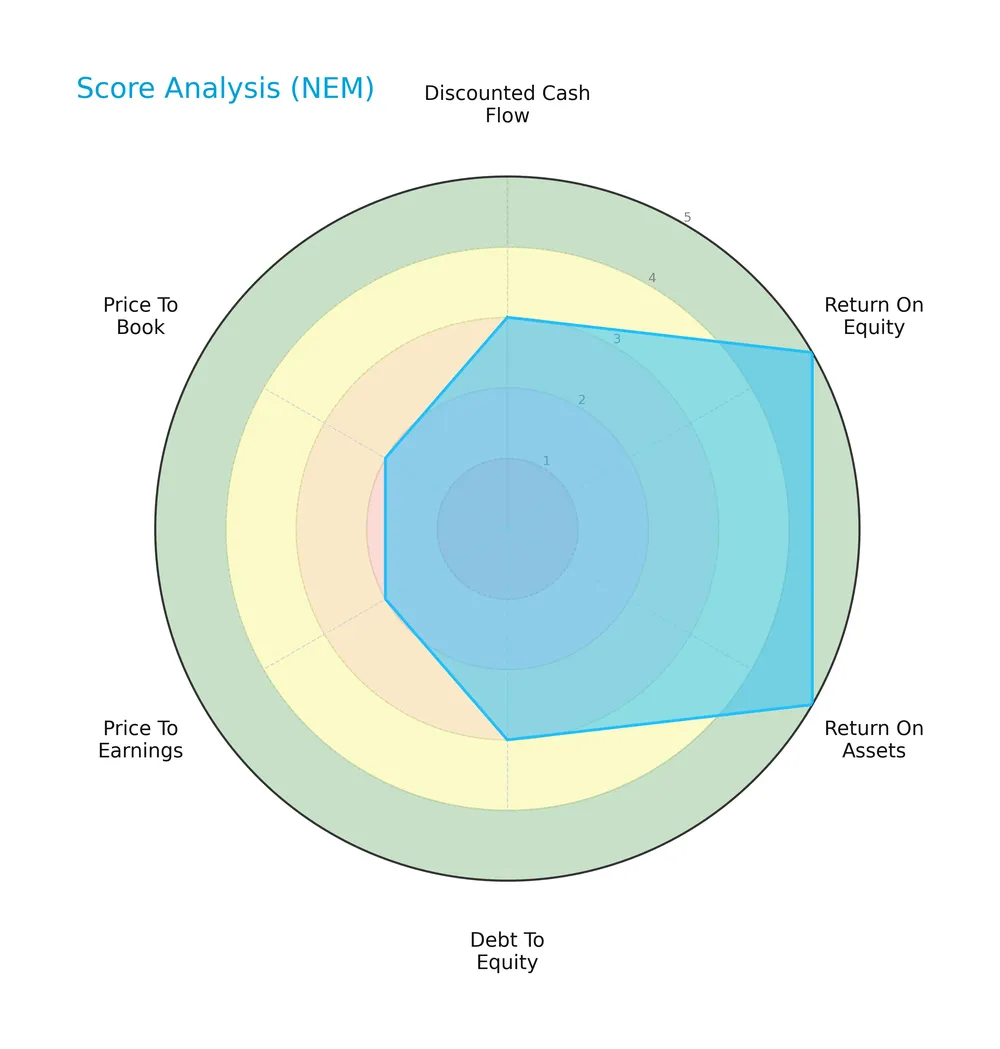
Newmont shows very favorable returns on equity and assets (scores of 5 each), indicating strong profitability. Debt-to-equity and discounted cash flow scores are moderate at 3. Price-to-earnings and price-to-book ratios appear unfavorable, both scoring 2.
Analysis of the company’s bankruptcy risk
Newmont’s Altman Z-Score places it comfortably in the safe zone, signaling low bankruptcy risk:

Is the company in good financial health?
The Piotroski Score diagram illustrates Newmont’s excellent financial health, reflecting strong fundamentals:

With a perfect Piotroski Score of 9, Newmont demonstrates very strong financial strength, indicating robust profitability, liquidity, and operational efficiency.
Competitive Landscape & Sector Positioning
This sector analysis examines Newmont Corporation’s strategic positioning, revenue segments, and key products within the gold industry. I will assess whether Newmont holds a competitive advantage over its main competitors.
Strategic Positioning
Newmont Corporation concentrates on gold production, generating $14.3B in gold dore sales in 2025, complemented by $8.3B from concentrate and other metals. Its operations span North and South America, Australia, and parts of Asia, demonstrating moderate geographic diversification within mining-intensive regions.
Revenue by Segment
The pie chart illustrates Newmont Corporation’s revenue breakdown by product segments for fiscal year 2025, highlighting the company’s primary income sources.
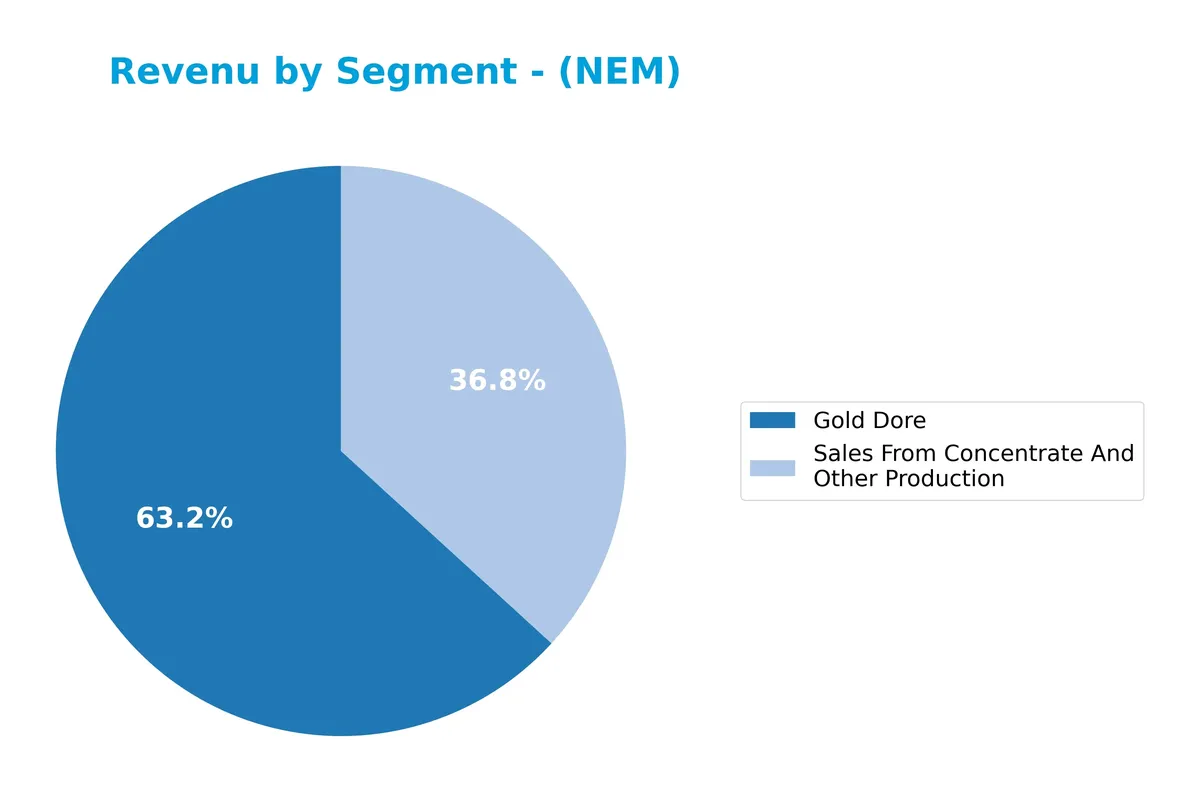
Newmont’s revenue is heavily driven by Gold Dore, which reached $14.3B in 2025, showing steady growth from $8.8B in 2023. Sales From Concentrate and Other Production also expanded significantly to $8.3B in 2025. This diversification reduces concentration risk, although Gold Dore remains the core profit engine, reflecting strong demand and efficient capital allocation in precious metals extraction.
Key Products & Brands
The following table outlines Newmont Corporation’s primary products and their core descriptions:
| Product | Description |
|---|---|
| Gold Dore | Semi-pure alloy bars of gold produced from mining operations, a key revenue driver at $14.3B in 2025. |
| Sales From Concentrate And Other Production | Revenues from sale of mineral concentrates and other mining by-products, totaling $8.3B in 2025. |
Newmont focuses predominantly on gold production through Gold Dore, complemented by concentrate sales. This dual stream supports its position in the basic materials sector with substantial global asset exposure.
Main Competitors
Newmont Corporation faces competition from 21 companies; here are the top 10 leaders by market capitalization:
| Competitor | Market Cap. |
|---|---|
| Linde plc | 200B |
| Newmont Corporation | 110B |
| CRH plc | 85B |
| The Sherwin-Williams Company | 81B |
| Freeport-McMoRan Inc. | 75B |
| Ecolab Inc. | 74B |
| Air Products and Chemicals, Inc. | 56B |
| Corteva, Inc. | 46B |
| Nucor Corporation | 39B |
| Vulcan Materials Company | 39B |
Newmont Corporation ranks 2nd among 21 competitors. It holds 66.5% of the market cap of the leading company, Linde plc. Newmont stands above both the average market cap of the top 10 competitors (80.5B) and the median market cap in the sector (38.3B). It has a substantial 50.35% gap to the next competitor above, underscoring its strong positioning.
Comparisons with competitors
Check out how we compare the company to its competitors:
Aucun article trouvé pour ces critères.
Does NEM have a competitive advantage?
Newmont Corporation shows a clear competitive advantage, with ROIC exceeding WACC by 15.7%, signaling consistent value creation and efficient capital use. Its gross margin of 64.3% and net margin of 31.6% further underpin strong profitability.
Looking ahead, Newmont’s diverse geographic footprint across key mining regions supports growth opportunities. Expansion in markets like the UK and Korea, alongside ongoing exploration of multiple metals, positions the company well for future resource development.
SWOT Analysis
This SWOT analysis identifies Newmont Corporation’s key internal strengths and weaknesses alongside external opportunities and threats to guide strategic decisions.
Strengths
- strong profitability with 31.6% net margin
- excellent capital efficiency, ROIC at 21.5% well above WACC
- diversified global operations across multiple continents
Weaknesses
- asset turnover below industry average at 0.4 signals underutilization
- relatively high price-to-book ratio at 3.26 may deter value investors
- reliance on commodity prices exposes earnings to volatility
Opportunities
- rising gold prices boosting revenue growth by 22% in 2025
- expansion potential in Asia Pacific and Africa markets
- technological advancements in mining improving cost efficiency
Threats
- commodity price fluctuations risking margin compression
- geopolitical risks in operating countries
- increasing environmental regulations raising compliance costs
Newmont displays a robust competitive position with strong profitability and a sustainable moat. However, asset utilization inefficiencies and valuation concerns warrant caution. The company should leverage growth in emerging markets and technological upgrades while mitigating geopolitical and regulatory risks.
Stock Price Action Analysis
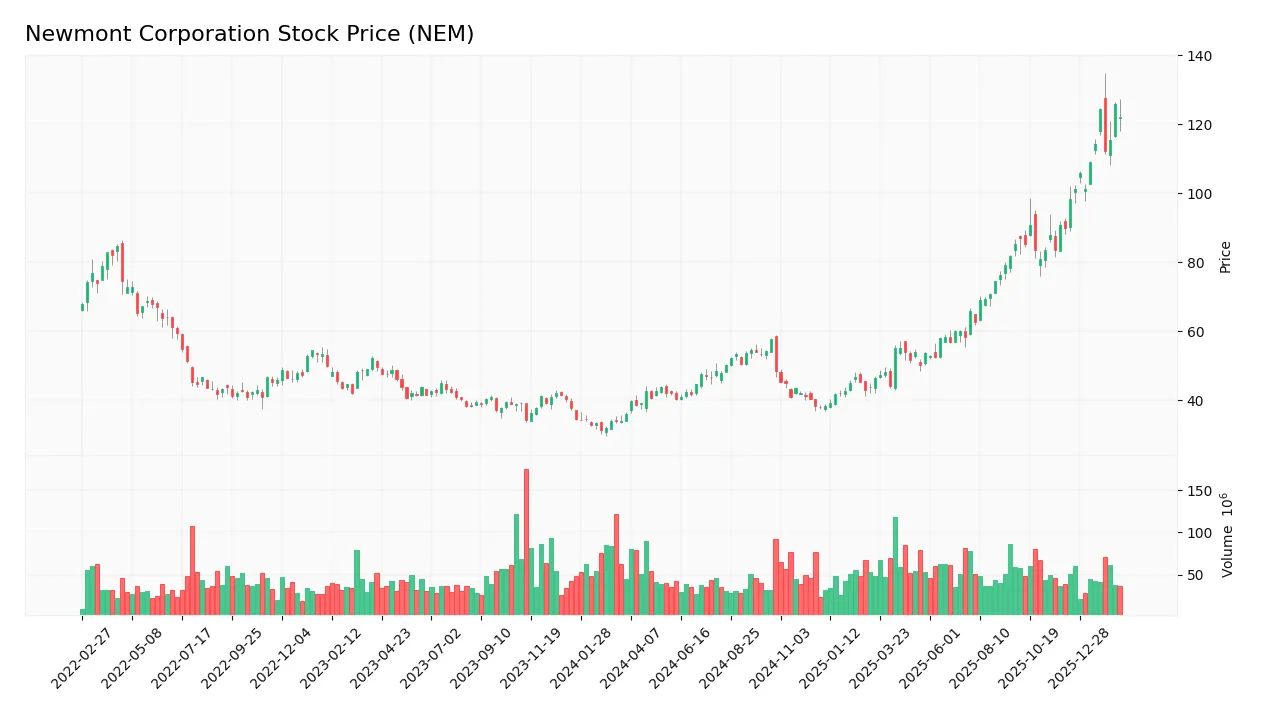
The weekly stock chart illustrates Newmont Corporation’s price movements over the past 100 weeks, highlighting key trend shifts and volatility patterns:
Trend Analysis
Over the past 100 weeks, Newmont’s stock price surged by 240.76%, indicating a strong bullish trend with accelerating momentum. The stock reached a high of 125.8 and a low of 35.84, with notable volatility reflected in a 23.2 standard deviation. Recent three-month gains of 36.06% continue this bullish acceleration.
Volume Analysis
Trading volume over the last three months shows a buyer-driven market, with buyers accounting for 67.51% of volume. Despite this dominance, total volume is decreasing, suggesting cautious investor participation amid strong buying interest.
Target Prices
Analysts set a broad target range for Newmont Corporation, reflecting diverse views on its near-term potential.
| Target Low | Target High | Consensus |
|---|---|---|
| 72 | 177 | 127.57 |
The target prices indicate optimism, with a consensus well above current levels, suggesting upside potential tempered by volatility in the gold sector.

Don’t Let Luck Decide Your Entry Point
Optimize your entry points with our advanced ProRealTime indicators. You’ll get efficient buy signals with precise price targets for maximum performance. Start outperforming now!
Analyst & Consumer Opinions
This section examines recent analyst ratings and consumer feedback regarding Newmont Corporation’s market performance and reputation.
Stock Grades
Here are the latest verified stock grades for Newmont Corporation from recognized financial institutions:
| Grading Company | Action | New Grade | Date |
|---|---|---|---|
| Scotiabank | Maintain | Sector Outperform | 2026-01-26 |
| UBS | Maintain | Buy | 2025-12-01 |
| Scotiabank | Upgrade | Sector Outperform | 2025-10-23 |
| UBS | Maintain | Buy | 2025-10-16 |
| B of A Securities | Maintain | Buy | 2025-10-16 |
| Citigroup | Maintain | Buy | 2025-10-15 |
| CIBC | Upgrade | Outperform | 2025-10-10 |
| Raymond James | Maintain | Outperform | 2025-09-23 |
| UBS | Maintain | Buy | 2025-09-19 |
| RBC Capital | Upgrade | Outperform | 2025-09-10 |
The overall trend shows consistent Buy and Outperform ratings, with multiple upgrades occurring in late 2025. This steady pattern reflects strong institutional confidence in Newmont’s sector positioning and growth prospects.
Consumer Opinions
Consumers express a mix of admiration and frustration toward Newmont Corporation, reflecting its complex market presence.
| Positive Reviews | Negative Reviews |
|---|---|
| Reliable dividend payouts attract investors. | Concerns over environmental impact persist. |
| Strong operational efficiency noted. | Customer service responsiveness can lag. |
| Transparent communication during market shifts. | Stock price volatility raises caution. |
Overall, Newmont earns praise for steady dividends and operational strength. However, environmental concerns and service issues temper enthusiasm, signaling areas for improvement.
Risk Analysis
Below is a summary table highlighting key risk categories, their descriptions, probabilities, and impacts for Newmont Corporation:
| Category | Description | Probability | Impact |
|---|---|---|---|
| Commodity Price | Gold and base metal prices fluctuate, affecting revenue. | Medium | High |
| Operational | Mining accidents or production disruptions at global sites. | Low | High |
| Regulatory | Environmental and mining regulations tightening globally. | Medium | Medium |
| Market Valuation | Elevated price-to-book ratio signals potential overvaluation. | Medium | Medium |
| Currency | Exposure to currency fluctuations in multiple countries. | Medium | Medium |
The most critical risks center on commodity price volatility and operational disruptions. Despite a strong financial position and safe Altman Z-Score (4.64), Newmont’s exposure to global mining conditions and fluctuating metals prices remains a top concern. Elevated valuation multiples relative to sector peers also warrant caution.
Should You Buy Newmont Corporation?
Newmont Corporation appears to be a robust value creator with a durable competitive moat supported by a growing ROIC well above WACC. Despite moderate leverage, its financial health suggests a strong operational efficiency profile. Overall, the rating could be seen as very favorable (A-).
Strength & Efficiency Pillars
Newmont Corporation exhibits robust profitability with a net margin of 31.62% and a return on equity (ROE) of 21.16%. Its return on invested capital (ROIC) stands at 21.46%, comfortably exceeding its weighted average cost of capital (WACC) of 5.73%. This clear spread marks Newmont as a value creator, efficiently generating returns beyond its capital costs. The company’s very strong Piotroski score of 9 further supports operational strength and effective capital allocation, underpinning a sustainable competitive advantage.
Weaknesses and Drawbacks
Despite solid fundamentals, Newmont faces valuation concerns with a price-to-book ratio of 3.26, flagged as unfavorable, indicating a premium valuation that may limit upside. The moderate debt-to-equity ratio of 0.01 and healthy current ratio of 1.72 mitigate leverage risks, but asset turnover metrics are weak (0.40), suggesting inefficiencies in asset utilization. These factors, combined with a neutral price-to-earnings ratio of 15.41, suggest cautious scrutiny is warranted despite favorable financial health.
Our Final Verdict about Newmont Corporation
Newmont’s financial profile is fundamentally strong, supported by a safe Altman Z-Score of 4.64 and a bullish overall trend with buyer dominance in recent periods. The company’s efficient capital use and profitability suggest it may appear attractive for long-term exposure. However, valuation premiums and operational inefficiencies in asset turnover might prompt investors to consider timing entry points carefully to optimize risk-reward balance.
Disclaimer: This content is for informational purposes only and does not constitute financial, investment, or other professional advice. Investing in financial markets involves a significant risk of loss, and past performance is not indicative of future results.
Additional Resources
- Newmont Corporation (NEM) Beats Q4 Earnings and Revenue Estimates – Yahoo Finance (Feb 19, 2026)
- Newmont slips despite big Q4 beat as lower production guidance prompts uncertainty (NEM:NYSE) – Seeking Alpha (Feb 20, 2026)
- Why Newmont Corporation Stock Dropped Today – The Motley Fool (Feb 17, 2026)
- Newmont Corporation (NEM) Reports Strong Q4 2025 Performance – GuruFocus (Feb 20, 2026)
- Newmont slides as investors digest 2026 outlook after Q4 earnings beat – Quiver Quantitative (Feb 20, 2026)
For more information about Newmont Corporation, please visit the official website: newmont.com