Home > Analyses > Consumer Defensive > Newell Brands Inc.
Newell Brands shapes everyday life through its vast portfolio of trusted household and personal products. From iconic kitchen appliances like Crock-Pot to safety essentials such as First Alert alarms, it commands significant market influence. The company excels at blending innovation with familiar quality across diverse consumer segments. Yet, as competitive pressures mount, I question whether Newell’s core fundamentals still support its current valuation and future growth trajectory.
Table of contents
Business Model & Company Overview
Newell Brands Inc., founded in 1903 and headquartered in Atlanta, Georgia, dominates the household and personal products sector. It operates a cohesive ecosystem spanning five segments, including Commercial Solutions, Home Appliances, and Learning and Development. Its portfolio of iconic brands like Rubbermaid, Calphalon, and Sharpie forms a comprehensive offering for both consumers and businesses, reflecting a core mission to enhance everyday living and working environments.
The company generates revenue through a balanced mix of durable goods, consumables, and recurring services, leveraging global reach across the Americas, Europe, and Asia. It serves diverse channels, from warehouse clubs to e-commerce, ensuring broad market penetration. Newell’s competitive advantage lies in its vast brand portfolio and multi-channel distribution, establishing a durable economic moat that shapes industry standards and consumer preferences.
Financial Performance & Fundamental Metrics
I analyze Newell Brands Inc.’s income statement, key financial ratios, and dividend payout policy to assess its core financial health and shareholder value creation.
Income Statement
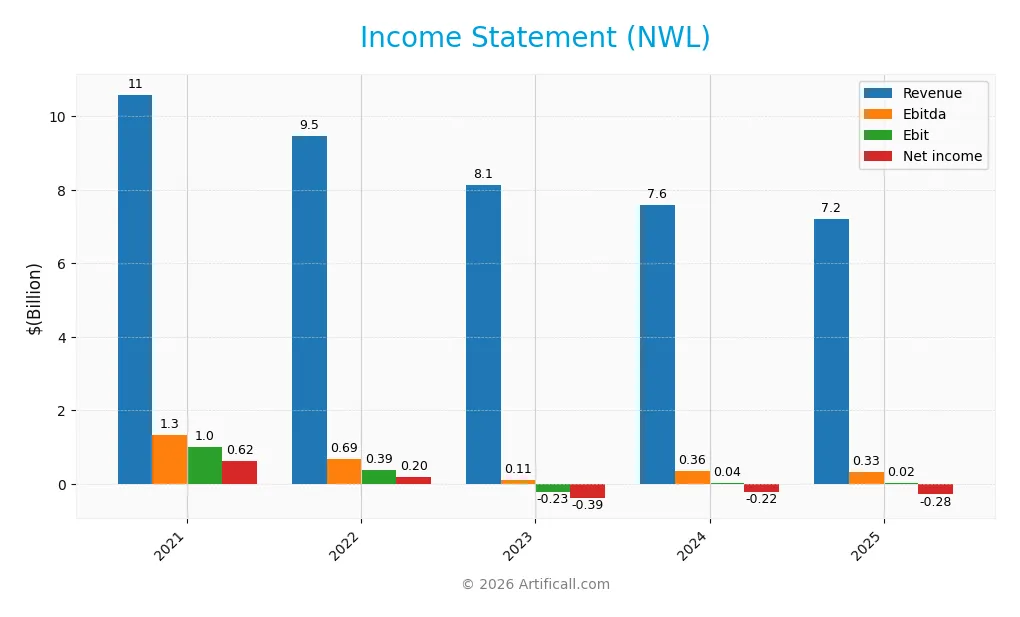
The table below summarizes Newell Brands Inc.’s key income statement figures for fiscal years 2021 through 2025, reflecting revenue trends, profitability, and earnings per share.
| 2021 | 2022 | 2023 | 2024 | 2025 | |
|---|---|---|---|---|---|
| Revenue | 10.6B | 9.5B | 8.1B | 7.6B | 7.2B |
| Cost of Revenue | 7.2B | 6.6B | 5.7B | 5.0B | 4.8B |
| Operating Expenses | 2.4B | 2.5B | 2.5B | 2.5B | 2.0B |
| Gross Profit | 3.4B | 2.8B | 2.4B | 2.5B | 2.4B |
| EBITDA | 1.3B | 688M | 107M | 358M | 331M |
| EBIT | 1.0B | 392M | -227M | 35M | 20M |
| Interest Expense | 256M | 235M | 283M | 295M | 321M |
| Net Income | 622M | 197M | -388M | -216M | -285M |
| EPS | 1.46 | 0.47 | -0.94 | -0.52 | -0.68 |
| Filing Date | 2022-02-14 | 2023-02-15 | 2024-02-20 | 2025-02-14 | 2026-02-13 |
Income Statement Evolution
From 2021 to 2025, Newell Brands’ revenue declined by nearly 32%, reflecting significant top-line contraction. Gross profit followed suit, falling about 28%, while gross margins stayed relatively steady at 33.76%, a favorable sign. However, EBIT and net income margins deteriorated sharply, with net margin turning negative at -3.96% in 2025, indicating worsening profitability.
Is the Income Statement Favorable?
The 2025 income statement reveals weak fundamentals. Revenue dropped 5% year-over-year, and net income posted a loss of $285M. EBIT margin barely reached 0.28%, a neutral outcome, while net margin remained negative, signaling ongoing operational challenges. Interest expenses are well-managed at 4.46% of revenue, but overall, the income statement’s health is unfavorable given persistent losses and declining earnings per share.
Financial Ratios
The table below summarizes key financial ratios for Newell Brands Inc. from 2021 through 2025, presenting profitability, valuation, liquidity, leverage, and efficiency metrics:
| Ratios | 2021 | 2022 | 2023 | 2024 | 2025 |
|---|---|---|---|---|---|
| Net Margin | 5.87% | 2.08% | -4.77% | -2.85% | -3.96% |
| ROE | 15.0% | 5.60% | -12.5% | -7.85% | -11.9% |
| ROIC | 7.48% | 2.86% | -0.63% | 0.64% | 5.09% |
| P/E | 14.9 | 27.6 | -9.26 | -19.2 | -5.46 |
| P/B | 2.23 | 1.55 | 1.16 | 1.50 | 0.65 |
| Current Ratio | 1.31 | 1.32 | 1.16 | 1.14 | 1.07 |
| Quick Ratio | 0.68 | 0.60 | 0.63 | 0.56 | 0.57 |
| D/E | 1.32 | 1.71 | 1.76 | 1.86 | 2.32 |
| Debt-to-Assets | 39% | 45% | 45% | 47% | 52% |
| Interest Coverage | 3.96 | 1.33 | -0.30 | 0.23 | 1.39 |
| Asset Turnover | 0.74 | 0.71 | 0.67 | 0.69 | 0.67 |
| Fixed Asset Turnover | 6.01 | 5.37 | 4.71 | 4.67 | 4.33 |
| Dividend Yield | 4.24% | 7.08% | 5.12% | 2.85% | 7.71% |
Evolution of Financial Ratios
Newell Brands’ Return on Equity (ROE) declined sharply from 15% in 2021 to -12% in 2025, signaling deteriorating profitability. The Current Ratio steadily decreased from 1.31 in 2021 to 1.07 in 2025, indicating a modest weakening in liquidity. Debt-to-Equity rose significantly, from 1.32 in 2021 to 2.32 in 2025, reflecting increased leverage and financial risk.
Are the Financial Ratios Fovorable?
In 2025, profitability ratios like net margin (-3.96%) and ROE (-11.92%) are unfavorable, highlighting weak earnings. Liquidity shows mixed signals: current ratio is neutral at 1.07, but quick ratio is low at 0.57. Leverage is high, with debt-to-equity at 2.32 and debt-to-assets over 51%, both unfavorable. Asset turnover is neutral, fixed asset turnover favorable, and dividend yield neutral. Overall, the financial ratios are slightly unfavorable.
Shareholder Return Policy
Newell Brands Inc. maintains a dividend payment with a yield around 7.7% in 2025, despite negative net income and a payout ratio below zero, indicating the dividend is not covered by earnings. The company also conducts share buybacks, but free cash flow coverage remains very weak at 6%.
This payout approach raises sustainability concerns given persistent net losses and high leverage. While dividends and buybacks return capital to shareholders, the negative earnings and thin cash flow coverage suggest this policy may pressure long-term value creation unless operational performance improves.
Score analysis
The radar chart below illustrates Newell Brands Inc.’s key financial scores across valuation, profitability, and leverage metrics:
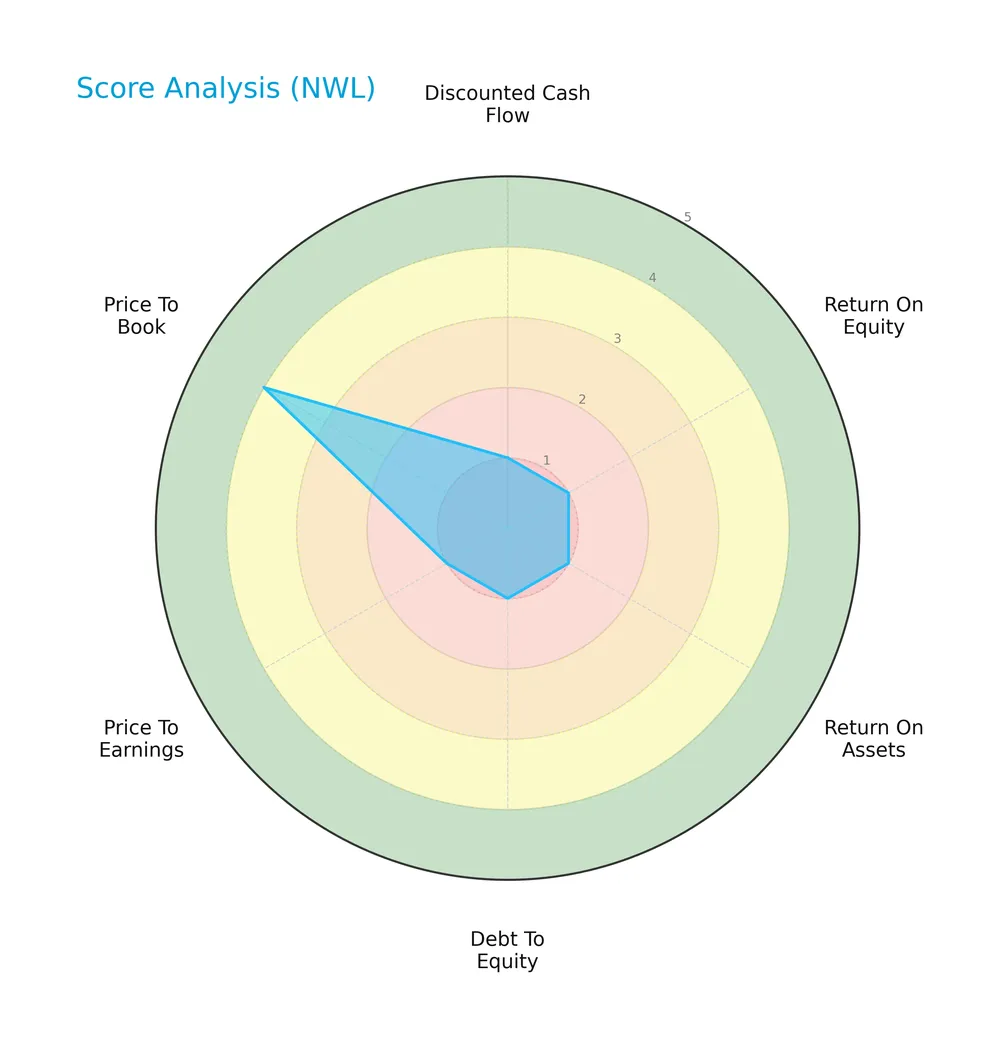
Newell Brands scores very low in discounted cash flow, ROE, ROA, debt to equity, and P/E ratios, reflecting significant financial challenges. Only the price to book ratio shows a relatively favorable score, indicating some valuation appeal.
Analysis of the company’s bankruptcy risk
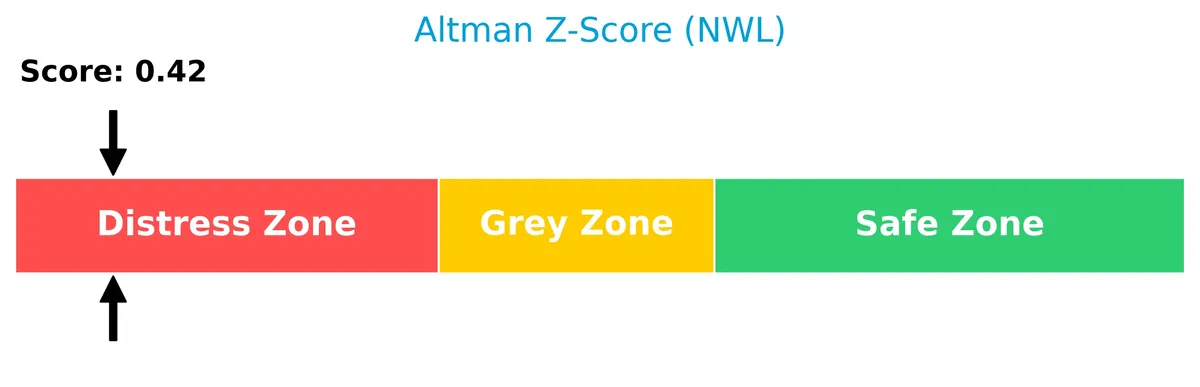
Newell Brands’ Altman Z-Score places it deep in the distress zone, signaling a high risk of bankruptcy and financial distress:
Is the company in good financial health?
The Piotroski Score diagram below displays Newell Brands’ financial strength based on profitability, leverage, and efficiency criteria:

With a Piotroski Score of 2, Newell Brands exhibits very weak financial health, indicating poor fundamentals and operational challenges that investors should carefully consider.
Competitive Landscape & Sector Positioning
This analysis reviews Newell Brands Inc.’s strategic positioning, revenue segments, and key products. I will assess whether Newell Brands holds a competitive advantage versus its main competitors.
Strategic Positioning
Newell Brands Inc. operates a diversified portfolio across five segments, including Home and Commercial, Learning and Development, and Outdoor and Recreation. Its geographic exposure is broad, with significant revenue from North America (4.7B) and notable international sales (2.5B), reflecting a balanced global footprint.
Revenue by Segment
The pie chart illustrates Newell Brands Inc.’s revenue breakdown by segment for fiscal year 2025, highlighting the relative contributions of Home And Commercial, Learning And Development, and Outdoor And Recreation.
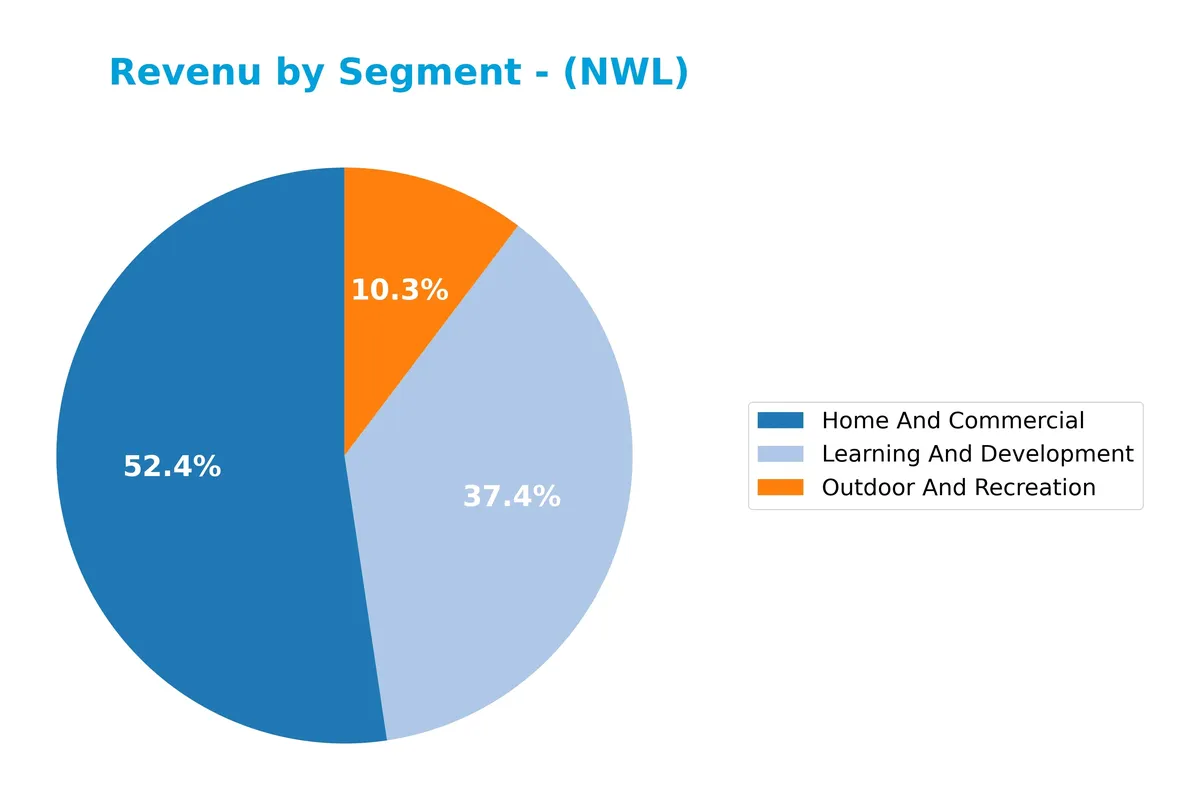
Home And Commercial leads with $3.77B, followed by Learning And Development at $2.69B, and Outdoor And Recreation at $741M. The data shows a downward trend in Home And Commercial and Outdoor And Recreation since 2023, signaling potential market pressures. Learning And Development remains relatively stable, supporting diversification but concentration risk persists in the dominant Home And Commercial segment.
Key Products & Brands
The table below outlines Newell Brands’ main products and associated brands by segment:
| Product | Description |
|---|---|
| Commercial Solutions | Commercial cleaning, maintenance, closet and garage organization, hygiene systems, and alarms. Brands include BRK, First Alert, Mapa, Quickie, Rubbermaid Commercial Products, and Spontex. |
| Home Appliances | Kitchen appliances such as slow cookers and coffee makers under Crock-Pot, Mr. Coffee, Oster, and Sunbeam. |
| Home Solutions | Food and home storage, fresh preserving, vacuum sealing, cookware, bakeware, cutlery, and home fragrance. Brands include Ball, Calphalon, Chesapeake Bay Candle, FoodSaver, Rubbermaid, Sistema, WoodWick, Yankee Candle. |
| Learning and Development | Writing instruments, art products, adhesives, labeling solutions, baby gear, and infant care products under Aprica, Baby Jogger, Graco, NUK, Tigex, Dymo, Elmer’s, EXPO, Mr. Sketch, Paper Mate, Parker, Prismacolor, Sharpie, Waterman, X-Acto. |
| Outdoor and Recreation | Outdoor and related products under Campingaz, Coleman, Contigo, ExOfficio, and Marmot. |
Newell Brands operates diverse segments spanning commercial cleaning to outdoor gear. Its portfolio includes well-recognized brands with significant market presence across household, personal, and recreational product categories.
Main Competitors
Newell Brands Inc. faces 17 competitors in its sector, with the table below listing the top 10 leaders by market capitalization:
| Competitor | Market Cap. |
|---|---|
| The Procter & Gamble Company | 331.3B |
| Unilever PLC | 143.2B |
| Colgate-Palmolive Company | 62.6B |
| The Estée Lauder Companies Inc. | 38.5B |
| Kimberly-Clark Corporation | 33.7B |
| Kenvue Inc. | 33.2B |
| Church & Dwight Co., Inc. | 20.2B |
| The Clorox Company | 12.3B |
| e.l.f. Beauty, Inc. | 4.3B |
| Inter Parfums, Inc. | 2.7B |
Newell Brands ranks 12th among 17 competitors by market cap. Its scale is only 0.59% of the top player, The Procter & Gamble Company. The company sits below both the average market cap of the top 10 leaders (68.2B) and the sector median (4.3B). It maintains a 36.33% market cap gap from its closest competitor above, highlighting a significant distance in scale within the sector.
Comparisons with competitors
Check out how we compare the company to its competitors:
Does NWL have a competitive advantage?
Newell Brands Inc. does not currently present a competitive advantage. Its ROIC is below WACC, showing value destruction and a declining profitability trend from 2021 to 2025.
The company operates diverse consumer product segments worldwide. Future opportunities may arise from expanding its commercial solutions and outdoor recreation markets, but no clear moat is evident from current data.
SWOT Analysis
This SWOT analysis highlights Newell Brands Inc.’s key internal and external factors shaping its strategic outlook.
Strengths
- diversified brand portfolio
- established global distribution
- strong dividend yield
Weaknesses
- declining revenue and profitability
- high debt leverage
- weak liquidity ratios
Opportunities
- expansion in emerging markets
- product innovation in home solutions
- e-commerce growth potential
Threats
- intense industry competition
- economic downturn impact
- supply chain disruptions
Newell Brands faces significant profitability and leverage challenges but benefits from a broad brand base and stable dividend. Strategic focus must prioritize debt reduction and innovation to capture growth opportunities while managing competitive and macroeconomic risks.
Stock Price Action Analysis
The weekly stock chart below illustrates Newell Brands Inc.’s price movements over the last 12 months, highlighting key volatility and trend shifts:
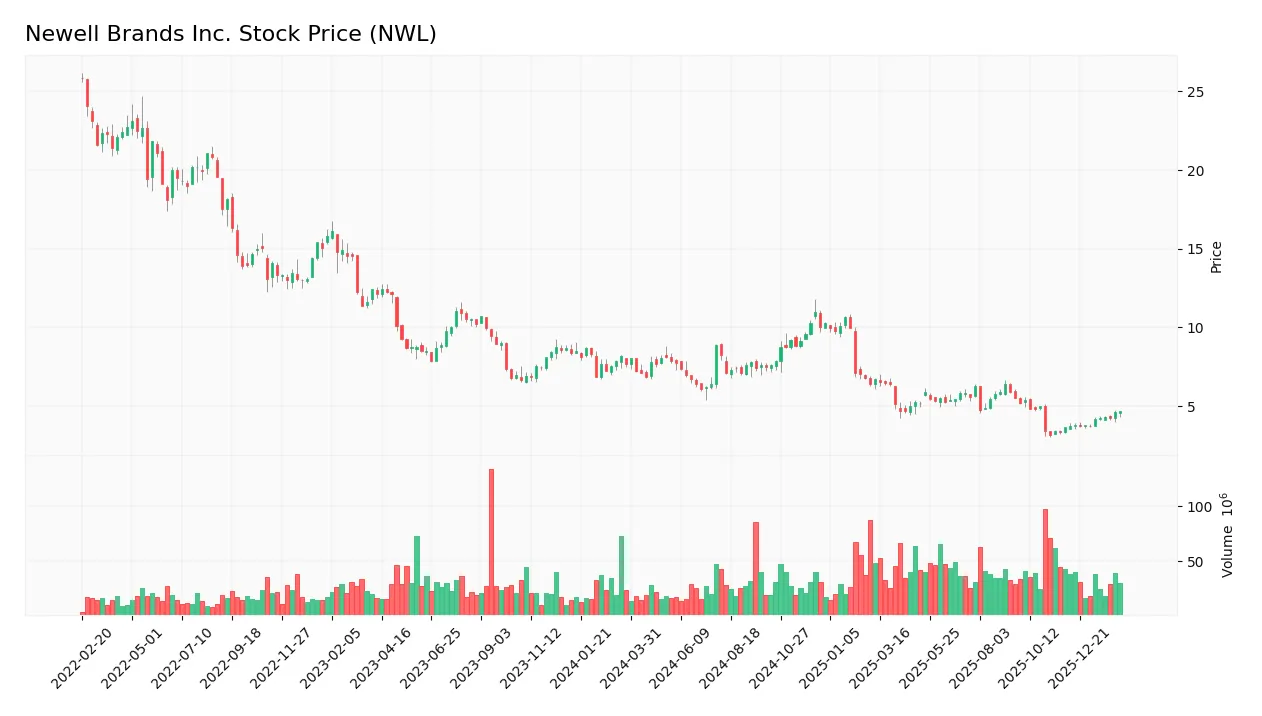
Trend Analysis
Over the past year, Newell Brands’ stock fell sharply by 38.64%, signaling a clear bearish trend with accelerating downside momentum. The price ranged between a high of 11.01 and a low of 3.17, reflecting significant volatility with a 1.9 standard deviation.
Volume Analysis
Trading volume has increased, with a total of 4B shares exchanging hands recently. Buyer volume slightly exceeds seller volume at 50.75%, indicating balanced but rising market participation. The last three months show strong buyer dominance at 78.68%, suggesting renewed investor interest and confidence.
Target Prices
Analysts present a cautious target consensus for Newell Brands Inc., reflecting mixed expectations.
| Target Low | Target High | Consensus |
|---|---|---|
| 4.5 | 8 | 5.83 |
The target range from 4.5 to 8 suggests moderate upside potential, with consensus near 5.83 indicating tempered optimism.

Don’t Let Luck Decide Your Entry Point
Optimize your entry points with our advanced ProRealTime indicators. You’ll get efficient buy signals with precise price targets for maximum performance. Start outperforming now!
Analyst & Consumer Opinions
This section reviews the latest analyst ratings and consumer feedback for Newell Brands Inc. (NWL) to gauge market sentiment.
Stock Grades
Here are the latest verified grades for Newell Brands Inc. from leading financial institutions:
| Grading Company | Action | New Grade | Date |
|---|---|---|---|
| Morgan Stanley | Maintain | Equal Weight | 2026-02-10 |
| Citigroup | Maintain | Neutral | 2026-02-09 |
| Canaccord Genuity | Maintain | Buy | 2026-01-26 |
| UBS | Maintain | Neutral | 2026-01-14 |
| Citigroup | Maintain | Neutral | 2026-01-14 |
| Citigroup | Maintain | Neutral | 2025-12-17 |
| UBS | Maintain | Neutral | 2025-12-02 |
| JP Morgan | Maintain | Overweight | 2025-11-03 |
| RBC Capital | Maintain | Sector Perform | 2025-11-03 |
| Citigroup | Maintain | Neutral | 2025-11-03 |
The consensus reflects a cautious stance with a majority holding neutral or equal weight grades. Buy ratings exist but are less frequent, indicating moderate confidence without strong bullish momentum.
Consumer Opinions
Consumers express mixed feelings about Newell Brands Inc., reflecting both loyalty and concerns.
| Positive Reviews | Negative Reviews |
|---|---|
| Product variety meets diverse household needs. | Some customers report inconsistent product quality. |
| Competitive pricing attracts budget-conscious buyers. | Customer service response times can be slow. |
| Strong brand recognition builds trust and reliability. | Packaging occasionally arrives damaged or flawed. |
Overall, Newell Brands earns praise for its broad product range and affordability. However, quality control and customer service delays remain notable weaknesses I observe consistently.
Risk Analysis
The following table summarizes key risks facing Newell Brands Inc., highlighting their likelihood and potential impact:
| Category | Description | Probability | Impact |
|---|---|---|---|
| Financial Health | Distress-level Altman Z-Score indicates high bankruptcy risk. | High | Severe |
| Profitability | Negative net margin (-3.96%) and ROE (-11.92%) reflect ongoing profitability challenges. | High | High |
| Leverage | High debt-to-equity ratio (2.32) and debt-to-assets (51.69%) raise solvency concerns. | High | High |
| Liquidity | Low quick ratio (0.57) and interest coverage (0.06) suggest weak short-term financial flexibility. | High | High |
| Market Valuation | Unfavorable overall financial scores despite a low P/B ratio (0.65) imply value traps risk. | Medium | Medium |
| Operational Efficiency | Neutral ROIC (5.09%) below WACC (5.78%) indicates limited value creation from capital. | Medium | Medium |
Among these, the most alarming is the severe financial distress signaled by the Altman Z-Score well below 1.8. Combined with negative returns on equity and weak liquidity ratios, Newell faces significant bankruptcy risk. Its heavy debt load and poor interest coverage further exacerbate this vulnerability. Investors should weigh these headwinds carefully against any valuation appeal.
Should You Buy Newell Brands Inc.?
Newell Brands Inc. appears to be facing substantial challenges with a deteriorating profitability profile and a very unfavorable competitive moat marked by value destruction. Despite a manageable leverage profile, its rating stands at a cautious C-, suggesting significant financial risks remain.
Strength & Efficiency Pillars
Newell Brands Inc. posts a positive gross margin of 33.76%, reflecting solid operational efficiency in cost management. The interest expense ratio sits at a favorable 4.46%, suggesting manageable financing costs. However, the return on invested capital (ROIC) at 5.09% falls below the weighted average cost of capital (WACC) of 5.78%, indicating the company is not creating value for shareholders. Given the Altman Z-Score signaling distress, I limit praise to operational margins rather than financial health.
Weaknesses and Drawbacks
Newell Brands faces acute financial distress with an Altman Z-Score of 0.42, well inside the distress zone, signaling a high bankruptcy risk. The company’s negative net margin of -3.96% and a poor return on equity of -11.92% underline profitability struggles. Leverage is high, with a debt-to-equity ratio of 2.32 and interest coverage near zero at 0.06, raising solvency concerns. The quick ratio of 0.57 flags liquidity issues, heightening short-term risk despite a modest current ratio of 1.07.
Our Final Verdict about Newell Brands Inc.
Despite some operational strengths, Newell Brands’ financial distress and solvency risks make its investment profile highly speculative. The extremely weak Piotroski Score of 2 reinforces ongoing financial fragility. Until the company demonstrates improved balance sheet stability and profitability, Newell Brands may appear too risky for conservative capital and warrants cautious consideration.
Disclaimer: This content is for informational purposes only and does not constitute financial, investment, or other professional advice. Investing in financial markets involves a significant risk of loss, and past performance is not indicative of future results.
Additional Resources
- Newell Brands Inc. (NASDAQ:NWL) Plans Quarterly Dividend of $0.07 – MarketBeat (Feb 10, 2026)
- Newell Brands Declares Dividend on Common Stock – Business Wire (Feb 09, 2026)
- A Look At Newell Brands (NWL) Valuation After Recent Share Price Momentum – Yahoo Finance (Feb 10, 2026)
- Morgan Stanley Raises Price Target for Newell Brands (NWL) | NWL Stock News – GuruFocus (Feb 10, 2026)
- Newell Brands: Baby-Step Recovery, But Shareholders Could Get Rubbed Away – Strong Sell – Seeking Alpha (Jan 14, 2026)
For more information about Newell Brands Inc., please visit the official website: newellbrands.com