Home > Analyses > Communication Services > Netflix, Inc.
Netflix, Inc. revolutionizes how millions worldwide consume entertainment, transforming screens into gateways for stories that captivate and connect. As a dominant force in the streaming industry, Netflix leads with a vast library of TV series, films, documentaries, and mobile games, supported by cutting-edge technology and a reputation for original content. With over 220 million subscribers globally, it continues to set the pace for innovation. But does its current valuation reflect sustainable growth in an increasingly competitive market?

Table of contents
Business Model & Company Overview
Netflix, Inc., founded in 1997 and headquartered in Los Gatos, California, stands as a global leader in the entertainment industry with a sprawling ecosystem of TV series, documentaries, feature films, and mobile games. Serving approximately 222M paid members across 190 countries, Netflix integrates diverse content with seamless streaming on multiple internet-connected devices, complemented by its DVD-by-mail service in the U.S. This broad offering underpins its dominant market position in digital entertainment.
The company’s revenue engine is driven by subscription-based streaming services, generating consistent recurring income from a vast international footprint spanning the Americas, Europe, and Asia. By focusing on software-driven content delivery rather than hardware, Netflix capitalizes on scalable digital distribution. Its competitive advantage lies in vast subscriber engagement and content variety, securing a robust economic moat that continues to shape the future of global entertainment consumption.
Financial Performance & Fundamental Metrics
In this section, I analyze Netflix, Inc.’s income statement, key financial ratios, and dividend payout policy to assess its financial health and investment potential.
Income Statement
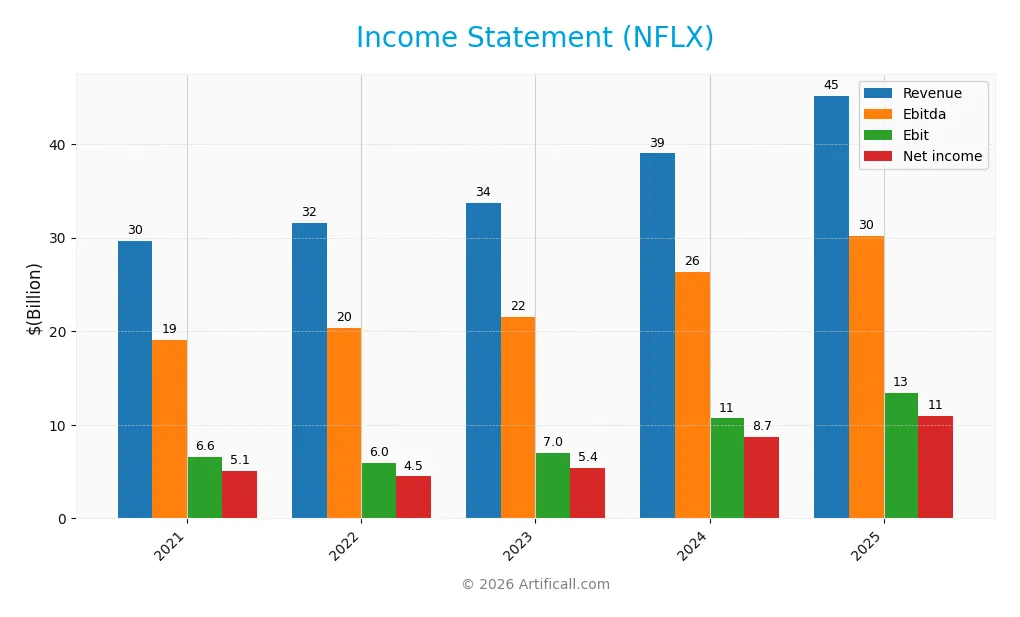
The table below summarizes Netflix, Inc.’s key income statement figures for the fiscal years 2021 through 2025, reflecting revenue, expenses, and profitability metrics in USD.
| 2021 | 2022 | 2023 | 2024 | 2025 | |
|---|---|---|---|---|---|
| Revenue | 29.7B | 31.6B | 33.7B | 39.0B | 45.2B |
| Cost of Revenue | 17.3B | 19.2B | 19.7B | 21.0B | 23.3B |
| Operating Expenses | 6.17B | 6.81B | 7.05B | 7.54B | 8.58B |
| Gross Profit | 12.4B | 12.4B | 14.0B | 18.0B | 21.9B |
| EBITDA | 19.0B | 20.3B | 21.5B | 26.3B | 30.2B |
| EBIT | 6.61B | 6.0B | 6.95B | 10.7B | 13.5B |
| Interest Expense | 766M | 706M | 749M | 719M | 777M |
| Net Income | 5.12B | 4.49B | 5.41B | 8.71B | 11.0B |
| EPS | 1.16 | 1.01 | 1.23 | 2.03 | 2.58 |
| Filing Date | 2022-01-27 | 2023-01-26 | 2024-01-26 | 2025-01-27 | 2025-12-22 |
Income Statement Evolution
From 2021 to 2025, Netflix’s revenue increased by 52.14%, reaching $45.2B in 2025. Net income more than doubled, growing 114.63% to $11B, reflecting strong profitability improvements. Margins showed favorable trends: gross margin rose to 48.49%, EBIT margin to 29.78%, and net margin to 24.3%, indicating efficient cost management alongside revenue growth.
Is the Income Statement Favorable?
The 2025 income statement reveals solid fundamentals with revenue up 15.85% year-over-year and net income growing 8.81%. Operating expenses scaled proportionally, maintaining margin integrity, while EBIT grew 25.92%, signaling operational leverage. Interest expense remained low at 1.72% of revenue. Overall, all key profitability and growth metrics are favorable, supporting a robust financial position.
Financial Ratios
The table below presents key financial ratios for Netflix, Inc. over the fiscal years 2021 to 2025, offering a concise view of profitability, valuation, liquidity, leverage, and efficiency:
| Ratios | 2021 | 2022 | 2023 | 2024 | 2025 |
|---|---|---|---|---|---|
| Net Margin | 17% | 14% | 16% | 22% | 24% |
| ROE | 32% | 22% | 26% | 35% | 41% |
| ROIC | 15% | 12% | 15% | 20% | 25% |
| P/E | 52.2 | 29.2 | 39.8 | 43.9 | 36.1 |
| P/B | 16.8 | 6.3 | 10.4 | 15.5 | 14.9 |
| Current Ratio | 0.95 | 1.17 | 1.12 | 1.22 | 1.19 |
| Quick Ratio | 0.95 | 1.17 | 1.12 | 1.22 | 1.19 |
| D/E | 1.14 | 0.81 | 0.82 | 0.73 | 0.54 |
| Debt-to-Assets | 41% | 35% | 35% | 34% | 26% |
| Interest Coverage | 8.1 | 8.0 | 9.3 | 14.5 | 17.2 |
| Asset Turnover | 0.67 | 0.65 | 0.69 | 0.73 | 0.81 |
| Fixed Asset Turnover | 22.4 | 22.6 | 22.6 | 24.5 | 22.5 |
| Dividend Yield | 0% | 0% | 0% | 0% | 0% |
Evolution of Financial Ratios
From 2021 to 2025, Netflix’s Return on Equity (ROE) improved significantly, rising from 32.3% in 2021 to 41.3% in 2025, indicating stronger profitability. The Current Ratio showed moderate growth, increasing from 0.95 to 1.19, reflecting slightly better short-term liquidity. Meanwhile, the Debt-to-Equity Ratio declined from 1.14 to 0.54, signaling reduced financial leverage and improved balance sheet stability.
Are the Financial Ratios Favorable?
In 2025, Netflix’s profitability ratios such as net margin (24.3%) and ROE (41.3%) are favorable, supported by a solid return on invested capital of 25.2%. Liquidity presents a neutral to favorable profile with a Current Ratio near 1.19 and a favorable quick ratio. Leverage metrics like a 26% debt-to-assets ratio and 0.54 debt-to-equity ratio are neutral to favorable, while market valuation ratios including P/E of 36.1 and P/B of 14.9 are considered unfavorable. Overall, half of the key ratios are favorable, suggesting a slightly favorable financial position.
Shareholder Return Policy
Netflix, Inc. has not paid dividends in recent years, reflecting a reinvestment strategy likely focused on growth and content development. Despite zero dividend payout ratio and yield, the company maintains positive free cash flow, supporting operational flexibility without share buybacks.
This lack of direct shareholder distributions aligns with a long-term value creation approach, prioritizing reinvestment over immediate returns. The absence of share buybacks suggests cautious capital allocation, emphasizing sustainable growth rather than short-term shareholder payouts.
Score analysis
The following radar chart presents an overview of Netflix, Inc.’s key financial scores for valuation and profitability metrics:
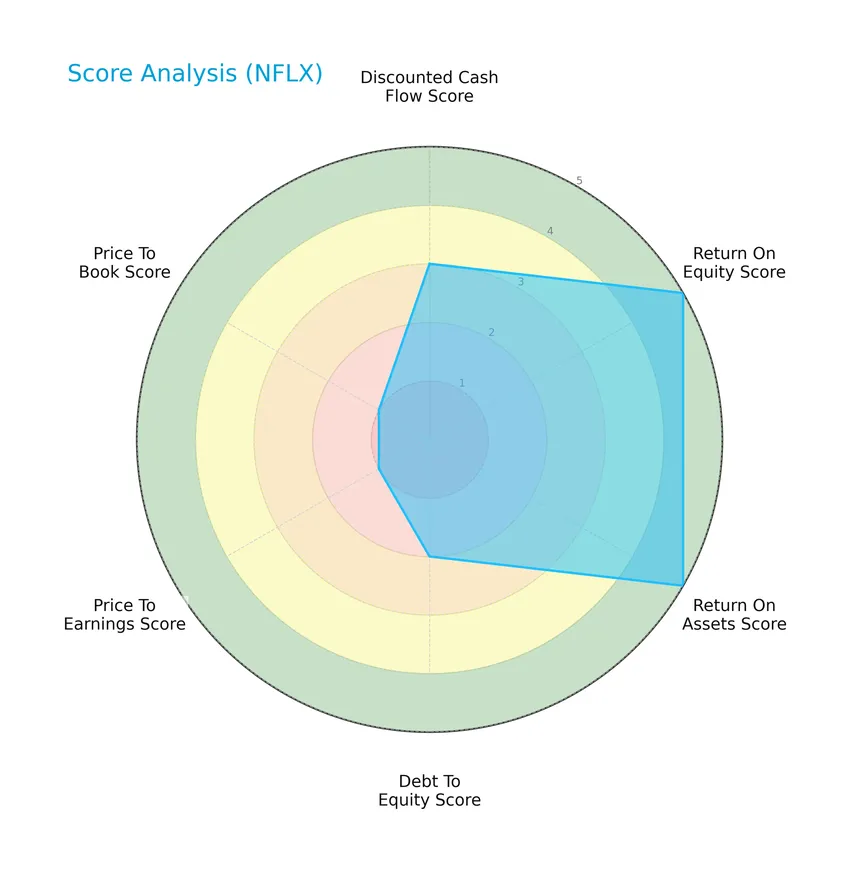
Netflix exhibits strong returns on equity and assets with scores of 5 each, indicating efficient profitability. However, debt-to-equity is moderate at 2, while valuation scores for price-to-earnings and price-to-book are very unfavorable at 1, reflecting market concerns on pricing metrics.
Analysis of the company’s bankruptcy risk
Netflix’s Altman Z-Score places it well within the safe zone, indicating a low risk of bankruptcy and solid financial stability:

Is the company in good financial health?
The Piotroski Score diagram provides insight into Netflix’s overall financial strength and stability:

With a Piotroski Score of 7, Netflix is considered to be in strong financial health, reflecting sound profitability, leverage, and operational efficiency relative to its peers.
Competitive Landscape & Sector Positioning
This section provides a detailed sector analysis of Netflix, Inc. covering strategic positioning, revenue segments, key products, main competitors, competitive advantages, and SWOT analysis. I will assess whether Netflix holds a competitive advantage over its rivals in the entertainment and communication services industry.
Strategic Positioning
Netflix, Inc. maintains a concentrated product portfolio focused predominantly on streaming entertainment, generating $39B in revenue in 2024, with negligible DVD sales. Geographically, it exhibits diversified exposure across four main regions, with the United States and Canada accounting for $17.4B, followed by EMEA at $12.4B, Latin America $4.8B, and Asia Pacific $4.4B.
Revenue by Segment
This pie chart shows Netflix, Inc.’s revenue distribution by segment for the fiscal year 2024, highlighting the dominance of streaming services in the company’s business model.
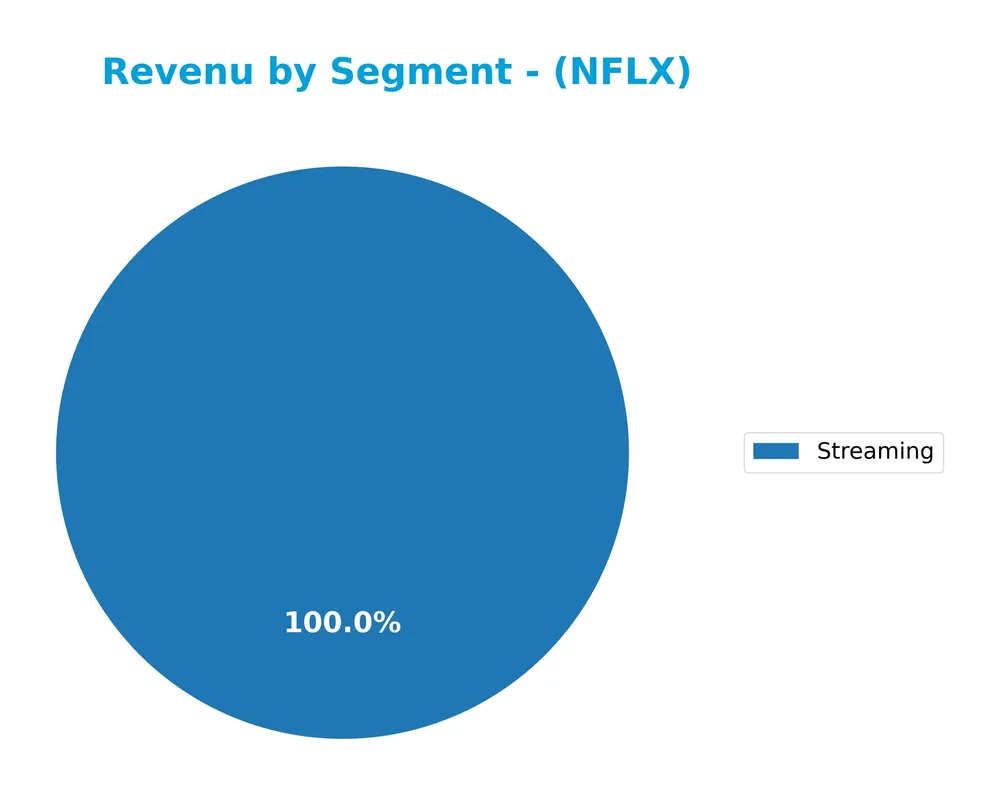
In 2024, Netflix’s revenue was overwhelmingly driven by its Streaming segment, generating $39B, which marks a significant increase from $33.6B in 2023. The Domestic DVD segment has become negligible, with no reported revenue in 2024 after shrinking steadily over recent years. This trend reflects Netflix’s strategic focus on streaming content and international expansion, reducing legacy revenue sources and concentrating risk in streaming, which continues to accelerate.
Key Products & Brands
The table below highlights Netflix, Inc.’s main products and services along with their descriptions:
| Product | Description |
|---|---|
| Streaming | Provides TV series, documentaries, feature films, and mobile games globally via internet-connected devices. |
| Domestic DVD | DVD-by-mail membership service available in the United States. |
Netflix primarily generates revenue from its streaming service available worldwide, supplemented by a smaller DVD rental business in the U.S. The streaming segment has shown consistent growth, reflecting the company’s focus on digital entertainment delivery.
Main Competitors
There are 8 competitors in total, with the table below listing the top 8 leaders by market capitalization:
| Competitor | Market Cap. |
|---|---|
| Netflix, Inc. | 385.5B |
| Warner Bros. Discovery, Inc. | 70.6B |
| Live Nation Entertainment, Inc. | 33.7B |
| Fox Corporation | 33.3B |
| TKO Group Holdings, Inc. | 16.9B |
| News Corporation | 16.6B |
| News Corporation | 14.8B |
| Paramount Skydance Corporation Class B Common Stock | 14.1B |
Netflix, Inc. ranks 1st among its 8 competitors in the Communication Services sector, with a market cap slightly above the top leader benchmark at 1.02 times that size. The company is well above both the average market cap of the top 10 competitors (73.2B) and the median market cap in its sector (25.1B). The distance to its next closest competitor is substantial, highlighting Netflix’s dominant position in the entertainment industry.
Comparisons with competitors
Check out how we compare the company to its competitors:
Does NFLX have a competitive advantage?
Netflix, Inc. presents a clear competitive advantage as evidenced by a very favorable moat status, with ROIC exceeding WACC by 13.58% and a strong upward trend in ROIC over 2021-2025, indicating durable value creation. The company’s income statement evaluation is fully favorable, supported by solid margins and significant revenue and profit growth, reinforcing its efficient use of invested capital.
Looking ahead, Netflix’s extensive global footprint with 222M paid members in 190 countries and growing revenues across all major regions, including Asia Pacific and EMEA, position it well to capitalize on expanding markets. Additionally, its diverse content offerings, including TV series, films, and mobile games, provide ongoing opportunities for innovation and market penetration.
SWOT Analysis
This SWOT analysis highlights Netflix, Inc.’s key internal and external factors to inform investment decisions.
Strengths
- Strong global brand with 222M paid members
- High profitability with 24.3% net margin
- Growing revenue and net income over 5 years
Weaknesses
- High P/E and P/B ratios indicating expensive valuation
- No dividend yield for income investors
- Moderate debt level with 0.54 D/E ratio
Opportunities
- Expansion in Asia Pacific and emerging markets
- Increasing demand for streaming and mobile gaming
- Leverage technology to enhance user experience
Threats
- Intense competition from other streaming platforms
- Regulatory challenges in multiple countries
- Market volatility affecting subscription growth
Netflix shows robust financial health and global presence, supported by strong profitability and growth. However, valuation metrics suggest caution, and competition remains fierce. The company’s strategy should focus on expanding international markets and innovation while managing valuation risks.
Stock Price Action Analysis
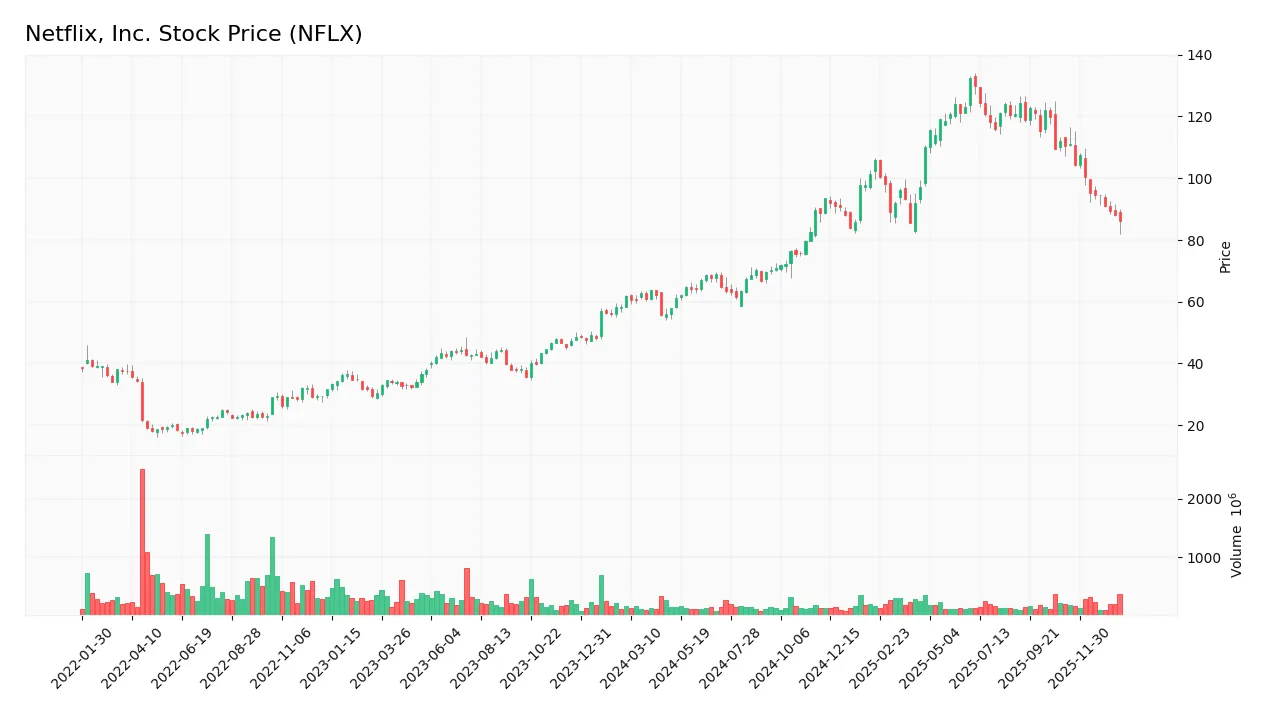
The weekly stock chart below illustrates Netflix, Inc.’s price movements and volatility over the last 12 months:
Trend Analysis
Over the past 12 months, Netflix’s stock price increased by 39.06%, reflecting a bullish trend with a deceleration in momentum. The price fluctuated between a low of 55.5 and a high of 132.31, exhibiting significant volatility with a standard deviation of 22.55%. However, recent performance from November 2025 to January 2026 shows a negative 21.97% change, indicating short-term bearish pressure.
Volume Analysis
In the last three months, trading volume has been decreasing with seller dominance evident as sellers accounted for 83.31% of activity. Buyer volume fell to 433M versus seller volume of 2.16B, suggesting weaker buying interest and a cautious or bearish investor sentiment amid declining market participation.
Target Prices
Analysts present a clear consensus on Netflix, Inc.’s target price range.
| Target High | Target Low | Consensus |
|---|---|---|
| 152 | 95 | 119.06 |
The target prices indicate moderate optimism, with analysts expecting Netflix’s share price to trade between 95 and 152, centering around 119. This suggests cautious confidence in the stock’s growth potential.

Don’t Let Luck Decide Your Entry Point
Optimize your entry points with our advanced ProRealTime indicators. You’ll get efficient buy signals with precise price targets for maximum performance. Start outperforming now!
Analyst & Consumer Opinions
This section reviews recent analyst ratings and consumer feedback to provide a comprehensive view of Netflix, Inc.’s market perception.
Stock Grades
Here is the latest summary of Netflix, Inc. stock grades from reputable financial analysts as of January 2026:
| Grading Company | Action | New Grade | Date |
|---|---|---|---|
| Argus Research | Maintain | Buy | 2026-01-22 |
| Piper Sandler | Maintain | Overweight | 2026-01-21 |
| Pivotal Research | Maintain | Hold | 2026-01-21 |
| Guggenheim | Maintain | Buy | 2026-01-21 |
| UBS | Maintain | Buy | 2026-01-21 |
| Deutsche Bank | Maintain | Hold | 2026-01-21 |
| Rosenblatt | Maintain | Neutral | 2026-01-21 |
| Canaccord Genuity | Maintain | Buy | 2026-01-21 |
| Needham | Maintain | Buy | 2026-01-21 |
| Wedbush | Maintain | Outperform | 2026-01-21 |
The consensus reflects a predominantly positive outlook with the majority assigning a Buy or equivalent rating, while a smaller portion suggests Hold or Neutral positions. No downgrades or Sell ratings were recently issued, indicating stable analyst sentiment.
Consumer Opinions
Netflix continues to spark diverse reactions from its global subscriber base, reflecting its evolving content strategy and platform experience.
| Positive Reviews | Negative Reviews |
|---|---|
| Vast and diverse content library keeps viewers engaged. | Rising subscription costs concern many long-term users. |
| User-friendly interface with personalized recommendations. | Occasional streaming quality issues during peak hours. |
| Frequent release of original and exclusive series. | Some users feel the platform is becoming too focused on quantity over quality. |
Overall, consumers appreciate Netflix’s extensive content and intuitive interface but express concerns about price hikes and occasional technical hiccups, suggesting a need for balancing cost with consistent service quality.
Risk Analysis
The table below summarizes key risks associated with Netflix, Inc., highlighting their probability and potential impact on the company’s performance:
| Category | Description | Probability | Impact |
|---|---|---|---|
| Market Volatility | High beta (1.71) indicates sensitivity to market fluctuations affecting stock price. | High | Medium |
| Valuation Concerns | Elevated P/E (36.11) and P/B (14.9) ratios suggest overvaluation risk. | Medium | High |
| Competitive Pressure | Intense competition in streaming and content creation markets. | High | High |
| Regulatory Risk | Changes in content regulation and licensing agreements worldwide. | Medium | Medium |
| Technological Disruption | Rapid innovation demands continuous investment in platform and content. | Medium | Medium |
| Debt and Liquidity | Moderate debt-to-equity ratio (0.54) with favorable interest coverage. | Low | Low |
| Dividend Policy | No dividend payments may affect income-focused investors’ sentiment. | Low | Low |
The most likely and impactful risks stem from market volatility and fierce competition, as Netflix operates in a dynamic entertainment sector with rapid shifts in consumer preferences and technological advances. Despite strong financial health indicated by a high Altman Z-Score and robust profitability ratios, valuation metrics warrant caution for new investors.
Should You Buy Netflix, Inc.?
Netflix, Inc. appears to be characterized by robust profitability and a durable competitive moat, supported by a growing ROIC well above its WACC, suggesting strong value creation. Despite a moderate leverage profile, the overall rating is a favorable B, indicating balanced financial health.
Strength & Efficiency Pillars
Netflix, Inc. exhibits robust profitability with a net margin of 24.3% and a return on equity (ROE) of 41.26%, underscoring strong operational efficiency. The company is a clear value creator, as its return on invested capital (ROIC) stands at 25.22%, well above its weighted average cost of capital (WACC) of 11.64%. Financial stability is further reinforced by an Altman Z-score of 10.80, which places Netflix firmly in the safe zone, and a Piotroski score of 7, indicating strong financial health. These metrics collectively highlight Netflix’s durable competitive advantage and growing profitability.
Weaknesses and Drawbacks
Investors should note several valuation and leverage concerns that temper Netflix’s appeal. The price-to-earnings (P/E) ratio is elevated at 36.11, signaling a premium valuation that could limit upside potential. Similarly, the price-to-book (P/B) ratio of 14.9 suggests the market prices Netflix at a significant premium relative to its book value. While debt-to-equity (0.54) and current ratio (1.19) remain moderate, the recent period reflects seller dominance with only 16.69% buyer volume, indicating short-term market pressure and potential volatility ahead.
Our Verdict about Netflix, Inc.
Netflix presents a fundamentally favorable profile supported by strong profitability and value creation metrics. However, despite the bullish long-term trend with a 39.06% price gain, the recent seller-dominant environment and a 21.97% price decline suggest caution. This combination might indicate that investors consider waiting for a more attractive entry point before increasing exposure, as short-term market pressures could persist despite the company’s durable fundamentals.
Disclaimer: This content is for informational purposes only and does not constitute financial, investment, or other professional advice. Investing in financial markets involves a significant risk of loss, and past performance is not indicative of future results.
Additional Resources
- Netflix (NFLX) technical analysis – Netflix (NASDAQ:NFLX) – Benzinga (Jan 23, 2026)
- Why Netflix (NFLX) Stock Is Falling Today – Yahoo Finance (Jan 21, 2026)
- Netflix Earnings: Good or Bad? – Zacks Investment Research (Jan 21, 2026)
- Netflix poised for long term growth; current weakness ‘a buying opportunity’ – analysts (NFLX:NASDAQ) – Seeking Alpha (Jan 21, 2026)
- Stock Traders Purchase High Volume of Netflix Call Options (NASDAQ:NFLX) – MarketBeat (Jan 22, 2026)
For more information about Netflix, Inc., please visit the official website: netflix.com