Home > Analyses > Technology > NetApp, Inc.
NetApp, Inc. revolutionizes how organizations manage and share data across on-premises and cloud environments, shaping the backbone of digital transformation worldwide. As a recognized leader in computer hardware and intelligent data management software, NetApp’s flagship offerings—like ONTAP and its cloud services—underscore its reputation for innovation and reliability. As the data landscape evolves rapidly, I explore whether NetApp’s robust fundamentals continue to justify its market valuation and growth prospects.

Table of contents
Business Model & Company Overview
NetApp, Inc., founded in 1992 and headquartered in San Jose, California, stands as a leader in the computer hardware industry. It delivers a comprehensive ecosystem of cloud-led and data-centric services designed to manage and share data across on-premises, private, and public cloud environments. Its portfolio integrates intelligent data management software with robust storage infrastructure, supporting a broad spectrum of industries from financial services to healthcare and telecommunications.
The company’s revenue engine balances sales of innovative hardware, such as All-Flash FAS and Fabric Attached Storage systems, with recurring software and cloud services spanning hybrid and public cloud segments. NetApp’s strategic footprint extends across the Americas, Europe, and Asia, supported by a direct sales force and partner ecosystem. This diversified approach underpins its strong economic moat, positioning it at the forefront of shaping the future of global data management.
Financial Performance & Fundamental Metrics
In this section, I analyze NetApp, Inc.’s income statement, key financial ratios, and dividend payout policy to assess its overall financial health and investment potential.
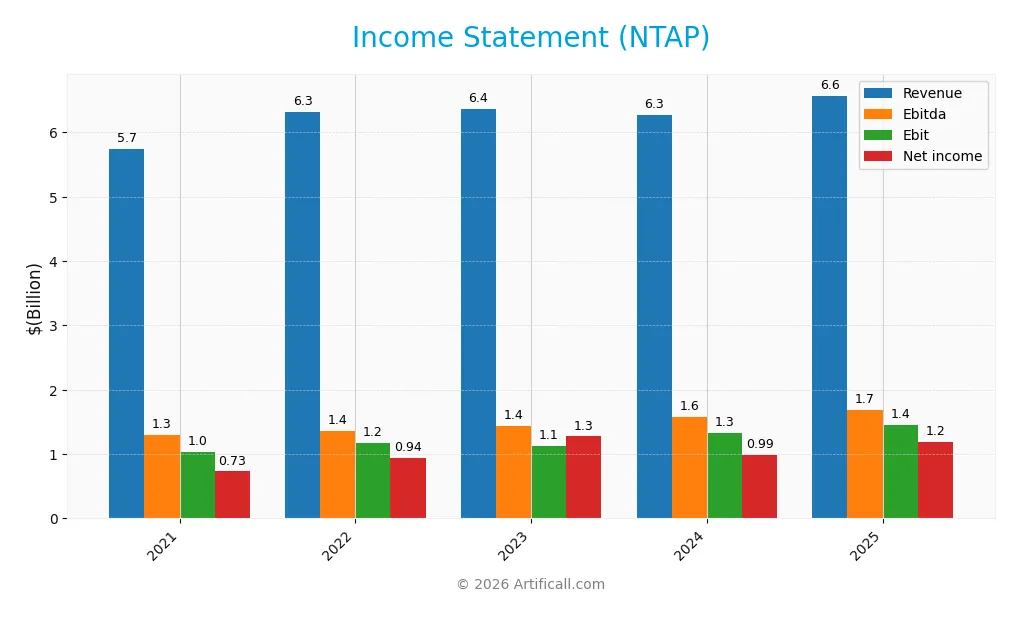
Income Statement
The following table presents NetApp, Inc.’s key income statement figures for the fiscal years 2021 through 2025, showing revenue, expenses, profits, and earnings per share.
| 2021 | 2022 | 2023 | 2024 | 2025 | |
|---|---|---|---|---|---|
| Revenue | 5.74B | 6.32B | 6.36B | 6.27B | 6.57B |
| Cost of Revenue | 1.93B | 2.10B | 2.15B | 1.84B | 1.96B |
| Operating Expenses | 2.78B | 3.06B | 3.19B | 3.22B | 3.28B |
| Gross Profit | 3.82B | 4.22B | 4.21B | 4.43B | 4.61B |
| EBITDA | 1.30B | 1.36B | 1.43B | 1.58B | 1.69B |
| EBIT | 1.04B | 1.17B | 1.13B | 1.33B | 1.45B |
| Interest Expense | 74M | 73M | 67M | 64M | 64M |
| Net Income | 730M | 937M | 1.27B | 986M | 1.19B |
| EPS | 3.29 | 4.20 | 5.87 | 4.74 | 5.81 |
| Filing Date | 2021-06-21 | 2022-06-16 | 2023-06-14 | 2024-06-10 | 2025-06-09 |
Income Statement Evolution
NetApp, Inc. experienced steady revenue growth from 5.74B in 2021 to 6.57B in 2025, representing a favorable 14.42% increase over five years. Net income showed stronger momentum, rising 62.47% to 1.19B over the same period. Margins improved notably, with the gross margin at 70.19% and net margin expanding by 42%, reflecting enhanced profitability and operational efficiency.
Is the Income Statement Favorable?
The 2025 income statement shows robust fundamentals: revenue grew 4.85% year-over-year, while net income surged 20.3% to 1.19B, driving a net margin of 18.05%. EBIT margin improved to 22.02%, supported by controlled operating expenses growing in line with revenue. Interest expense remained low at 0.97% of revenue. Overall, 85.7% of income statement metrics are favorable, indicating a strong financial position for the fiscal year.
Financial Ratios
The table below presents key financial ratios for NetApp, Inc. over the fiscal years 2021 to 2025, reflecting profitability, valuation, liquidity, leverage, efficiency, and dividend performance:
| Ratios | 2021 | 2022 | 2023 | 2024 | 2025 |
|---|---|---|---|---|---|
| Net Margin | 13% | 15% | 20% | 16% | 18% |
| ROE | 107% | 112% | 110% | 86% | 114% |
| ROIC | 13% | 16% | 16% | 15% | 16% |
| P/E | 23 | 17 | 11 | 22 | 15 |
| P/B | 24 | 19 | 12 | 19 | 18 |
| Current Ratio | 1.74 | 1.50 | 1.35 | 1.19 | 1.26 |
| Quick Ratio | 1.71 | 1.45 | 1.30 | 1.15 | 1.22 |
| D/E | 4.02 | 3.51 | 2.32 | 2.31 | 3.36 |
| Debt-to-Assets | 29% | 27% | 27% | 27% | 32% |
| Interest Coverage | 14 | 16 | 15 | 19 | 21 |
| Asset Turnover | 0.61 | 0.63 | 0.65 | 0.63 | 0.61 |
| Fixed Asset Turnover | 9.0 | 7.1 | 6.8 | 7.4 | 8.2 |
| Dividend Yield | 2.6% | 2.7% | 3.1% | 2.0% | 2.3% |
Evolution of Financial Ratios
From 2021 to 2025, NetApp, Inc.’s Return on Equity (ROE) showed fluctuations, peaking above 110% in 2022 and 2025, indicating strong profitability variability. The Current Ratio declined from 1.74 in 2021 to about 1.26 in 2025, reflecting a moderate decrease in short-term liquidity. The Debt-to-Equity Ratio remained elevated, rising from roughly 4.02 in 2021 to 3.36 in 2025, signaling consistent leverage with some improvement. Profitability margins remained relatively stable, with net profit margin around 18% in 2025.
Are the Financial Ratios Favorable?
In 2025, profitability ratios including net margin (18.05%) and ROE (114.04%) were marked favorable, demonstrating strong earnings performance. Liquidity was neutral to favorable, with a current ratio at 1.26 and quick ratio at 1.22. Leverage ratios such as debt-to-equity at 3.36 were considered unfavorable, indicating higher debt levels. Market valuation showed mixed signals: P/E ratio was neutral at 15.44, while price-to-book was unfavorable at 17.6. Overall, half the ratios were favorable, about 14% unfavorable, and 36% neutral, leading to a slightly favorable global assessment.
Shareholder Return Policy
NetApp, Inc. maintains a consistent dividend policy with a payout ratio around 35-58% over recent years and a dividend yield near 2-3%. Dividend payments are supported by strong free cash flow, with coverage ratios above 1.6, and the company also engages in share buybacks, enhancing shareholder returns.
This balanced approach combining dividends and buybacks appears sustainable given NetApp’s solid profitability and cash flow metrics. The policy supports long-term value creation by distributing earnings while retaining financial flexibility and managing leverage prudently.
Score analysis
The following radar chart presents an overview of NetApp, Inc.’s key financial scores related to valuation, profitability, and leverage:
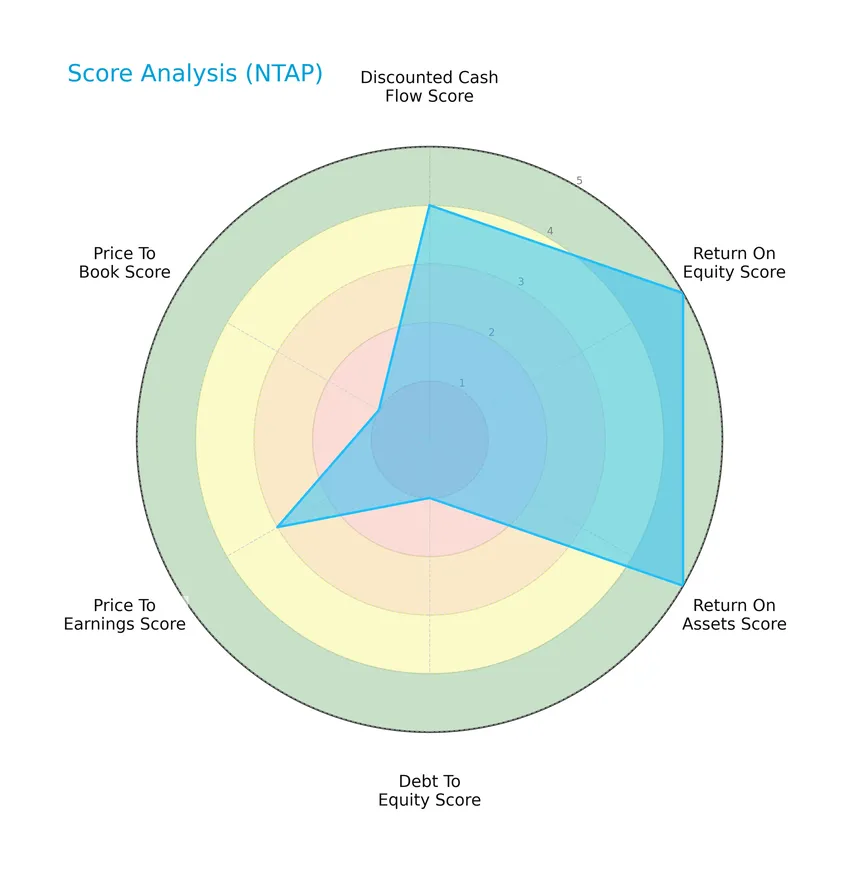
NetApp shows strong profitability with very favorable scores of 5 for both return on equity and return on assets. Its discounted cash flow score is favorable at 4. However, leverage metrics are weak, with a very unfavorable debt-to-equity score of 1. Valuation metrics are mixed, displaying moderate price-to-earnings but very unfavorable price-to-book scores.
Analysis of the company’s bankruptcy risk
NetApp’s Altman Z-Score places it in the grey zone, indicating a moderate risk of bankruptcy and some financial uncertainty:

Is the company in good financial health?
The Piotroski diagram below illustrates NetApp’s financial strength based on multiple accounting criteria:

With a Piotroski Score of 7, classified as strong, NetApp demonstrates solid financial health and operational efficiency, suggesting it maintains good fundamentals despite some leverage concerns.
Competitive Landscape & Sector Positioning
This sector analysis will explore NetApp, Inc.’s strategic positioning, revenue segments, key products, and main competitors. I will also assess whether NetApp holds a competitive advantage over its peers in the technology industry.
Strategic Positioning
NetApp, Inc. pursues a focused product strategy centered on cloud-led and data-centric services, with revenues primarily from Hybrid Cloud ($5.9B in 2025) and Public Cloud ($665M). Geographically, it maintains diversified exposure across Americas ($3.3B), EMEA ($2.2B), and Asia Pacific ($1B), balancing regional market presence.
Revenue by Segment
This pie chart illustrates NetApp, Inc.’s revenue distribution by segment for the fiscal year 2025, highlighting the company’s focus areas in cloud-related services.
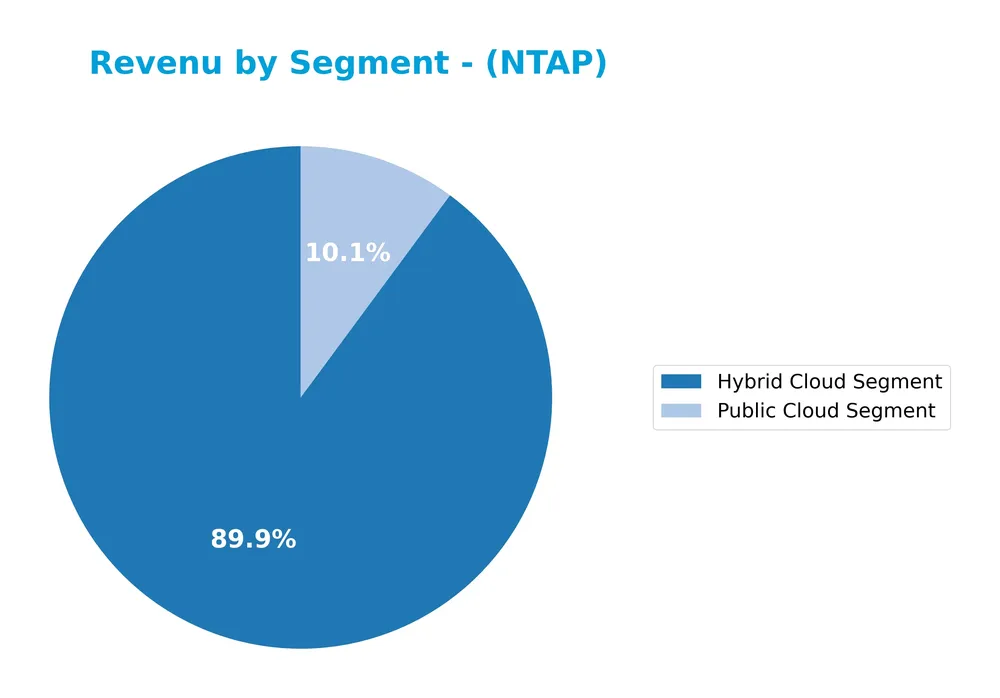
In 2025, NetApp’s revenue is predominantly driven by the Hybrid Cloud Segment with $5.9B, significantly outpacing the Public Cloud Segment at $665M. This reflects a strong emphasis on hybrid solutions while public cloud revenues continue a steady but smaller growth. The Hybrid Cloud Segment shows a consistent upward trend since 2023, indicating strategic growth, whereas Public Cloud revenue growth appears more moderate. The concentration in hybrid cloud suggests reliance on this segment but also signals a need to monitor diversification risks.
Key Products & Brands
The table below summarizes NetApp, Inc.’s key products and brands with their descriptions:
| Product | Description |
|---|---|
| NetApp ONTAP | Intelligent data management software for on-premises and cloud data management. |
| NetApp Snapshot | Data protection and snapshot technology included in the software suite. |
| NetApp SnapCenter Backup Management | A backup management solution for data protection and recovery. |
| NetApp SnapMirror Data Replication | Data replication software for disaster recovery and data availability. |
| NetApp SnapLock Data Compliance | Software for data compliance and retention management. |
| NetApp ElementOS software | Operating system software for storage infrastructure. |
| NetApp SANtricity software | Storage management software for NetApp storage systems. |
| NetApp All-Flash FAS series | High-performance all-flash storage arrays. |
| NetApp Fabric Attached Storage | Storage solutions designed for fabric-attached storage environments. |
| NetApp FlexPod | Integrated infrastructure platform combining storage and networking. |
| NetApp E/EF series | Enterprise-class storage solutions. |
| NetApp StorageGRID | Object storage solution for unstructured data. |
| NetApp SolidFire | Scalable all-flash storage platform. |
| NetApp Cloud Volumes ONTAP | Cloud storage management software for hybrid cloud environments. |
| Azure NetApp Files | Cloud file storage service integrated with Microsoft Azure. |
| Amazon FSx for NetApp ONTAP | Fully managed file storage service for AWS. |
| NetApp Cloud Volumes Service for Google Cloud | Cloud file storage solution for Google Cloud Platform. |
| NetApp Cloud Sync | Data synchronization service between on-premises and cloud. |
| NetApp Cloud Tiering | Automated data tiering to cloud storage. |
| NetApp Cloud Backup | Cloud backup service for data protection. |
| NetApp Cloud Data Sense | Data governance and compliance service for cloud data. |
| NetApp Cloud Volumes Edge Cache | Edge caching solution for cloud volumes. |
| NetApp Cloud Insights | Cloud infrastructure monitoring and optimization service. |
| Spot Ocean Kubernetes Suite | Kubernetes workload management on cloud infrastructure. |
| Spot Security | Cloud security management service. |
| Spot Eco | Cloud cost optimization service. |
| Spot CloudCheckr | Cloud cost and usage management platform. |
| NetApp Astra | Application-aware data management service. |
| Professional and Support Services | Strategic consulting, managed, support, assessment, design, implementation, and migration services. |
NetApp’s product portfolio spans intelligent data management software, storage infrastructure, and cloud data services, supported by a broad range of professional services. This comprehensive offering serves diverse industry sectors worldwide.
Main Competitors
There are 12 competitors in total; below are the top 10 leaders by market capitalization:
| Competitor | Market Cap. |
|---|---|
| Arista Networks, Inc. | 168B |
| Dell Technologies Inc. | 85.7B |
| Western Digital Corporation | 65.2B |
| Seagate Technology Holdings plc | 61.1B |
| Pure Storage, Inc. | 21.9B |
| NetApp, Inc. | 21.3B |
| HP Inc. | 20.7B |
| Super Micro Computer, Inc. | 18.4B |
| IonQ, Inc. | 15.9B |
| D-Wave Quantum Inc. | 9.1B |
NetApp, Inc. ranks 6th among its competitors with a market cap roughly 11.6% of the leader, Arista Networks. The company’s valuation is below both the average market cap of the top 10 competitors (48.7B) and the sector median (21B). It maintains a 12.87% market cap gap with the next competitor above, Pure Storage, indicating a moderate distance from its closest rival.
Comparisons with competitors
Check out how we compare the company to its competitors:
Does NTAP have a competitive advantage?
NetApp, Inc. presents a very favorable competitive advantage, demonstrated by a ROIC exceeding WACC by over 7%, coupled with a strong upward trend in ROIC of 25.6% over the 2021-2025 period, indicating efficient capital use and value creation. Its income statement metrics are largely favorable, with consistent growth in net margin (18.05%), EPS (up 75.5% overall), and EBIT margin (22.02%), reinforcing its profitability and operational strength.
Looking ahead, NetApp’s competitive positioning benefits from its extensive portfolio of cloud-led, data-centric services and intelligent data management software across hybrid and public cloud environments. The company’s ongoing expansion into diverse geographic markets, including Americas ($3.35B revenue in 2025), EMEA ($2.2B), and Asia Pacific ($1.02B), alongside new cloud storage and operations services, suggests continued opportunities for growth and market penetration.
SWOT Analysis
This SWOT analysis highlights the key internal and external factors impacting NetApp, Inc. for informed investment decisions.
Strengths
- strong profitability with 18% net margin
- durable competitive advantage with growing ROIC
- diversified cloud and data management product portfolio
Weaknesses
- high debt-to-equity ratio of 3.36
- elevated price-to-book ratio of 17.6
- moderate revenue growth of 4.85% last year
Opportunities
- expanding hybrid and public cloud markets
- increasing demand for data-centric solutions
- growth potential in Asia Pacific and EMEA regions
Threats
- intense competition in cloud and storage sectors
- rapid technology changes
- macroeconomic uncertainties impacting IT spending
NetApp’s solid profitability and competitive moat position it well for growth, though elevated leverage and valuation caution investors. Strategic focus on cloud innovation and geographic expansion is key to mitigating risks from competition and market volatility.
Stock Price Action Analysis
The following weekly chart illustrates NetApp, Inc.’s stock price movements and volatility over the past 12 months:
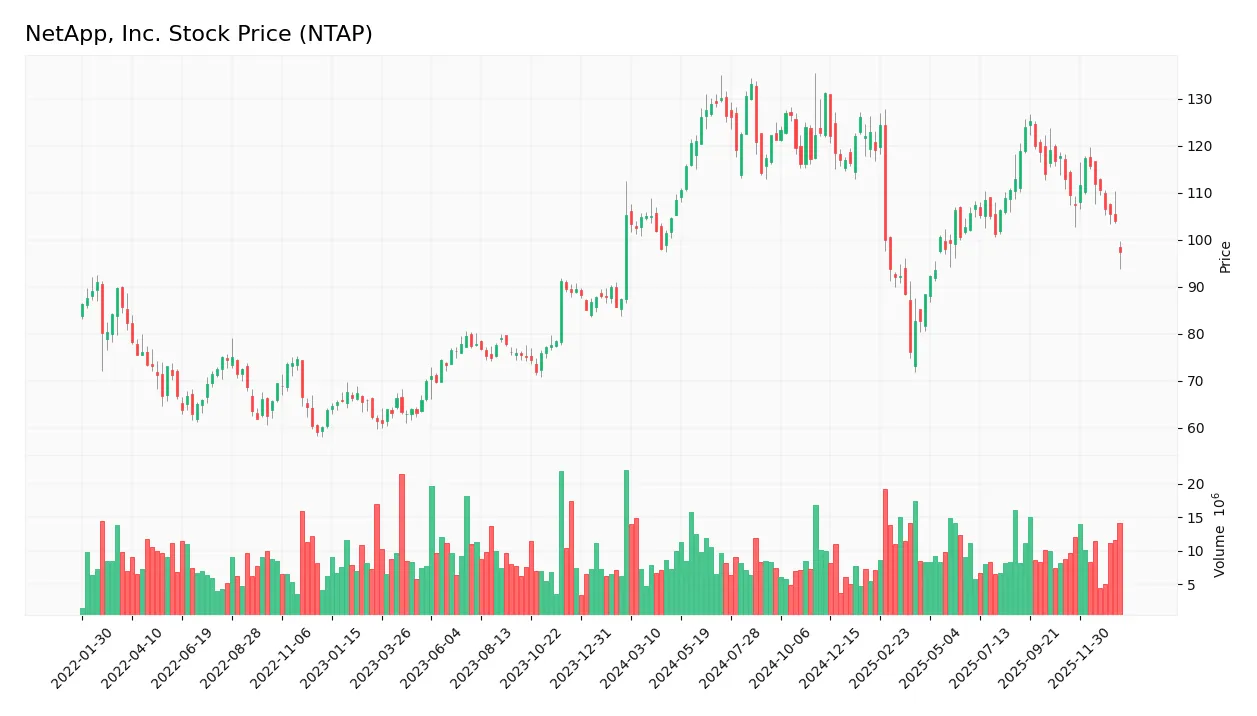
Trend Analysis
Over the past 12 months, NetApp’s stock price declined by 7.49%, indicating a bearish trend. The price ranged between a high of 133.12 and a low of 76.1, with volatility measured by a standard deviation of 12.06. The trend shows deceleration, suggesting a slowing downward momentum.
Volume Analysis
Trading volumes have been increasing overall, with buyers accounting for 55.51% of total activity, indicating a buyer-driven market. However, in the recent period from November 2025 to January 2026, sellers dominated with 80% of the volume, reflecting bearish investor sentiment and higher selling pressure during that timeframe.
Target Prices
The consensus target prices for NetApp, Inc. (NTAP) show a moderately optimistic outlook among analysts.
| Target High | Target Low | Consensus |
|---|---|---|
| 137 | 89 | 120.5 |
Analysts expect the stock price to trade within a range from 89 to 137, with a consensus target around 120.5, indicating potential upside from current levels.

Don’t Let Luck Decide Your Entry Point
Optimize your entry points with our advanced ProRealTime indicators. You’ll get efficient buy signals with precise price targets for maximum performance. Start outperforming now!
Analyst & Consumer Opinions
This section presents a detailed analysis of grades and consumer feedback regarding NetApp, Inc. (NTAP).
Stock Grades
Here is the latest summary of NetApp, Inc. stock grades from recognized financial institutions:
| Grading Company | Action | New Grade | Date |
|---|---|---|---|
| Morgan Stanley | Downgrade | Underweight | 2026-01-20 |
| Barclays | Maintain | Overweight | 2025-11-26 |
| UBS | Maintain | Neutral | 2025-11-26 |
| Northland Capital Markets | Upgrade | Outperform | 2025-11-26 |
| B of A Securities | Maintain | Neutral | 2025-11-26 |
| Wells Fargo | Maintain | Equal Weight | 2025-11-26 |
| Citigroup | Maintain | Neutral | 2025-11-12 |
| Citigroup | Maintain | Neutral | 2025-10-16 |
| Argus Research | Maintain | Buy | 2025-08-29 |
| Barclays | Maintain | Overweight | 2025-08-28 |
Overall, the grades present a mixed outlook with several firms maintaining neutral or overweight positions, while Morgan Stanley recently downgraded to underweight. The consensus among 70 analysts leans toward a Hold rating with 27 Buy and 9 Sell opinions, indicating balanced market sentiment.
Consumer Opinions
Consumers of NetApp, Inc. (NTAP) exhibit a mix of enthusiasm and critique, reflecting the company’s evolving position in the data management sector.
| Positive Reviews | Negative Reviews |
|---|---|
| Reliable data storage solutions with strong uptime | Customer support response times can be slow |
| Innovative cloud integration features | Pricing is relatively high for small businesses |
| User-friendly management interface | Some users report complexity in initial setup |
Overall, NetApp is praised for its dependable technology and innovation in cloud services, but users often point out issues with customer support and the learning curve for new deployments. This balance suggests NetApp’s strong product but room for improvement in service and accessibility.
Risk Analysis
Below is a summary table highlighting the key risks associated with investing in NetApp, Inc. (NTAP), focusing on their likelihood and potential impact:
| Category | Description | Probability | Impact |
|---|---|---|---|
| Financial Leverage | High debt-to-equity ratio (3.36) increases financial risk | Medium | High |
| Valuation Risk | Unfavorable price-to-book ratio (17.6) may indicate overvaluation | Medium | Medium |
| Market Volatility | Beta of 1.374 suggests above-average stock price fluctuations | High | Medium |
| Industry Competition | Rapid tech evolution in cloud and data storage markets | High | High |
| Economic Cycles | Sensitivity to global economic slowdowns affecting IT spending | Medium | Medium |
The most significant risks for NetApp are its relatively high leverage, which could strain finances in downturns, and intense competition in cloud storage that demands continuous innovation. Although its Altman Z-Score places it in the grey zone for bankruptcy risk, the company’s strong Piotroski Score and favorable profitability ratios provide some reassurance. Nonetheless, investors should monitor debt levels and market shifts carefully.
Should You Buy NetApp, Inc.?
NetApp, Inc. appears to be demonstrating robust profitability and a durable competitive moat with growing ROIC, suggesting strong value creation. Despite a manageable leverage profile, certain debt-related scores are less favorable, resulting in an overall B+ rating reflecting a cautiously optimistic financial health profile.
Strength & Efficiency Pillars
NetApp, Inc. exhibits robust profitability with a net margin of 18.05% and an exceptional return on equity of 114.04%, underscoring operational efficiency and shareholder value generation. The return on invested capital (ROIC) stands at 16.49%, comfortably exceeding the weighted average cost of capital (WACC) of 9.29%, confirming the company as a clear value creator. Financial health metrics reveal a strong Piotroski score of 7, signaling solid fundamentals, although the Altman Z-Score of 2.7 places it in the grey zone, suggesting moderate bankruptcy risk. Overall, NetApp’s growing ROIC and very favorable moat evaluation highlight a durable competitive advantage.
Weaknesses and Drawbacks
Despite favorable profitability, NetApp faces valuation and leverage concerns. The price-to-book ratio is notably elevated at 17.6, indicating an expensive premium relative to book value, which may pressure future returns. Debt-to-equity ratio at 3.36 is very unfavorable, reflecting high leverage that could constrain financial flexibility. The current ratio of 1.26 is neutral, suggesting adequate but not excessive liquidity. Market dynamics show a recent seller dominance with only 20.03% buyer volume between November 2025 and January 2026, contributing to a bearish stock trend and a recent price decline of -13.76%, which could weigh on near-term investor sentiment.
Our Verdict about NetApp, Inc.
NetApp presents a favorable long-term fundamental profile, driven by strong profitability, value creation, and competitive positioning. However, the recent technical trend reveals seller dominance and a bearish price momentum, pointing to short-term headwinds. Despite its underlying strength, this recent market pressure suggests a wait-and-see approach could be prudent to identify a more attractive entry point. The company’s profile might appear compelling for investors with a tolerance for volatility seeking durable value creation.
Disclaimer: This content is for informational purposes only and does not constitute financial, investment, or other professional advice. Investing in financial markets involves a significant risk of loss, and past performance is not indicative of future results.
Additional Resources
- Y Intercept Hong Kong Ltd Acquires 96,937 Shares of NetApp, Inc. $NTAP – MarketBeat (Jan 24, 2026)
- Why NetApp (NTAP) Stock Is Down Today – Yahoo Finance (Jan 20, 2026)
- Morgan Stanley Downgrade Puts NetApp Valuation And Growth In Focus – Sahm (Jan 24, 2026)
- NetApp Inc. (NASDAQ:NTAP) Offers a Durable Dividend Backed by Strong Earnings – Chartmill (Jan 19, 2026)
- NetApp Inc (NTAP) Stock Price Down 7.26% on Jan 20 – GuruFocus (Jan 20, 2026)
For more information about NetApp, Inc., please visit the official website: netapp.com