Home > Analyses > Financial Services > Nasdaq, Inc.
Nasdaq, Inc. powers the heartbeat of global capital markets by connecting thousands of companies and investors every day. Its innovative technology drives trading, data intelligence, and market surveillance across multiple asset classes, shaping how markets operate worldwide. Known for its cutting-edge platforms and comprehensive financial data services, Nasdaq stands at the forefront of market evolution. The critical question now is whether its robust fundamentals still support its premium valuation and growth trajectory in a rapidly changing financial landscape.

Table of contents
Business Model & Company Overview
Nasdaq, Inc. stands as a global leader in financial market technology and data services. Founded in 1971 and headquartered in New York City, it operates a comprehensive ecosystem that spans stock exchanges, market surveillance, and investment intelligence. Nasdaq integrates diverse assets—equities, derivatives, commodities, and digital currencies—under one roof, reinforcing its dominant role in capital markets worldwide.
The company’s revenue engine balances recurring SaaS solutions with transaction-driven exchange services. Its Market Technology segment offers anti-financial crime tools, while Investment Intelligence licenses market data and indexes. Nasdaq’s Corporate Platforms manage listing and governance solutions. Serving the Americas, Europe, and Asia, it commands a robust global footprint. This competitive advantage cements Nasdaq’s economic moat and shapes the future of global financial infrastructure.
Financial Performance & Fundamental Metrics
I will analyze Nasdaq, Inc.’s income statement, key financial ratios, and dividend payout policy to evaluate its core financial health and shareholder returns.
Income Statement
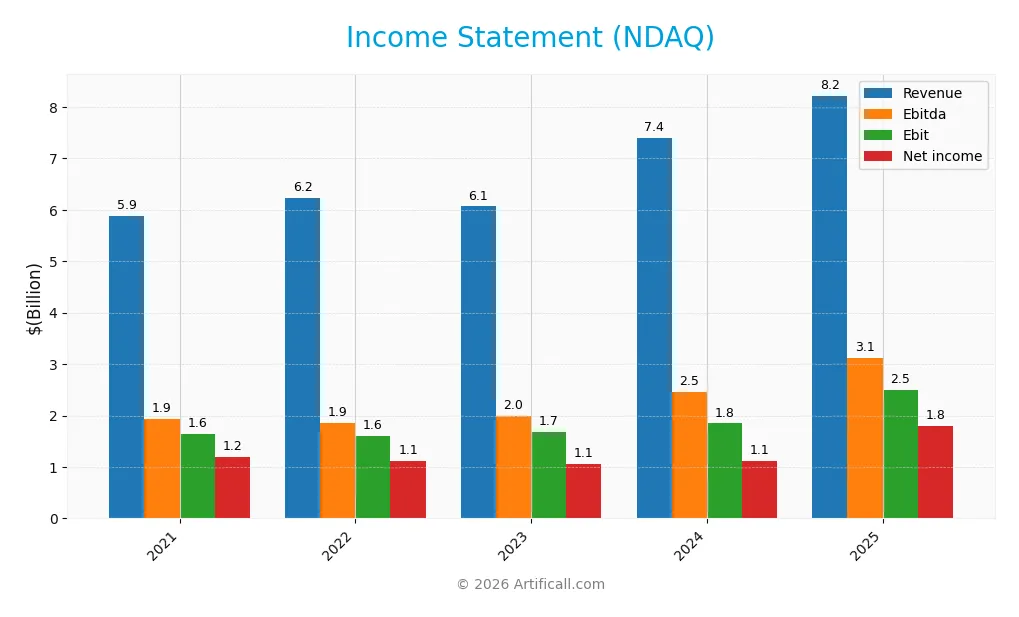
The table below summarizes Nasdaq, Inc.’s annual income statement figures from 2021 to 2025, illustrating revenue growth and profitability trends.
| 2021 | 2022 | 2023 | 2024 | 2025 | |
|---|---|---|---|---|---|
| Revenue | 5.89B | 6.23B | 6.06B | 7.40B | 8.22B |
| Cost of Revenue | 3.65B | 3.89B | 3.52B | 4.41B | 4.28B |
| Operating Expenses | 791M | 775M | 968M | 1.19B | 1.61B |
| Gross Profit | 2.23B | 2.34B | 2.55B | 2.99B | 3.94B |
| EBITDA | 1.93B | 1.85B | 1.99B | 2.46B | 3.13B |
| EBIT | 1.65B | 1.60B | 1.67B | 1.85B | 2.49B |
| Interest Expense | 0 | 0 | 0 | 0 | 88M |
| Net Income | 1.19B | 1.13B | 1.06B | 1.12B | 1.79B |
| EPS | 2.38 | 2.28 | 2.10 | 1.94 | 3.13 |
| Filing Date | 2022-02-23 | 2023-02-23 | 2024-02-21 | 2025-02-21 | 2026-02-12 |
Income Statement Evolution
Nasdaq’s revenue grew steadily from 5.9B in 2021 to 8.2B in 2025, a 40% increase overall. Net income expanded faster, rising 51% to 1.79B in 2025. Margins improved, with gross margin near 48% and net margin at 21.8%, reflecting stronger profitability despite a slight rise in operating expenses relative to revenue.
Is the Income Statement Favorable?
The 2025 income statement shows solid fundamentals. Gross profit surged 32% year-on-year, lifting EBITDA and EBIT margins to favorable levels above 30%. Interest expense remains low at just over 1% of revenue. Net margin grew 44%, with EPS up 60%, indicating efficient capital and cost management. Overall, the income profile is robust and well-positioned.
Financial Ratios
The following table presents key financial ratios for Nasdaq, Inc. from 2021 through 2025, illustrating profitability, liquidity, leverage, and market valuation metrics:
| Ratios | 2021 | 2022 | 2023 | 2024 | 2025 |
|---|---|---|---|---|---|
| Net Margin | 20.2% | 18.1% | 17.5% | 15.1% | 21.8% |
| ROE | 18.6% | 18.3% | 9.8% | 10.0% | 14.6% |
| ROIC | 8.4% | 9.4% | 5.1% | 6.0% | 8.3% |
| P/E | 29.4 | 26.9 | 27.9 | 39.8 | 31.0 |
| P/B | 5.4 | 4.9 | 2.7 | 4.0 | 4.5 |
| Current Ratio | 0.94 | 0.97 | 1.01 | 0.99 | 1.01 |
| Quick Ratio | 0.94 | 0.97 | 1.01 | 0.99 | 1.01 |
| D/E | 0.97 | 0.95 | 1.01 | 0.88 | 0.81 |
| Debt-to-Assets | 31.0% | 28.0% | 33.7% | 32.5% | 32.0% |
| Interest Coverage | 0 | 0 | 0 | 0 | 26.5 |
| Asset Turnover | 0.29 | 0.30 | 0.19 | 0.24 | 0.26 |
| Fixed Asset Turnover | 6.7 | 6.4 | 6.2 | 7.6 | 7.0 |
| Dividend Yield | 1.00% | 1.27% | 1.49% | 1.22% | 1.08% |
Evolution of Financial Ratios
Nasdaq’s Return on Equity (ROE) declined from 18.6% in 2021 to 14.6% in 2025, indicating a moderation in profitability. The Current Ratio improved slightly to about 1.01 in 2025, reflecting stable liquidity. Debt-to-Equity Ratio decreased from over 1.0 in 2023 to 0.81 in 2025, showing moderate deleveraging over the period.
Are the Financial Ratios Fovorable?
In 2025, Nasdaq’s profitability ratios show a favorable net margin of 21.8% but a neutral ROE and ROIC relative to its 7.5% WACC. Liquidity ratios are neutral to favorable, with a Current Ratio near 1.0 and a Quick Ratio favorable at 1.01. Leverage metrics, including Debt-to-Equity at 0.81, are neutral. Market valuation ratios, such as P/E at 31 and P/B at 4.5, are unfavorable, balancing the overall slightly favorable assessment.
Shareholder Return Policy
Nasdaq, Inc. maintains a consistent dividend payout ratio around 33-48%, with a rising dividend per share reaching 1.05 in 2025. The annual dividend yield hovers near 1.08%, supported by free cash flow coverage and moderate share buyback activity.
This disciplined distribution balances shareholder returns with capital reinvestment. The payout ratio and dividend coverage suggest sustainable distributions, while buybacks add flexibility. Overall, the policy supports steady long-term shareholder value without excessive financial strain.
Score analysis
Below is a radar chart illustrating Nasdaq, Inc.’s key financial scores across valuation, profitability, and leverage:
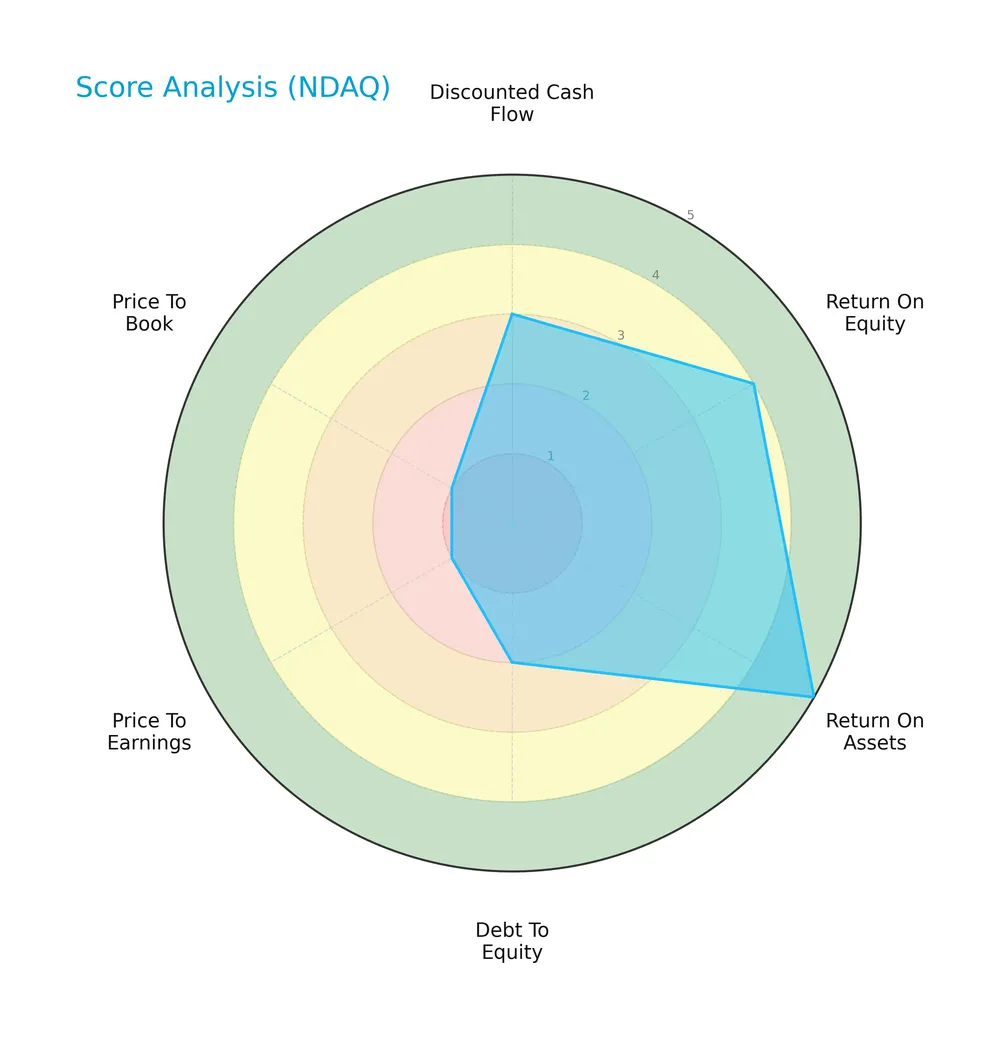
Nasdaq shows very favorable return on assets and favorable return on equity. However, its debt-to-equity and valuation metrics (P/E and P/B) score very unfavorably, indicating potential concerns in leverage and market pricing.
Analysis of the company’s bankruptcy risk
Nasdaq’s Altman Z-Score places it in the grey zone, signaling a moderate bankruptcy risk with some financial uncertainty:

Is the company in good financial health?
The Piotroski Score diagram highlights Nasdaq’s strong financial health, reflecting robust profitability, liquidity, and operational efficiency:

With a perfect Piotroski Score of 9, Nasdaq demonstrates very strong financial strength, suggesting solid fundamentals despite mixed valuations and leverage metrics.
Competitive Landscape & Sector Positioning
This section analyzes Nasdaq, Inc.’s position within the financial data and stock exchange sector. We will review strategic positioning, revenue segments, product offerings, and competitors. I will assess whether Nasdaq holds a competitive advantage over its peers.
Strategic Positioning
Nasdaq, Inc. maintains a diversified product portfolio spanning Capital Access Platforms, Market Technology, and Market Services, with 2024 revenues of $1.97B, $1.62B, and $3.77B respectively. Its geographic exposure is concentrated in the U.S. ($5.82B) but includes significant non-U.S. operations ($1.58B).
Revenue by Segment
This pie chart illustrates Nasdaq, Inc.’s revenue distribution by segment for the fiscal year 2024, highlighting the company’s diverse business streams and their relative scale.
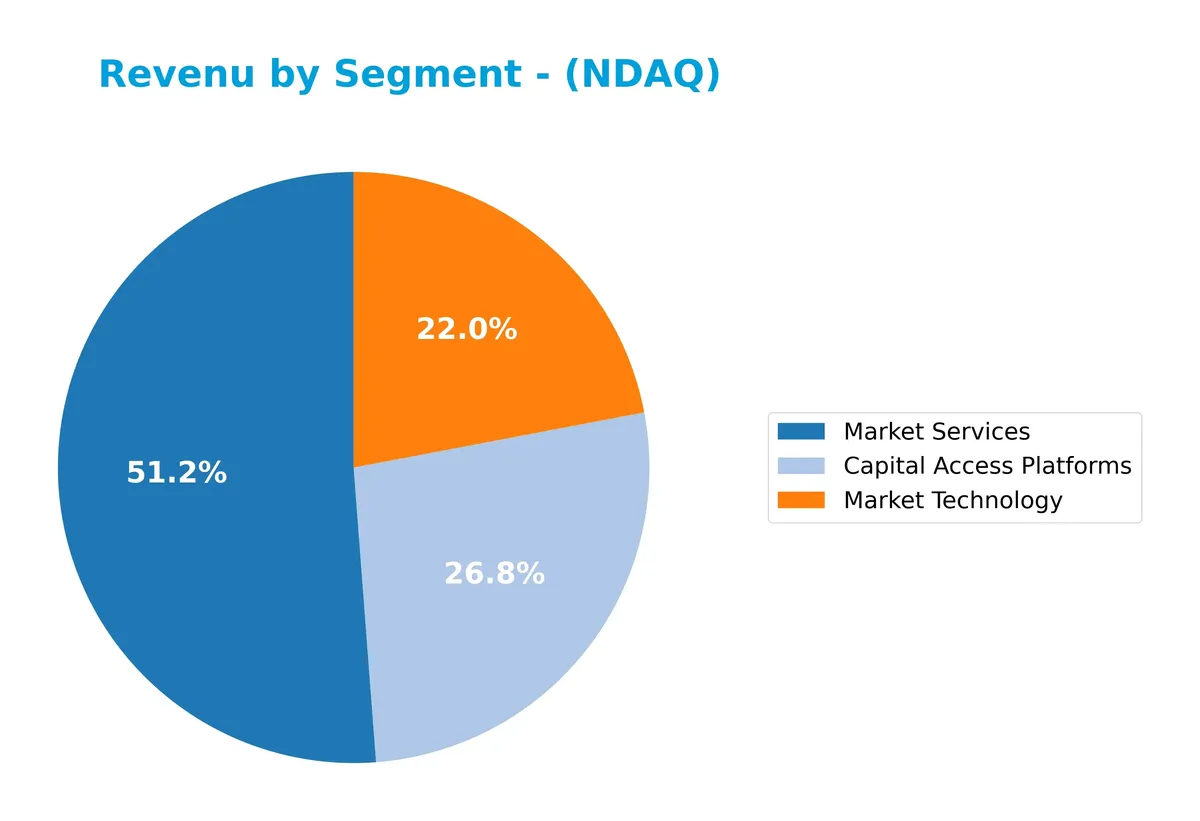
Nasdaq’s 2024 revenue centers on Market Services at $3.77B, the largest and most stable segment historically. Capital Access Platforms follow with $1.97B, showing steady growth over recent years. Market Technology contributed $1.62B, marking its return after absence in prior years. The mix signals a shift towards technology-driven solutions, while Market Services remains the core revenue driver with steady momentum but slight deceleration compared to prior peaks.
Key Products & Brands
Nasdaq, Inc. generates revenue through diverse financial market and technology services segments:
| Product | Description |
|---|---|
| Capital Access Platforms | Provides listing platforms and investor relations intelligence, supporting over 4,000 companies across multiple markets. |
| Market Technology | Offers SaaS solutions for market surveillance, anti-financial crime tools, and trading technology across asset classes. |
| Market Services | Operates equity and derivatives trading, clearing, settlement, and depository services across various asset classes. |
Nasdaq’s key offerings cover capital access, market infrastructure, and technology-driven compliance tools. These segments underpin its role as a global financial technology and exchange operator.
Main Competitors
There are 9 competitors in the Financial – Data & Stock Exchanges industry; below is the top 10 by market capitalization:
| Competitor | Market Cap. |
|---|---|
| S&P Global Inc. | 155.2B |
| CME Group Inc. | 97.2B |
| Intercontinental Exchange, Inc. | 91.7B |
| Moody’s Corporation | 89.7B |
| Coinbase Global, Inc. | 60.5B |
| Nasdaq, Inc. | 55.5B |
| MSCI Inc. | 43.7B |
| Cboe Global Markets, Inc. | 25.9B |
| FactSet Research Systems Inc. | 10.8B |
Nasdaq, Inc. ranks 6th among its peers, holding roughly 29% of the largest competitor’s market cap. It sits below both the average top 10 market cap of 70B and the sector median of 60.5B. Nasdaq’s market cap is 33.5% smaller than the next competitor above, Coinbase, indicating a meaningful gap in scale.
Comparisons with competitors
Check out how we compare the company to its competitors:
Does Nasdaq have a competitive advantage?
Nasdaq displays a slightly unfavorable competitive position, with a declining ROIC below its WACC, indicating it is currently shedding value and not generating excess returns on invested capital. Despite solid revenue and earnings growth, its profitability trend signals challenges in sustaining a durable economic moat.
The company’s Market Technology and Investment Intelligence segments offer SaaS solutions and market data services, opening opportunities in anti-financial crime tools and global market expansion. Continued product innovation and geographic diversification could enhance future competitive strength.
SWOT Analysis
This SWOT analysis highlights Nasdaq, Inc.’s key internal and external factors shaping its strategic outlook.
Strengths
- strong market position in financial technology
- diversified revenue streams across trading and data services
- robust net margin of 21.77%
Weaknesses
- declining ROIC vs. WACC indicates value erosion
- high P/E and P/B ratios suggest overvaluation
- modest asset turnover reflects operational inefficiency
Opportunities
- expanding non-US market presence
- growth in SaaS anti-financial crime solutions
- increasing demand for real-time market data
Threats
- intense competition in fintech and exchanges
- regulatory changes impacting trading platforms
- market volatility affecting transaction volumes
Nasdaq’s strengths in technology and market services support growth but declining profitability and valuation pose risks. Strategic focus should enhance capital efficiency and global expansion while managing regulatory and competitive pressures.
Stock Price Action Analysis
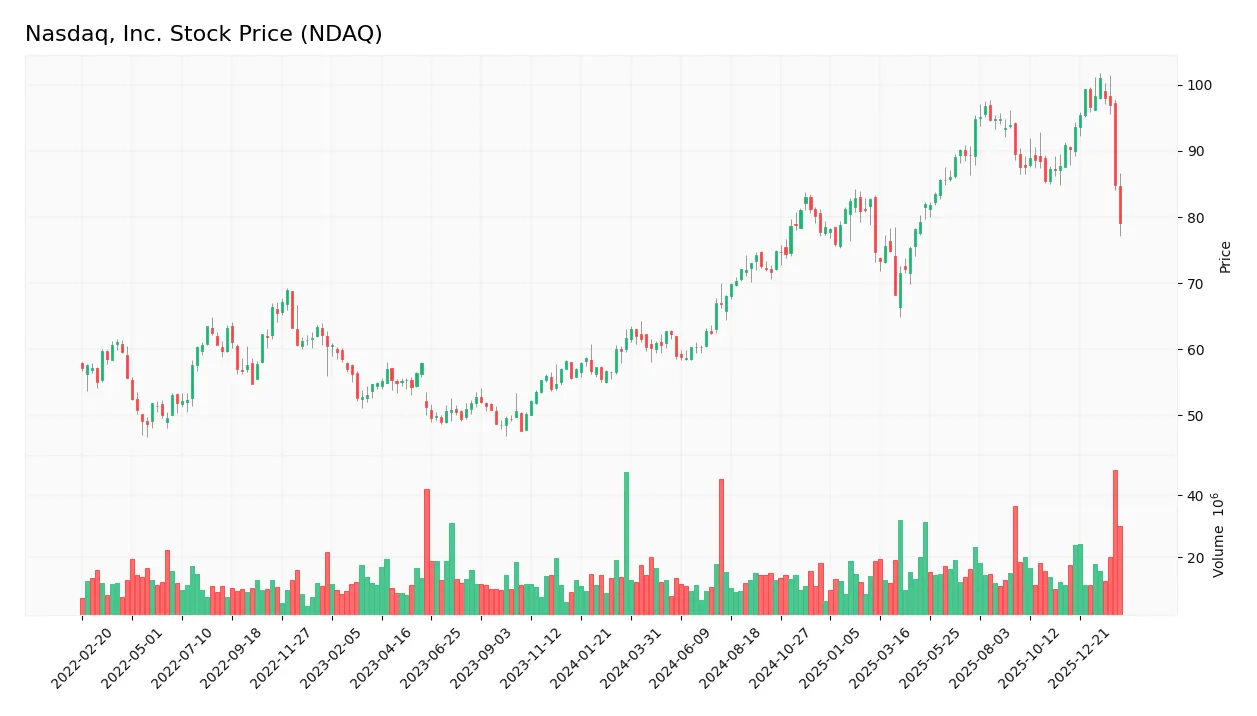
The following weekly chart illustrates Nasdaq, Inc.’s stock price movements over the past 100 weeks, highlighting key fluctuations and trend dynamics:
Trend Analysis
Over the past 12 months, Nasdaq, Inc.’s stock price rose 28.2%, indicating a bullish trend. The price peaked at 100.98 and bottomed at 58.6, with volatility shown by an 11.69 standard deviation. Recently, the trend decelerated, with a 13.1% price decline from November 2025 to February 2026, suggesting short-term weakness.
Volume Analysis
In the last three months, trading volume increased but showed slight seller dominance with buyers accounting for 42.6%. This shift suggests cautious sentiment and higher selling pressure, despite growing market participation. Total volume reached 1.8B, reflecting active engagement amid recent price weakness.
Target Prices
Analysts expect Nasdaq, Inc. shares to trade between $100 and $120, with a consensus target near $112.
| Target Low | Target High | Consensus |
|---|---|---|
| 100 | 120 | 111.8 |
This range reflects moderate optimism, suggesting upside potential from current levels while acknowledging market uncertainties.

Don’t Let Luck Decide Your Entry Point
Optimize your entry points with our advanced ProRealTime indicators. You’ll get efficient buy signals with precise price targets for maximum performance. Start outperforming now!
Analyst & Consumer Opinions
This section examines analyst ratings and consumer feedback to provide a balanced view of Nasdaq, Inc.’s market perception.
Stock Grades
Here are the latest verified grades for Nasdaq, Inc. from prominent financial institutions:
| Grading Company | Action | New Grade | Date |
|---|---|---|---|
| RBC Capital | Maintain | Outperform | 2026-01-30 |
| Morgan Stanley | Maintain | Overweight | 2026-01-30 |
| TD Cowen | Maintain | Hold | 2026-01-30 |
| JP Morgan | Maintain | Overweight | 2026-01-30 |
| Barclays | Maintain | Overweight | 2026-01-30 |
| Morgan Stanley | Maintain | Overweight | 2026-01-15 |
| TD Cowen | Maintain | Hold | 2026-01-14 |
| JP Morgan | Maintain | Overweight | 2026-01-12 |
| UBS | Maintain | Buy | 2026-01-12 |
| Barclays | Maintain | Overweight | 2026-01-08 |
The consensus reflects a generally positive outlook, with a majority of overweight and buy ratings. Notably, no firms downgraded their stance, indicating stable confidence in Nasdaq’s prospects.
Consumer Opinions
Consumer sentiment around Nasdaq, Inc. reflects a mix of admiration for its market leadership and concerns about service complexities.
| Positive Reviews | Negative Reviews |
|---|---|
| “Reliable platform with excellent data accuracy.” | “Customer support response times are slow.” |
| “Innovative technology keeps us ahead in trading.” | “The interface can be confusing for new users.” |
| “Strong global presence boosts confidence in stability.” | “High fees compared to smaller exchanges.” |
Overall, consumers praise Nasdaq’s technological edge and reliability. However, recurring complaints focus on user experience challenges and customer service delays, which could hinder broader adoption.
Risk Analysis
Below is a summary of key risks facing Nasdaq, Inc., assessing their likelihood and potential impact:
| Category | Description | Probability | Impact |
|---|---|---|---|
| Valuation Risk | Elevated P/E (31) and P/B (4.53) ratios suggest overvaluation | High | High |
| Market Volatility | Beta near 1.02 implies sensitivity to market swings | Medium | Medium |
| Leverage Risk | Debt-to-equity ratio of 0.81 indicates moderate leverage | Medium | Medium |
| Liquidity Risk | Current ratio at 1.01 signals tight short-term liquidity | Medium | Low |
| Regulatory Risk | Exposure to financial regulations and compliance costs | Medium | Medium |
| Operational Risk | Dependence on technology and data services for multiple markets | Low | High |
Nasdaq faces notable valuation risk with its P/E and P/B well above industry averages, raising concerns of a market correction. The company’s Altman Z-Score in the grey zone (2.41) reflects moderate financial distress risk. However, a perfect Piotroski score (9) demonstrates strong financial health. Market sensitivity and regulatory pressures remain persistent challenges that investors must monitor closely.
Should You Buy Nasdaq, Inc.?
Nasdaq, Inc. appears to be a moderately profitable company with a slightly unfavorable moat as it sheds value and faces declining ROIC. Despite a manageable debt profile, valuation metrics suggest caution. Overall, it could be seen as a solid B-rated investment with moderate financial strength.
Strength & Efficiency Pillars
Nasdaq, Inc. delivers solid operational efficiency with a net margin of 21.77% and an EBIT margin of 30.35%. Its return on equity stands at a moderate 14.63%, while ROIC at 8.26% slightly exceeds the WACC of 7.49%. Although the ROIC versus WACC ratio signals marginal value creation, the company’s strong revenue growth (11.05% in the past year) and net income growth (50.72% over five years) underscore robust profitability. Interest expense remains low at 1.07%, supporting sustained earnings power.
Weaknesses and Drawbacks
Nasdaq operates in the Altman Z-Score grey zone with a 2.41 score, indicating moderate bankruptcy risk that warrants caution. Valuation metrics reflect headwinds, as the P/E ratio of 30.98 and P/B of 4.53 suggest a premium market price vulnerable to correction. Leverage is moderate (debt-to-equity 0.81), but the current ratio of 1.01 signals tight near-term liquidity. Recent seller dominance (42.63% buyers vs. 57.37% sellers) and a 13.1% price decline over the last quarter highlight short-term market pressure.
Our Final Verdict about Nasdaq, Inc.
Nasdaq presents a fundamentally stable profile with favorable profitability and strong financial discipline, supported by a very strong Piotroski score of 9. Despite its long-term growth trajectory, the moderate solvency risk and recent seller pressure suggest a cautious approach. This profile might appear suitable for investors who can tolerate some near-term volatility but prefers waiting for clearer market signals before committing capital.
Disclaimer: This content is for informational purposes only and does not constitute financial, investment, or other professional advice. Investing in financial markets involves a significant risk of loss, and past performance is not indicative of future results.
Additional Resources
- Baader Bank Aktiengesellschaft Sells 54,069 Shares of Nasdaq, Inc. $NDAQ – MarketBeat (Feb 12, 2026)
- Nasdaq, Inc. Stock Is Off Its Highs, Despite Strong Results – Short Put Plays Work Here – Barchart.com (Feb 10, 2026)
- Nasdaq Inc (NDAQ) Q4 2025 Earnings Call Highlights: Record Revenue and Strategic Growth Initiatives – Yahoo Finance (Jan 29, 2026)
- $11.4 trillion in private funds gets new Nasdaq scorecard – Stock Titan (Feb 10, 2026)
- Nasdaq Announces Mid-Month Open Short Interest Positions in Nasdaq Stocks as of Settlement Date January 15, 2026 – Quantisnow (Feb 10, 2026)
For more information about Nasdaq, Inc., please visit the official website: nasdaq.com