Home > Analyses > Financial Services > MSCI Inc.
MSCI Inc. powers the backbone of global investment decisions, shaping how trillions are allocated daily. Its industry-leading indexes and advanced analytics guide asset managers, wealth advisors, and corporations worldwide. Renowned for innovation in ESG and climate risk tools, MSCI sets the standard for market transparency and risk management. As regulatory pressures and investor demand evolve, I question whether MSCI’s robust fundamentals still justify its premium valuation and growth prospects.

Table of contents
Business Model & Company Overview
MSCI Inc., founded in 1998 and headquartered in New York City, stands as a leader in the financial data and stock exchanges industry. It delivers a cohesive ecosystem of investment decision support tools across four segments: Indexes, Analytics, ESG and Climate, and Private Assets. This integrated approach helps asset owners, managers, and financial intermediaries optimize investment processes worldwide.
MSCI’s revenue engine balances recurring licensing fees from indexes with growing demand for analytics and ESG data services. Its global footprint spans the Americas, Europe, and Asia, catering to a diverse clientele including wealth managers and real estate professionals. The company’s robust competitive advantage lies in its deep data expertise, innovative solutions, and entrenched client relationships shaping the future of investment management.
Financial Performance & Fundamental Metrics
I will analyze MSCI Inc.’s income statement, key financial ratios, and dividend payout policy to assess its core financial health and shareholder returns.
Income Statement
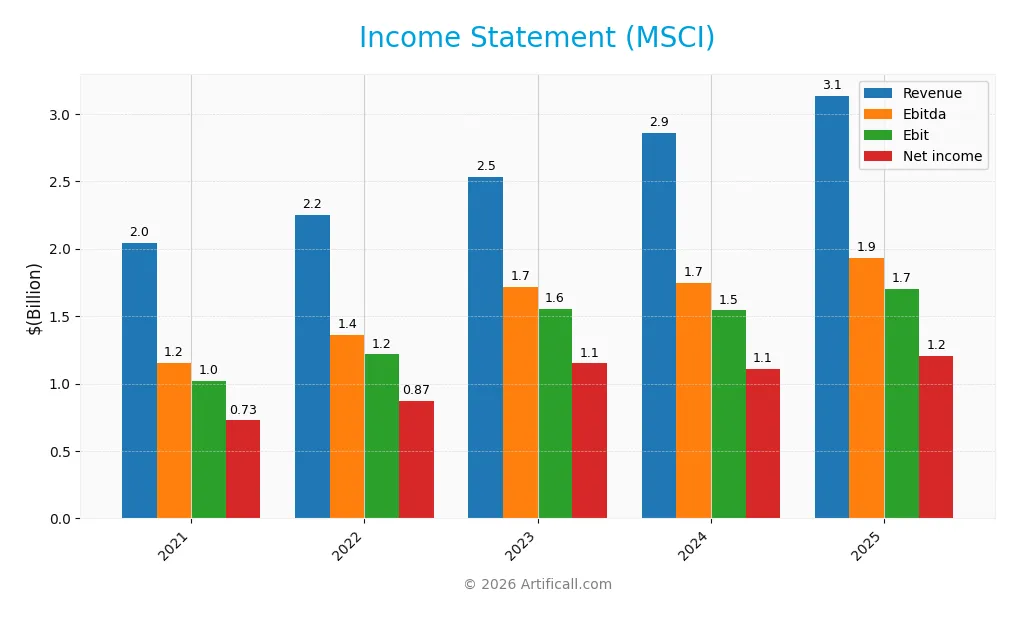
Below is MSCI Inc.’s income statement summary for the fiscal years 2021 through 2025, showing key profitability and expense metrics in USD.
| 2021 | 2022 | 2023 | 2024 | 2025 | |
|---|---|---|---|---|---|
| Revenue | 2.04B | 2.25B | 2.53B | 2.86B | 3.13B |
| Cost of Revenue | 359M | 404M | 447M | 514M | 550M |
| Operating Expenses | 612M | 637M | 698M | 813M | 871M |
| Gross Profit | 1.68B | 1.84B | 2.08B | 2.34B | 2.58B |
| EBITDA | 1.15B | 1.36B | 1.71B | 1.75B | 1.93B |
| EBIT | 1.02B | 1.22B | 1.56B | 1.54B | 1.70B |
| Interest Expense | 160M | 172M | 187M | 186M | 210M |
| Net Income | 726M | 871M | 1.15B | 1.11B | 1.20B |
| EPS | 8.80 | 10.78 | 14.45 | 14.09 | 15.58 |
| Filing Date | 2022-02-11 | 2023-02-10 | 2024-02-09 | 2025-02-07 | 2026-02-06 |
Income Statement Evolution
From 2021 to 2025, MSCI’s revenue expanded by 53%, reaching $3.13B in 2025. Net income grew 66% to $1.2B, reflecting strong operational leverage. Gross margin improved to 82.4%, while EBIT margin rose to 54.4%, signaling enhanced profitability. However, net margin slightly declined by 1.2% in the latest year despite overall margin improvement over the period.
Is the Income Statement Favorable?
MSCI’s 2025 income statement shows favorable fundamentals. Revenue grew nearly 10% year-over-year, with gross profit rising 10.4%. Operating expenses scaled proportionally, preserving margin strength. EBIT increased 10.5%, while EPS climbed 10.8%. Net margin at 38.4% remains robust, though slightly down from prior year. Interest expense at 6.7% is neutral, not pressuring profits. Overall, earnings quality is solid and sustainable.
Financial Ratios
The table below presents key financial ratios for MSCI Inc. over the past five fiscal years, illustrating profitability, liquidity, leverage, and valuation metrics:
| Ratios | 2021 | 2022 | 2023 | 2024 | 2025 |
|---|---|---|---|---|---|
| Net Margin | 36% | 39% | 45% | 39% | 38% |
| ROE | -444% | -86% | -155% | -118% | -45% |
| ROIC | 21% | 27% | 29% | 32% | 36% |
| P/E | 70 | 43 | 39 | 43 | 37 |
| P/B | -309 | -37 | -61 | -50 | -17 |
| Current Ratio | 1.71 | 1.40 | 0.93 | 0.85 | 0.90 |
| Quick Ratio | 1.71 | 1.40 | 0.93 | 0.85 | 0.90 |
| D/E | -27 | -5 | -6 | -5 | -2 |
| Debt-to-Assets | 79% | 93% | 84% | 86% | 113% |
| Interest Coverage | 6.7 | 7.0 | 7.4 | 8.2 | 8.2 |
| Asset Turnover | 0.37 | 0.45 | 0.46 | 0.52 | 0.55 |
| Fixed Asset Turnover | 9.7 | 12.5 | 14.8 | 15.0 | 15.7 |
| Dividend Yield | 0.60% | 0.99% | 0.98% | 1.08% | 1.26% |
Evolution of Financial Ratios
Over the period, MSCI’s Return on Equity (ROE) fluctuated significantly, ending at an unfavorable -45.29% in 2025. The Current Ratio consistently declined, dropping to an unfavorable 0.9 in 2025, signaling weaker liquidity. The Debt-to-Equity ratio showed a favorable negative value near -2.42, reflecting an unusual capital structure. Profitability margins remained strong and stable.
Are the Financial Ratios Favorable?
In 2025, MSCI’s profitability ratios are favorable, with a net margin of 38.36% and a ROIC of 35.6%, both well above typical benchmarks. Liquidity ratios are mixed: the current ratio is unfavorable at 0.9, while the quick ratio is neutral. Leverage is complex, with a favorable negative debt-to-equity but an unfavorable 112.54% debt-to-assets ratio. Overall, the ratios present a slightly favorable financial profile.
Shareholder Return Policy
MSCI Inc. maintains a dividend payout ratio near 46%, with dividend per share steadily rising to $7.21 in 2025. Its annual yield hovers around 1.26%, supported by share buybacks and strong free cash flow coverage, indicating disciplined capital allocation.
This distribution approach balances shareholder returns with financial stability. While the payout is moderate, free cash flow comfortably covers dividends and buybacks, suggesting sustainable long-term value creation without overextending resources.
Score analysis
Below is a radar chart presenting MSCI Inc.’s key financial scores across valuation, profitability, and leverage metrics:
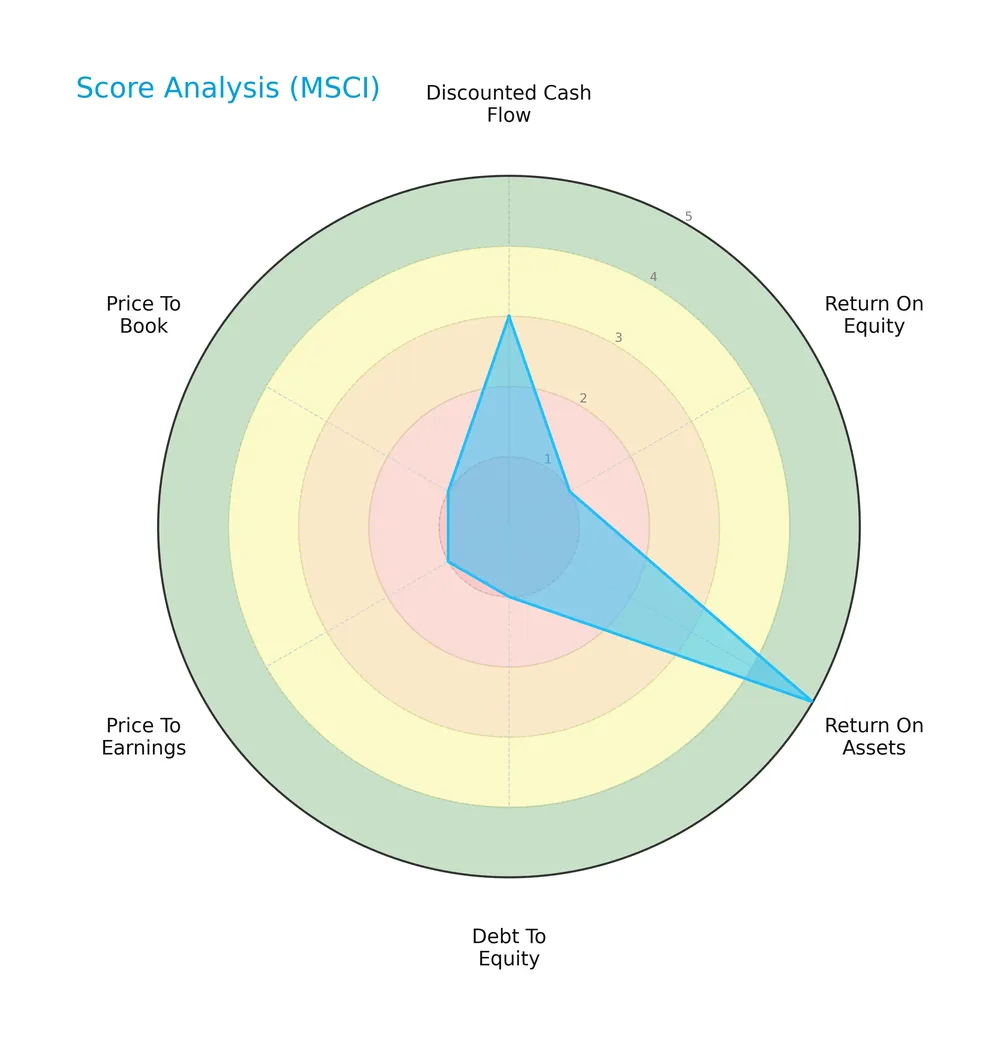
MSCI scores moderately on discounted cash flow but poorly on return on equity, debt-to-equity, price-to-earnings, and price-to-book ratios. Return on assets remains very favorable, indicating efficient asset use despite valuation and leverage concerns.
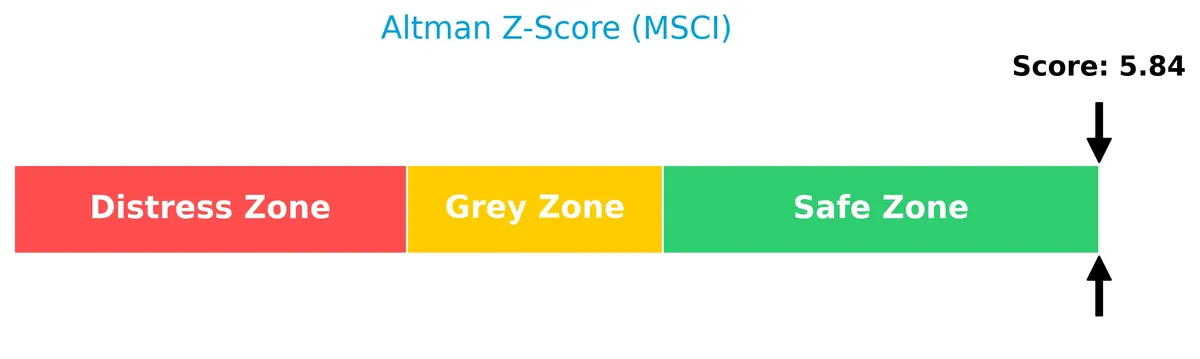
Analysis of the company’s bankruptcy risk
The Altman Z-Score places MSCI firmly in the safe zone, indicating a very low likelihood of bankruptcy:
Is the company in good financial health?
The Piotroski Score diagram highlights MSCI’s strong financial health based on profitability and efficiency metrics:

With a Piotroski Score of 8, MSCI demonstrates robust fundamentals and operational strength, signaling solid financial resilience in its sector.
Competitive Landscape & Sector Positioning
This section analyzes MSCI Inc.’s strategic positioning within the financial data and stock exchanges sector. We will review its revenue by segment, key products, and main competitors. The analysis aims to determine whether MSCI holds a competitive advantage over peers in this industry.
Strategic Positioning
MSCI Inc. maintains a diversified product portfolio across Index, Analytics, ESG and Climate, and Private Assets segments. Geographically, it generates substantial revenue from Americas and EMEA regions, reflecting a balanced exposure across developed and emerging markets, supporting resilience amid global market shifts.
Revenue by Segment
This pie chart displays MSCI Inc.’s revenue distribution by segment for the fiscal year 2024, highlighting contributions from Index, Analytics, ESG and Climate, and All Other Segments.
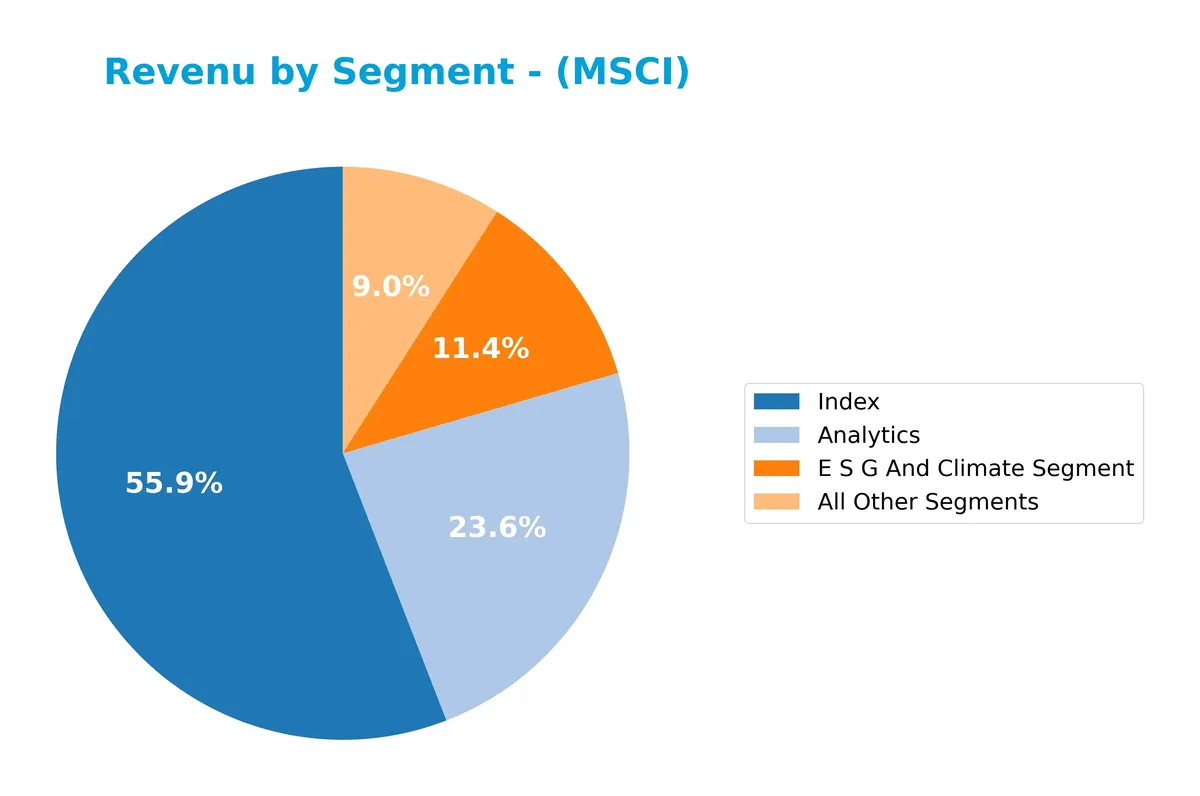
In 2024, the Index segment leads with $1.6B, continuing its role as the primary revenue driver. Analytics follows at $675M, showing steady growth over recent years. The ESG and Climate segment, now at $327M, reflects MSCI’s strategic pivot toward sustainability solutions. All Other Segments contribute $258M, indicating diversification but less scale. The recent acceleration in ESG revenue signals rising investor focus on climate risk analytics.
Key Products & Brands
The following table outlines MSCI Inc.’s core product segments and their key descriptions:
| Product | Description |
|---|---|
| Index | Provides indexes for ETFs, mutual funds, derivatives, benchmarking, portfolio construction, rebalancing, asset allocation, and licenses GICS and GICS Direct. |
| Analytics | Offers risk management, performance attribution, portfolio management tools, managed services, and HedgePlatform for hedge fund risk evaluation across asset classes. |
| ESG and Climate Segment | Delivers ESG data, ratings, research, and tools to assess long-term risk and return, including climate impact analysis and regulatory navigation for institutional investors. |
| All Other Private Assets | Supplies real estate market data, benchmarks, return analytics, climate assessments, and business intelligence for private capital investors, owners, managers, developers, and brokers. |
MSCI’s product portfolio spans critical investment decision tools, integrating indexes, risk analytics, ESG insights, and private asset data. This diversity supports various client needs across asset management and real estate sectors.
Main Competitors
The Financial Services sector features 9 competitors, with the table below showing the top 10 leaders by market capitalization:
| Competitor | Market Cap. |
|---|---|
| S&P Global Inc. | 155.2B |
| CME Group Inc. | 97.2B |
| Intercontinental Exchange, Inc. | 91.7B |
| Moody’s Corporation | 89.7B |
| Coinbase Global, Inc. | 60.5B |
| Nasdaq, Inc. | 55.5B |
| MSCI Inc. | 43.7B |
| Cboe Global Markets, Inc. | 25.9B |
| FactSet Research Systems Inc. | 10.8B |
MSCI Inc. ranks 7th among its peers, holding 27% of the market cap of the sector leader, S&P Global Inc. The company sits below both the average market cap of the top 10 (70B) and the sector median (60.5B). MSCI maintains a 32.45% gap below its next closest competitor, Nasdaq, indicating a moderate distance from rivals above.
Comparisons with competitors
Check out how we compare the company to its competitors:
Does MSCI have a competitive advantage?
MSCI demonstrates a strong competitive advantage, reflected in a ROIC 26.7% above WACC and a sustained growth in ROIC over 2021-2025. This indicates efficient capital use and consistent value creation.
The company’s diverse segments, including ESG and Climate analytics, position it well for future growth. Expanding product offerings and geographic reach support new market opportunities ahead.
SWOT Analysis
This SWOT analysis highlights MSCI Inc.’s key strategic factors to guide investment decisions.
Strengths
- High gross margin at 82%
- Strong ROIC of 35.6% well above WACC
- Diverse global revenue streams
Weaknesses
- Low current ratio at 0.9 signals liquidity risk
- Negative ROE at -45.3% concerns profitability quality
- Elevated debt to assets at 113% raises leverage alarms
Opportunities
- Growing ESG and climate product demand
- Expansion in emerging markets
- Increasing reliance on data analytics in finance
Threats
- Intense competition in financial data services
- Regulatory changes impacting ESG frameworks
- Market volatility affecting client investment flows
MSCI demonstrates a robust moat with strong profitability and growth avenues. However, leverage and liquidity weaknesses require cautious capital management to sustain its competitive edge.
Stock Price Action Analysis
The weekly stock price chart illustrates MSCI Inc.’s price movements and volatility over the past 12 months:
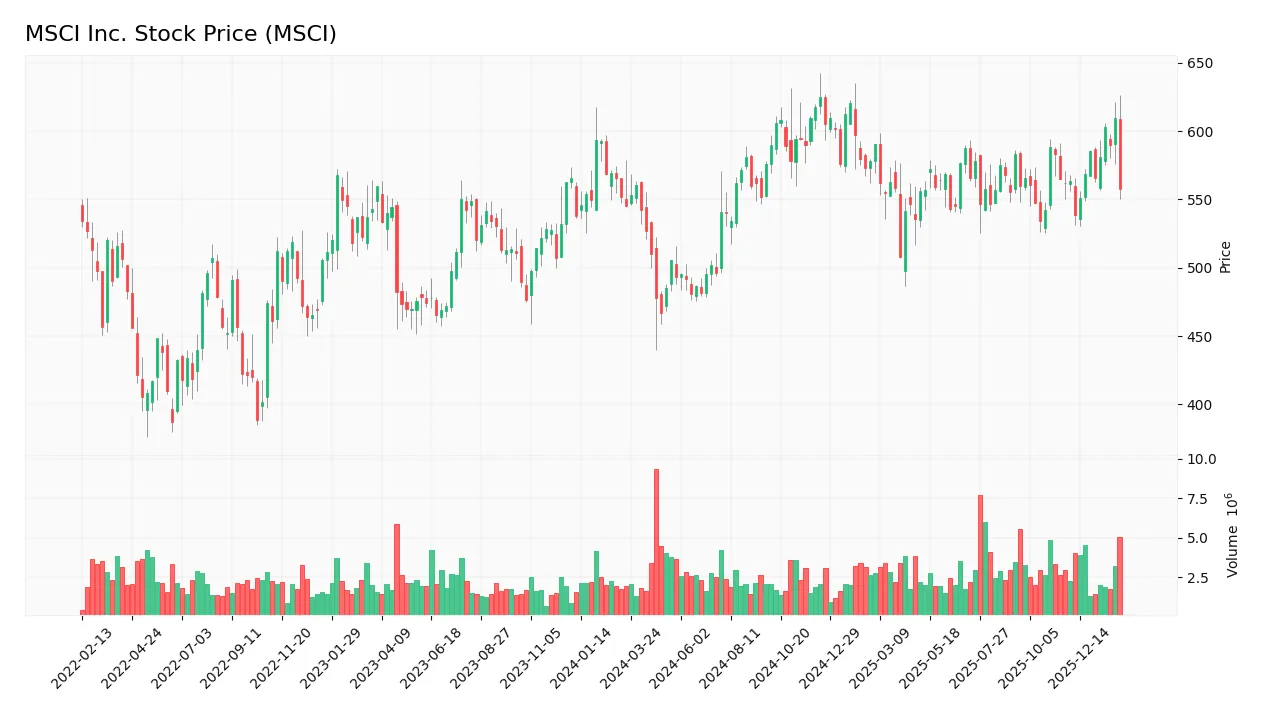
Trend Analysis
Over the past 12 months, MSCI’s stock price rose 2.39%, indicating a bullish trend with acceleration. The highest price reached 625.1, the lowest 467.04, and volatility measured by a 35.43 standard deviation remains significant. A recent three-month period shows a slight -0.75% decline, suggesting a short-term neutral trend.
Volume Analysis
Trading volume trends upward, with total volume at 320M shares. Recent activity shows buyer dominance at 55.73%, reflecting moderately strong buying interest and increased market participation over the last three months. This suggests positive investor sentiment despite minor recent price softness.
Target Prices
Analysts set a clear target consensus for MSCI Inc., reflecting confidence in the stock’s growth potential.
| Target Low | Target High | Consensus |
|---|---|---|
| 618 | 715 | 664.5 |
The target range from 618 to 715 indicates moderate upside potential. The consensus of 664.5 suggests steady appreciation expected by the analyst community.

Don’t Let Luck Decide Your Entry Point
Optimize your entry points with our advanced ProRealTime indicators. You’ll get efficient buy signals with precise price targets for maximum performance. Start outperforming now!
Analyst & Consumer Opinions
This section examines MSCI Inc.’s analyst ratings alongside consumer feedback to provide a balanced evaluation.
Stock Grades
Here are the latest verified stock grades from recognized financial institutions for MSCI Inc.:
| Grading Company | Action | New Grade | Date |
|---|---|---|---|
| Evercore ISI Group | Maintain | Outperform | 2026-01-29 |
| Wells Fargo | Maintain | Equal Weight | 2026-01-29 |
| Wells Fargo | Maintain | Equal Weight | 2026-01-14 |
| JP Morgan | Maintain | Overweight | 2025-10-29 |
| UBS | Maintain | Buy | 2025-10-29 |
| Wells Fargo | Maintain | Equal Weight | 2025-10-29 |
| Barclays | Maintain | Overweight | 2025-10-29 |
| Evercore ISI Group | Maintain | Outperform | 2025-10-14 |
| JP Morgan | Maintain | Overweight | 2025-09-10 |
| Wells Fargo | Maintain | Equal Weight | 2025-07-23 |
Grades reveal a consistent pattern of stability, with most firms maintaining their positive or neutral ratings. The consensus leans toward a buy rating, reflecting moderate optimism among analysts.
Consumer Opinions
Consumer sentiment around MSCI Inc. reveals a mix of admiration for its data precision and criticism over service accessibility.
| Positive Reviews | Negative Reviews |
|---|---|
| Renowned for accurate and comprehensive data sets. | Customer support response times can lag. |
| Platform offers robust analytics tools that enhance decision-making. | Pricing is considered steep by smaller firms. |
| Frequent updates keep the data relevant and timely. | User interface complexity challenges new users. |
Overall, MSCI earns praise for its reliable data and powerful analytics. However, customers often cite high costs and occasional service delays as key drawbacks.
Risk Analysis
Below is a summary table highlighting key risks facing MSCI Inc. as of 2026:
| Category | Description | Probability | Impact |
|---|---|---|---|
| Financial Leverage | Debt-to-assets ratio exceeds 112%, indicating potential over-leverage and solvency concerns. | High | High |
| Profitability | Negative return on equity (-45.29%) signals challenges in generating shareholder returns. | Medium | High |
| Liquidity | Current ratio at 0.9 suggests tight short-term liquidity, risking operational flexibility. | Medium | Medium |
| Valuation | Elevated P/E ratio (36.82) may limit upside amid market corrections. | Medium | Medium |
| Market Volatility | Beta of 1.28 indicates higher sensitivity to market swings, increasing share price volatility. | High | Medium |
The most pressing risks are MSCI’s high leverage and negative ROE, which contrast with its strong Altman Z-score and Piotroski score. This mixed profile requires cautious monitoring. Recent market turbulence and interest rate fluctuations exacerbate liquidity and valuation pressures.
Should You Buy MSCI Inc.?
MSCI appears to be delivering robust value creation supported by a durable moat with a growing ROIC well above WACC. Despite a substantial leverage profile and mixed rating signals, its overall financial health could be seen as very favorable with a C+ rating.
Strength & Efficiency Pillars
MSCI Inc. demonstrates robust profitability with a net margin of 38.36% and an EBIT margin of 54.37%, signaling strong operational control. The company posts an impressive ROIC of 35.6%, well above its WACC of 8.94%, confirming that MSCI is a clear value creator. Despite a negative ROE at -45.29%, a high Altman Z-Score of 5.84 places MSCI solidly in the safe zone, underscoring financial stability. Its growing ROIC trend reinforces a sustainable competitive advantage.
Weaknesses and Drawbacks
MSCI’s valuation metrics raise concerns, with a high P/E ratio of 36.82 indicating an expensive premium that may pressure returns. The current ratio stands at 0.9, below the ideal threshold, signaling potential liquidity constraints. Although debt-to-equity is favorable at -2.42, the debt-to-assets ratio at 112.54% flags an elevated leverage risk. Market activity shows nearly balanced buyer-seller volumes, but the slight buyer dominance of 55.73% suggests cautious optimism rather than robust demand.
Our Final Verdict about MSCI Inc.
The long-term fundamentals of MSCI appear favorable, driven by strong profitability and value creation. The bullish overall trend and increasing volume support positive momentum. However, the recent slight buyer dominance advises a measured approach. This profile may appear attractive for long-term exposure but suggests prudence to await stronger market conviction before committing significant capital.
Disclaimer: This content is for informational purposes only and does not constitute financial, investment, or other professional advice. Investing in financial markets involves a significant risk of loss, and past performance is not indicative of future results.
Additional Resources
- MSCI Inc. SEC 10-K Report – TradingView (Feb 06, 2026)
- Strategy: Premium Is Breaking Despite The MSCI News (NASDAQ:MSTR) – Seeking Alpha (Feb 06, 2026)
- Index provider MSCI has no comment following Indonesia meeting – Reuters (Feb 03, 2026)
- Two chances to hear MSCI’s CFO live from investor conferences – stocktitan.net (Feb 04, 2026)
- Thrivent Financial for Lutherans Decreases Stake in MSCI Inc $MSCI – MarketBeat (Feb 05, 2026)
For more information about MSCI Inc., please visit the official website: msci.com