Home > Analyses > Technology > Motorola Solutions, Inc.
Motorola Solutions powers critical communications that keep communities safe and businesses connected worldwide. It dominates the communication equipment sector with cutting-edge radios, video security, and integrated software solutions tailored for public safety and commercial users. Renowned for innovation and reliability, it transforms how organizations manage mobile workforces and secure assets. As the market evolves, I question whether Motorola Solutions’ strong fundamentals still justify its premium valuation and growth outlook.

Table of contents
Business Model & Company Overview
Motorola Solutions, Inc., founded in 1928 and headquartered in Chicago, dominates the communication equipment sector. It delivers a cohesive ecosystem of mission-critical communications and analytics, integrating devices, infrastructure, and software that empower government, public safety, and commercial clients. The company’s portfolio ranges from two-way radios to advanced video security systems, reflecting a core mission to enhance operational command and safety worldwide.
The company’s revenue engine balances its Products and Systems Integration segment with its Software and Services division. This mix drives recurring income through hardware sales, system integration, software updates, and cybersecurity services across the Americas, Europe, and Asia. Motorola Solutions leverages its competitive advantage in secure, reliable communication networks to shape the future of public safety and enterprise communications.
Financial Performance & Fundamental Metrics
I analyze Motorola Solutions, Inc.’s income statement, key financial ratios, and dividend payout policy to assess its operational efficiency and shareholder returns.
Income Statement
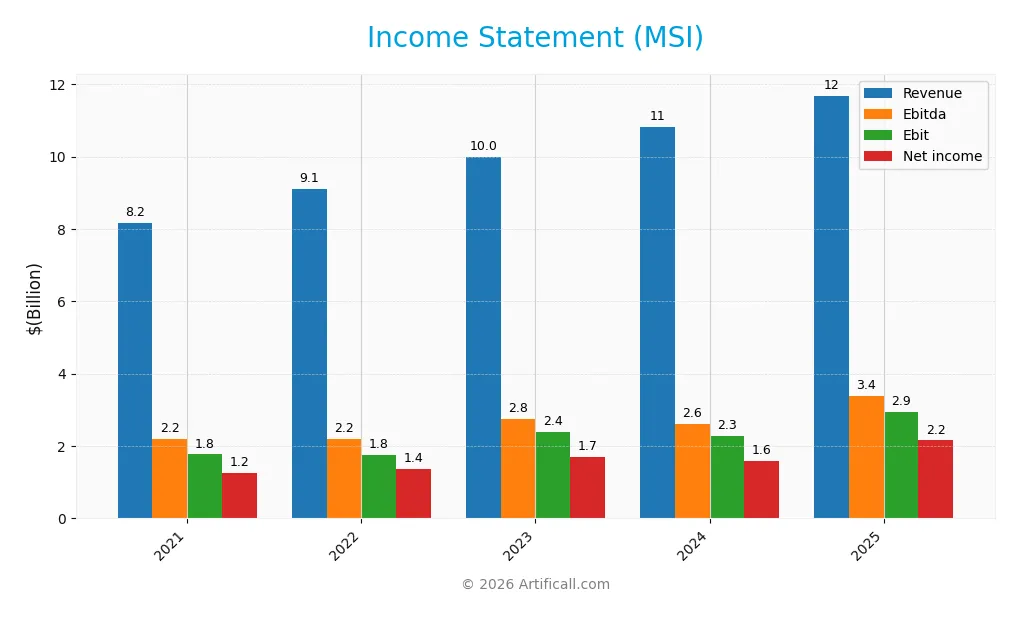
This table summarizes Motorola Solutions, Inc.’s key income statement metrics for fiscal years 2021 through 2025, reported in USD.
| 2021 | 2022 | 2023 | 2024 | 2025 | |
|---|---|---|---|---|---|
| Revenue | 8.17B | 9.11B | 9.98B | 10.82B | 11.68B |
| Cost of Revenue | 4.13B | 4.88B | 5.01B | 5.31B | 5.65B |
| Operating Expenses | 2.37B | 2.57B | 2.68B | 2.82B | 2.84B |
| Gross Profit | 4.04B | 4.23B | 4.97B | 5.51B | 6.04B |
| EBITDA | 2.21B | 2.20B | 2.75B | 2.60B | 3.37B |
| EBIT | 1.77B | 1.76B | 2.40B | 2.27B | 2.95B |
| Interest Expense | 215M | 240M | 249M | 295M | 302M |
| Net Income | 1.25B | 1.36B | 1.71B | 1.58B | 2.15B |
| EPS | 7.36 | 8.14 | 10.23 | 9.45 | 12.93 |
| Filing Date | 2022-02-16 | 2023-02-16 | 2024-02-15 | 2025-02-14 | 2026-02-12 |
Income Statement Evolution
Motorola Solutions’ revenue rose by 43% from 2021 to 2025, with an 8% increase in the latest year. Net income surged 73% over five years, driven by expanding margins. Gross margin improved to 51.7%, reflecting effective cost control. Operating expenses grew proportionally, maintaining stable operating leverage and supporting margin expansion.
Is the Income Statement Favorable?
In 2025, Motorola reported $11.7B revenue and $2.15B net income, yielding an 18.4% net margin, which is favorable within the sector. EBIT margin reached 25.2%, boosted by disciplined cost management and R&D investment. Interest expense remains low at 2.6% of revenue, enhancing profitability. Overall, fundamentals indicate strong operational efficiency and robust growth.
Financial Ratios
The table below summarizes key financial ratios for Motorola Solutions, Inc. over the last five fiscal years, highlighting profitability, liquidity, leverage, and valuation metrics:
| Ratios | 2021 | 2022 | 2023 | 2024 | 2025 |
|---|---|---|---|---|---|
| Net Margin | 15.2% | 15.0% | 17.1% | 14.6% | 18.4% |
| ROE | -31.1% | 11.8% | 236.0% | 92.6% | 89.4% |
| ROIC | 16.3% | 17.9% | 20.3% | 21.6% | 16.1% |
| P/E | 36.9 | 31.7 | 30.6 | 48.9 | 29.6 |
| P/B | -1149 | 372 | 72.2 | 45.3 | 26.5 |
| Current Ratio | 1.33 | 1.15 | 1.00 | 1.28 | 1.04 |
| Quick Ratio | 1.14 | 0.92 | 0.85 | 1.13 | 0.87 |
| D/E | -153 | 56.5 | 9.05 | 3.85 | 4.19 |
| Debt-to-Assets | 50.3% | 51.1% | 49.1% | 44.9% | 52.1% |
| Interest Coverage | 7.75 | 6.92 | 9.21 | 9.11 | 9.76 |
| Asset Turnover | 0.67 | 0.71 | 0.75 | 0.74 | 0.60 |
| Fixed Asset Turnover | 5.74 | 6.45 | 6.84 | 6.97 | 6.69 |
| Dividend Yield | 1.05% | 1.23% | 1.13% | 0.85% | 1.14% |
Evolution of Financial Ratios
From 2021 to 2025, Motorola Solutions’ Return on Equity (ROE) surged dramatically, peaking at 89.38% in 2025. The Current Ratio fluctuated modestly, remaining near 1.0, signaling stable liquidity. Meanwhile, the Debt-to-Equity ratio declined from extreme levels but stayed elevated at 4.19 in 2025, highlighting persistent leverage concerns. Profitability improved steadily over the period.
Are the Financial Ratios Fovorable?
In 2025, profitability metrics like net margin (18.44%) and ROE (89.38%) are favorable, reflecting strong earnings efficiency. Liquidity ratios (current 1.04, quick 0.87) are neutral, indicating adequate short-term coverage. However, leverage ratios remain unfavorable, with debt-to-equity at 4.19 and debt-to-assets over 52%, suggesting high financial risk. Market valuation ratios (P/E 29.65, P/B 26.5) are also unfavorable, tempering the overall slightly favorable financial profile.
Shareholder Return Policy
Motorola Solutions, Inc. maintains a consistent dividend payment with a payout ratio around 34%, supporting a 1.14% yield in 2025. Dividends per share have grown steadily, backed by free cash flow coverage near 90%, indicating sustainable distributions.
The company also engages in share buybacks, complementing its dividend policy. This balanced approach of dividends and buybacks supports sustainable long-term value creation, assuming stable cash flows and prudent capital allocation continue.
Score analysis
The radar chart below illustrates key valuation and financial performance scores for Motorola Solutions, Inc.:
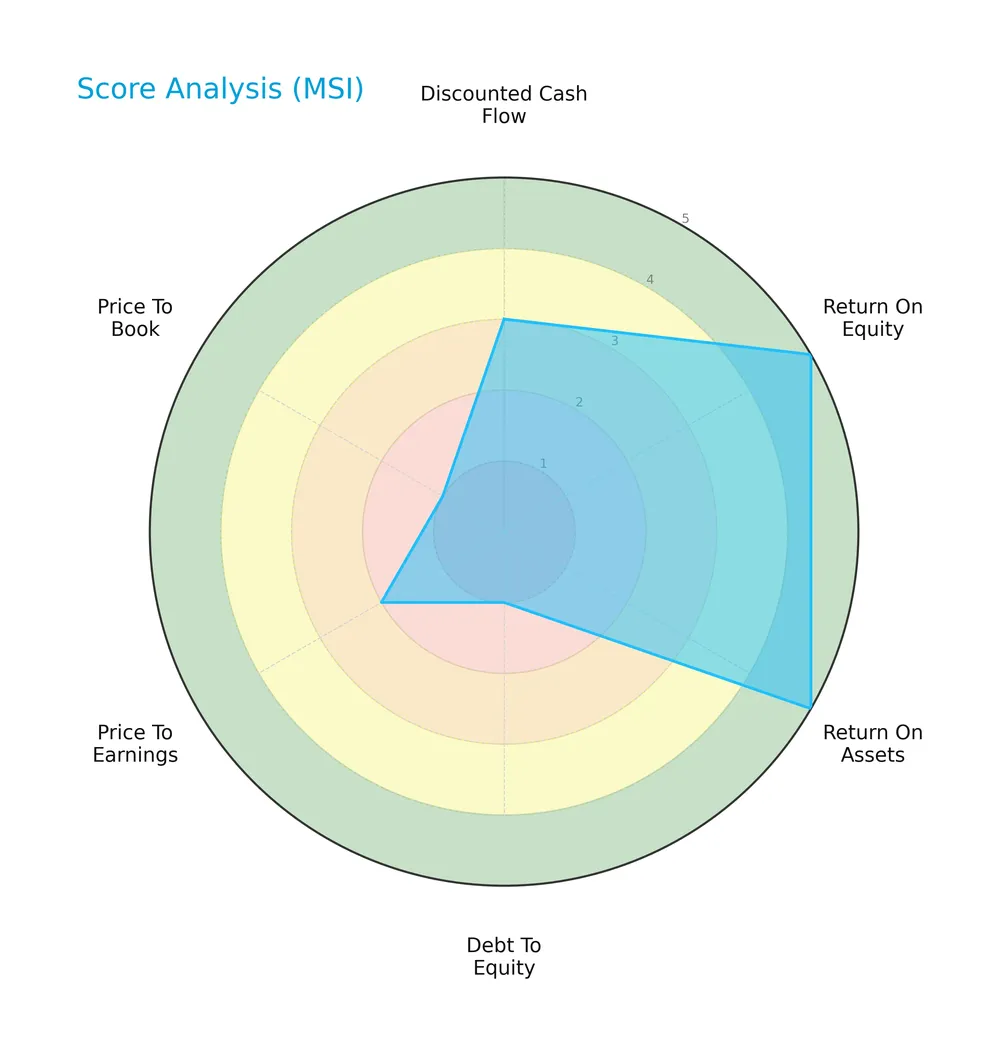
Motorola Solutions scores very favorably on return on equity and assets at 5 each, indicating strong profitability. However, weak debt to equity and price to book scores of 1 reflect high leverage and valuation concerns. Overall, scores suggest mixed fundamentals.
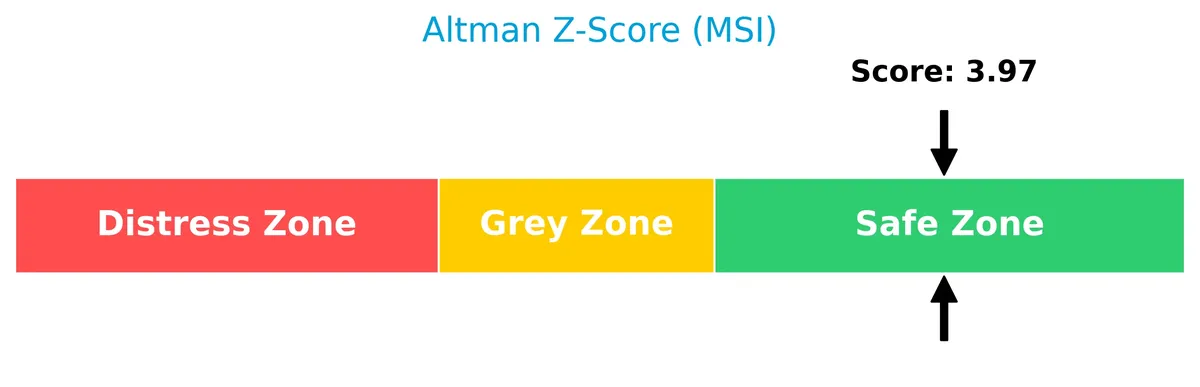
Analysis of the company’s bankruptcy risk
The Altman Z-Score places Motorola Solutions firmly in the safe zone, indicating a low risk of bankruptcy:
Is the company in good financial health?
The following Piotroski diagram shows Motorola Solutions’ financial strength assessment:

With a Piotroski Score of 6, the company demonstrates average financial health, signaling moderate strength across profitability, leverage, and efficiency metrics.
Competitive Landscape & Sector Positioning
This section analyzes Motorola Solutions, Inc.’s strategic positioning, revenue segments, and key products within the communication equipment sector. I will assess whether the company holds a competitive advantage over its main competitors through its portfolio and market reach.
Strategic Positioning
Motorola Solutions, Inc. maintains a focused portfolio, splitting revenue between Products (6.45B) and Services (4.36B) in 2024. Geographically, it concentrates primarily in North America (7.82B), with a smaller but stable international presence (3B), emphasizing mission-critical communications and analytics.
Revenue by Segment
This pie chart illustrates Motorola Solutions’ revenue breakdown by product and service segments for the fiscal year 2024.
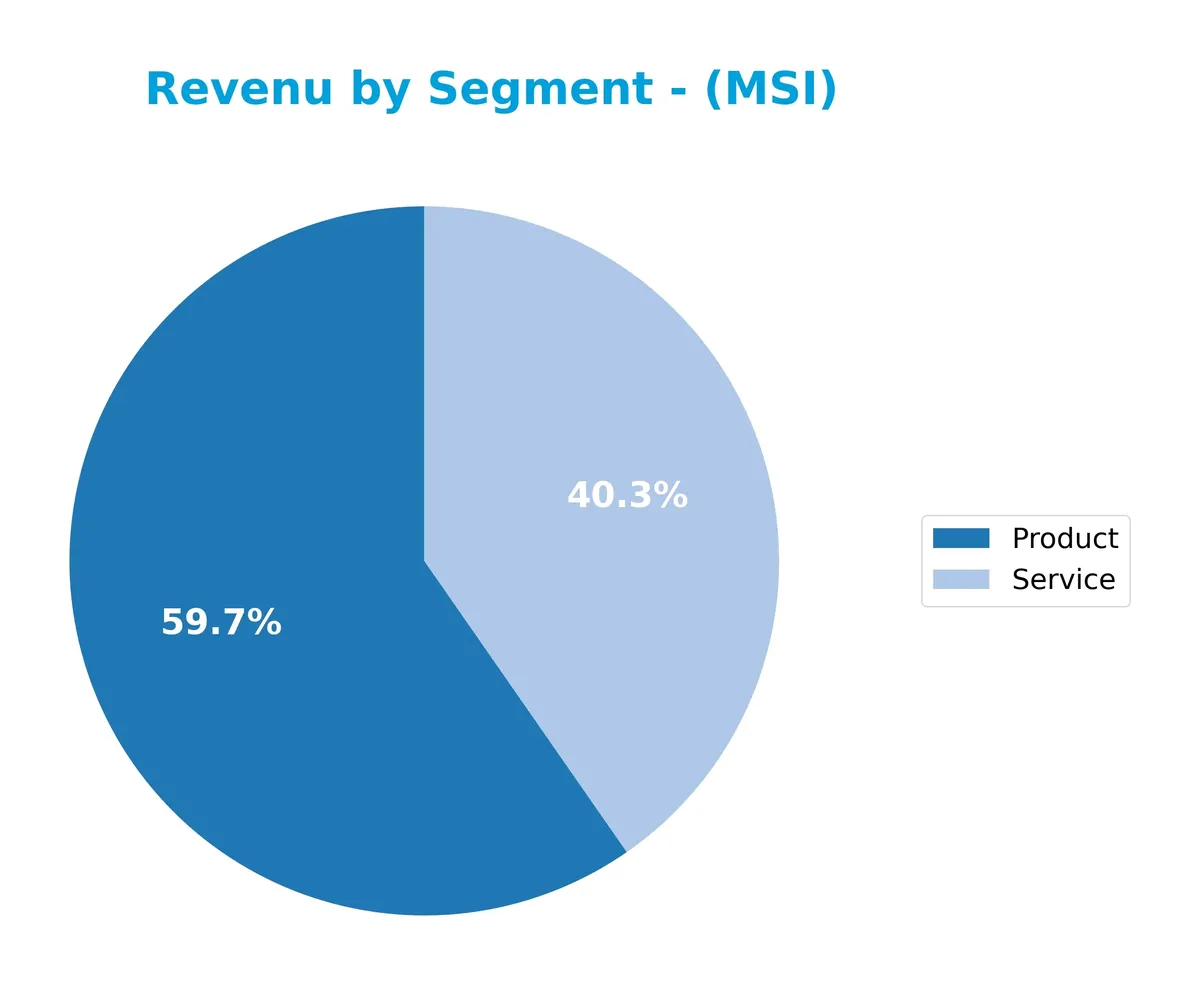
Motorola Solutions’ revenue growth primarily stems from its Product segment, which reached $6.45B in 2024, up from $5.81B in 2023. Services also contribute significantly, with $4.36B in 2024, showing steady expansion. The company’s focus on product innovation drives top-line acceleration, while services provide recurring revenue stability. This balance reduces concentration risk and supports sustainable growth.
Key Products & Brands
Motorola Solutions’ key offerings span mission-critical communication devices and software solutions for government and commercial clients:
| Product | Description |
|---|---|
| Infrastructure & Devices | Land mobile radio communications, including two-way portable and vehicle-mounted radios, base stations, repeaters. |
| Video Security Solutions | Fixed and mobile video cameras, video analytics, network management hardware and software, access control systems. |
| Systems Integration | Implementation and integration of communication and security systems for public safety and commercial use. |
| Software & Services | Public safety and enterprise command center software, unified communications, cybersecurity, and technical support. |
Motorola Solutions combines hardware and software to serve public safety and commercial sectors. Its product portfolio emphasizes secure, efficient communication and video security infrastructure, augmented by software and service solutions that support ongoing operations and cybersecurity.
Main Competitors
There are 7 competitors in total, with the table below listing the top 7 leaders by market capitalization:
| Competitor | Market Cap. |
|---|---|
| Cisco Systems, Inc. | 300.4B |
| Motorola Solutions, Inc. | 63.5B |
| Nokia Oyj | 34.9B |
| Hewlett Packard Enterprise Company | 32.0B |
| Credo Technology Group Holding Ltd | 24.7B |
| Zebra Technologies Corporation | 12.6B |
| AudioCodes Ltd. | 255M |
Motorola Solutions ranks 2nd among its competitors, with a market cap roughly 25% of the leader, Cisco Systems. The company sits above both the average market cap of the top 10 and the median for the sector. It holds a significant gap of +297.82% above its next closest rival, Nokia Oyj, highlighting its strong relative scale.
Comparisons with competitors
Check out how we compare the company to its competitors:
Does MSI have a competitive advantage?
Motorola Solutions, Inc. presents a competitive advantage, generating returns above its cost of capital, indicating value creation despite a slight decline in profitability. Its robust gross margin of 51.66% and net margin of 18.44% support its strong position in communication equipment.
Looking forward, MSI benefits from its diversified portfolio across products, systems integration, and software, serving government and commercial sectors. Growth opportunities lie in expanding its video security and analytics solutions internationally and enhancing software services amid rising demand for cybersecurity and unified communications.
SWOT Analysis
This analysis highlights Motorola Solutions’ core strengths, weaknesses, growth opportunities, and risks to guide strategic focus.
Strengths
- Strong market position in mission-critical communications
- High ROE of 89% and ROIC above WACC
- Consistent revenue and profit growth
Weaknesses
- Elevated debt-to-equity ratio of 4.19
- High valuation multiples (PE 29.65, PB 26.5)
- Declining ROIC trend signals margin pressure
Opportunities
- Expansion in international markets
- Growth in software and cybersecurity segments
- Rising demand for public safety communications
Threats
- Intense competition in communication equipment
- Regulatory risks in government contracts
- Economic cycles affecting capital spending
Motorola Solutions combines robust profitability with solid market positioning but faces leverage and valuation challenges. Its strategy should balance growth investments with prudent capital structure management.
Stock Price Action Analysis
The weekly stock chart for Motorola Solutions, Inc. illustrates a significant price gain with clear acceleration in upward momentum over the past year:
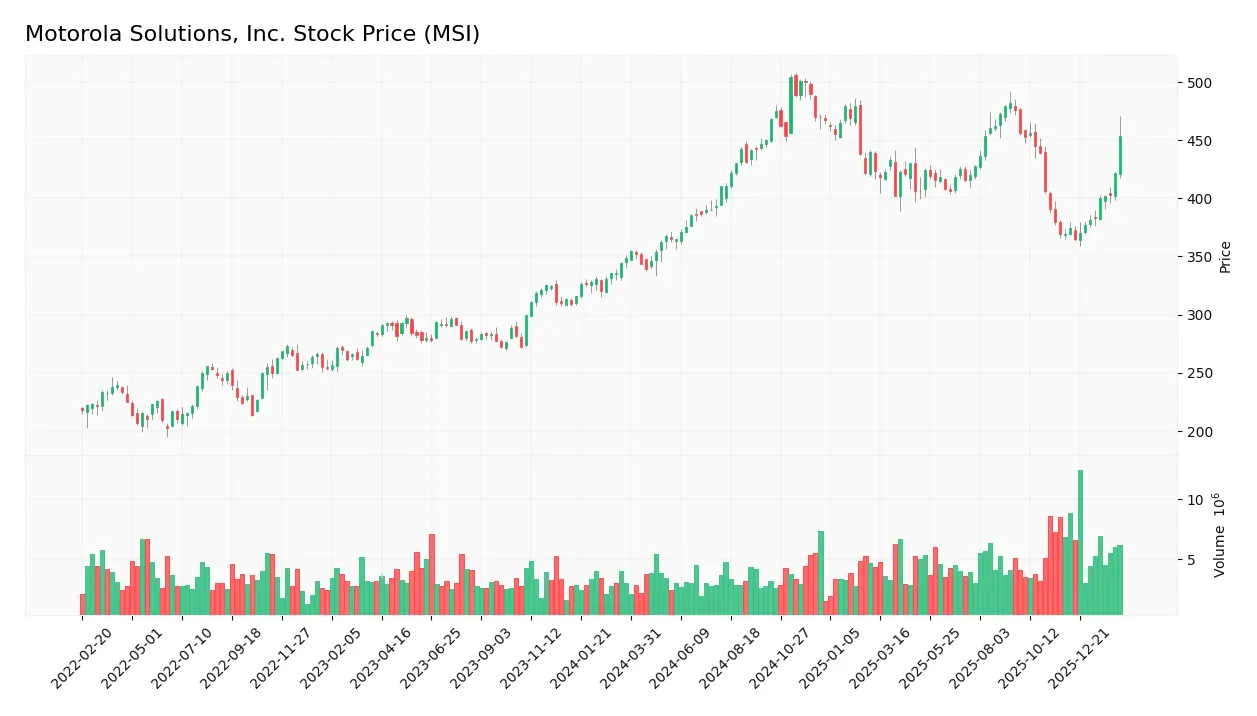
Trend Analysis
Over the past 12 months, MSI’s stock price rose 30.09%, indicating a bullish trend with acceleration. The price ranged between 340 and 505, showing strong upward movement despite high volatility (41.03%). Recent three-month data confirms continued strength with a 22.66% gain and a positive slope of 6.46.
Volume Analysis
Trading volumes have increased, driven predominantly by buyers who accounted for 62% of total volume. In the recent three months, buyer dominance surged to 91%, signaling robust investor demand and strong market participation favoring upward price pressure. Seller volume remains comparatively low and stable.
Target Prices
Analysts set a firm target consensus for Motorola Solutions, Inc., reflecting bullish expectations.
| Target Low | Target High | Consensus |
|---|---|---|
| 450 | 525 | 490 |
The target range suggests confidence in the stock’s upside, with a consensus price notably above current levels. This indicates positive momentum and solid growth prospects.

Don’t Let Luck Decide Your Entry Point
Optimize your entry points with our advanced ProRealTime indicators. You’ll get efficient buy signals with precise price targets for maximum performance. Start outperforming now!
Analyst & Consumer Opinions
This section examines Motorola Solutions, Inc.’s analyst ratings alongside consumer feedback to provide a balanced perspective.
Stock Grades
Here are the latest verified stock grades from prominent financial institutions for Motorola Solutions, Inc.:
| Grading Company | Action | New Grade | Date |
|---|---|---|---|
| Barclays | Maintain | Overweight | 2026-02-12 |
| Piper Sandler | Maintain | Overweight | 2026-02-12 |
| Piper Sandler | Upgrade | Overweight | 2026-01-05 |
| Morgan Stanley | Upgrade | Overweight | 2025-12-17 |
| Barclays | Maintain | Overweight | 2025-10-31 |
| Piper Sandler | Maintain | Neutral | 2025-10-31 |
| Evercore ISI Group | Maintain | Outperform | 2025-08-29 |
| UBS | Maintain | Buy | 2025-08-08 |
| Barclays | Maintain | Overweight | 2025-08-08 |
| Barclays | Maintain | Overweight | 2025-05-05 |
The majority of grades indicate a positive outlook, with several upgrades to Overweight by top firms. Consistency in maintaining Overweight ratings suggests sustained confidence in the stock’s prospects.
Consumer Opinions
Motorola Solutions, Inc. consistently earns praise for its reliable communication technology but faces critiques on customer support responsiveness.
| Positive Reviews | Negative Reviews |
|---|---|
| “Exceptional clarity and durability in radios.” | “Customer service response times are slow.” |
| “Great integration with existing security systems.” | “Pricing feels steep for smaller businesses.” |
| “User-friendly software updates simplify maintenance.” | “Some features lack customization options.” |
Consumers appreciate Motorola’s robust and user-friendly products. However, recurring issues with support and pricing suggest areas for improvement to enhance overall satisfaction.
Risk Analysis
Below is a table summarizing key risks for Motorola Solutions, Inc., highlighting their likelihood and potential impact:
| Category | Description | Probability | Impact |
|---|---|---|---|
| Financial Leverage | High debt-to-equity ratio (4.19) increases financial risk during downturns. | High | High |
| Valuation | Elevated P/E (29.65) and P/B (26.5) ratios suggest overvaluation risk. | Medium | Medium |
| Liquidity | Current ratio (1.04) and quick ratio (0.87) indicate tight short-term liquidity. | Medium | Medium |
| Market Volatility | Beta near 1 exposes stock to broad market swings. | Medium | Medium |
| Competitive Risk | Intense competition in communication equipment may pressure margins. | Medium | Medium |
Motorola Solutions faces its largest risks from high leverage and valuation multiples. Its debt load, over 50% of assets, could strain cash flow if interest rates rise. Despite a robust Altman Z-score placing it in the safe zone, investors must watch tight liquidity and stretched valuation amid sector cyclicality.
Should You Buy Motorola Solutions, Inc.?
Motorola Solutions, Inc. appears to be generating strong value creation with a slightly favorable moat, despite a declining ROIC trend. Its leverage profile is substantial, posing risk, while the overall B rating suggests a very favorable but cautious investment profile.
Strength & Efficiency Pillars
Motorola Solutions, Inc. demonstrates robust profitability with a net margin of 18.44% and an outstanding return on equity at 89.38%. Its return on invested capital (ROIC) stands at 16.11%, comfortably above the weighted average cost of capital (WACC) of 7.77%, confirming the company as a clear value creator. Operational efficiency is further supported by a strong EBIT margin of 25.24% and favorable interest coverage of 9.76. These metrics underscore solid core operations and effective capital allocation.
Weaknesses and Drawbacks
Despite operational strengths, valuation signals and leverage ratios raise concerns. The price-to-earnings ratio of 29.65 and price-to-book ratio of 26.5 indicate a stretched valuation, implying limited margin for error. Additionally, the company carries a high debt-to-equity ratio of 4.19, with debt constituting 52.11% of assets, which elevates financial risk during market downturns. Current and quick ratios remain moderate, but leverage pressure could constrain flexibility. Investors should monitor these imbalances carefully.
Our Final Verdict about Motorola Solutions, Inc.
The company presents a fundamentally strong profile with solid profitability and clear value creation. The bullish overall stock trend and strong buyer dominance (91.4%) in recent periods may appear attractive for long-term exposure. However, premium valuation and high leverage suggest caution. Investors might consider a measured approach, balancing the operational upside against financial risks and market valuation.
Disclaimer: This content is for informational purposes only and does not constitute financial, investment, or other professional advice. Investing in financial markets involves a significant risk of loss, and past performance is not indicative of future results.
Additional Resources
- Motorola Solutions (MSI) Shares Skyrocket, What You Need To Know – Finviz (Feb 12, 2026)
- Motorola Solutions, Inc. $MSI Shares Bought by Wealthfront Advisers LLC – MarketBeat (Feb 12, 2026)
- Motorola Solutions, Inc. (NYSE:MSI) Q4 2025 earnings call transcript – MSN (Feb 12, 2026)
- Motorola Solutions Reports Fourth-Quarter and Full-Year Financial Results – Business Wire (Feb 11, 2026)
- Motorola Solutions Inc. stock outperforms competitors on strong trading day – MarketWatch (Feb 12, 2026)
For more information about Motorola Solutions, Inc., please visit the official website: motorolasolutions.com