Home > Analyses > Financial Services > Morgan Stanley
Morgan Stanley shapes global finance by powering capital flows that underpin economies and businesses worldwide. It commands leadership in institutional securities, wealth management, and investment management, renowned for innovative solutions and trusted advice. The firm’s influence spans markets and clients, from governments to individual investors. As we dive into its financials, the key question emerges: does Morgan Stanley’s solid reputation still translate into sustainable growth and justify its premium valuation today?

Table of contents
Business Model & Company Overview
Morgan Stanley, founded in 1924 and headquartered in New York City, dominates the financial capital markets sector. It delivers a cohesive ecosystem of financial services spanning Institutional Securities, Wealth Management, and Investment Management. This integrated approach serves corporations, governments, and individuals worldwide, reflecting its pivotal role across the Americas, Europe, the Middle East, Africa, and Asia.
The company’s revenue engine balances advisory, underwriting, trading, and asset management with recurring wealth management fees and lending products. Its global footprint leverages cross-segment synergies, enhancing client retention and market reach. Morgan Stanley’s robust economic moat lies in its diversified business model and deep client relationships, positioning it as a key architect of the industry’s evolving landscape.
Financial Performance & Fundamental Metrics
I analyze Morgan Stanley’s income statement, key financial ratios, and dividend payout policy to assess its financial health and shareholder returns.
Income Statement
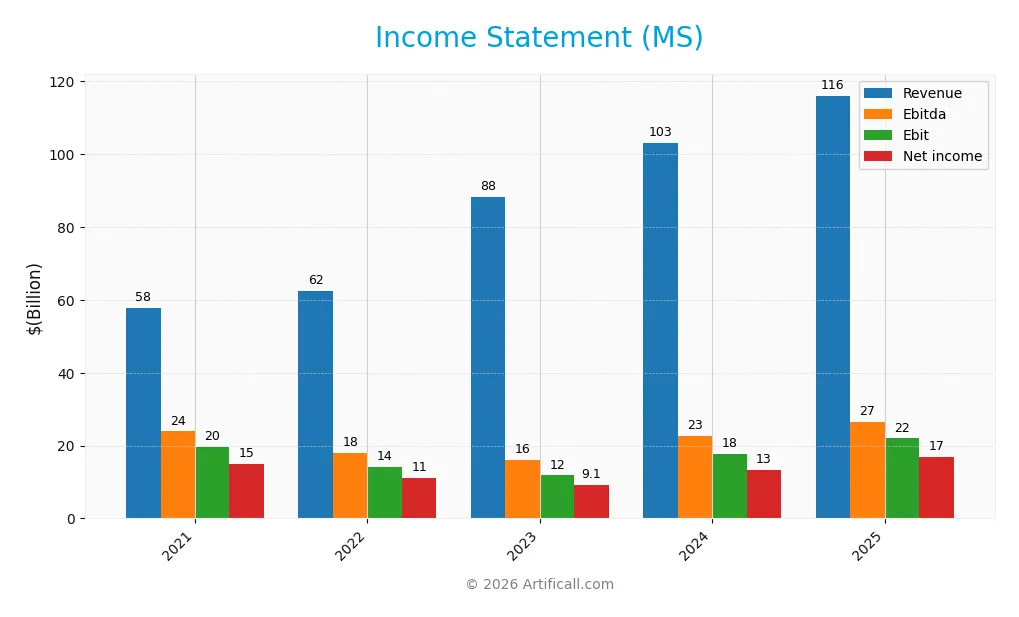
Below is Morgan Stanley’s income statement summary for fiscal years 2021 through 2025, showing key profitability and expense figures.
| 2021 | 2022 | 2023 | 2024 | 2025 | |
|---|---|---|---|---|---|
| Revenue | 57.8B | 62.5B | 88.3B | 103.1B | 116.1B |
| Cost of Revenue | 1.37B | 12.5B | 38.2B | 45.8B | 49.4B |
| Operating Expenses | 36.7B | 35.8B | 38.3B | 39.8B | 44.8B |
| Gross Profit | 56.4B | 49.9B | 50.1B | 57.4B | 66.7B |
| EBITDA | 23.9B | 18.1B | 16.1B | 22.8B | 26.6B |
| EBIT | 19.7B | 14.1B | 11.8B | 17.6B | 21.9B |
| Interest Expense | 1.37B | 12.3B | 37.6B | 45.5B | 49.0B |
| Net Income | 15.0B | 11.0B | 9.1B | 13.4B | 16.9B |
| EPS | 8.16 | 6.23 | 5.24 | 8.04 | 10.34 |
| Filing Date | 2022-02-24 | 2023-02-24 | 2024-02-22 | 2025-02-21 | 2026-02-19 |
Income Statement Evolution
Morgan Stanley’s revenue doubled from 58B in 2021 to 116B in 2025, showing sustained growth. Net income also rose but at a slower pace, increasing by 12% over the same period. Gross margin remained strong above 57%, while net margin declined, reflecting rising costs and interest expenses.
Is the Income Statement Favorable?
In 2025, Morgan Stanley demonstrated solid fundamentals with revenue growth of 12.6% and net income up nearly 19%. The gross margin of 57.5% and EBIT margin of 18.9% are favorable, though interest expense at 42.2% of income is a clear risk. Overall, 79% of key income metrics are positive, supporting a generally favorable income statement.
Financial Ratios
The table below summarizes Morgan Stanley’s key financial ratios for the fiscal years 2021 through 2025:
| Ratios | 2021 | 2022 | 2023 | 2024 | 2025 |
|---|---|---|---|---|---|
| Net Margin | 26.0% | 17.7% | 10.3% | 13.0% | 14.5% |
| ROE | 14.3% | 11.0% | 9.2% | 12.8% | 15.1% |
| ROIC | 3.1% | 2.3% | 1.8% | 2.5% | 12.7% |
| P/E | 11.7 | 13.0 | 16.7 | 14.9 | 16.5 |
| P/B | 1.66 | 1.44 | 1.53 | 1.91 | 2.50 |
| Current Ratio | 0.77 | 0.72 | 0.72 | 0.66 | 0.00 |
| Quick Ratio | 0.77 | 0.72 | 0.72 | 0.66 | 0.00 |
| D/E | 2.90 | 3.08 | 3.42 | 3.45 | 0.00 |
| Debt-to-Assets | 25.7% | 26.2% | 28.4% | 29.7% | 0.0% |
| Interest Coverage | 14.4 | 1.15 | 0.31 | 0.39 | 0.45 |
| Asset Turnover | 0.049 | 0.053 | 0.074 | 0.085 | 0.082 |
| Fixed Asset Turnover | 3611 | 15620 | 3839 | 4485 | 0.00 |
| Dividend Yield | 2.38% | 3.76% | 3.80% | 3.07% | 2.36% |
Evolution of Financial Ratios
Morgan Stanley’s Return on Equity (ROE) improved steadily, reaching 15.1% in 2025, signaling enhanced profitability. The Current Ratio remained at zero in 2025, indicating a continued liquidity challenge. Debt-to-Equity Ratio dropped to zero, reflecting notable deleveraging. Profit margins showed resilience, with net margin increasing to 14.52%, signaling stable profitability despite mixed liquidity trends.
Are the Financial Ratios Favorable?
In 2025, profitability ratios such as ROE (15.1%) and net margin (14.52%) were favorable, outperforming typical industry benchmarks. However, liquidity ratios like Current and Quick Ratios at zero flagged potential short-term risk. Leverage metrics, including Debt-to-Equity and Debt-to-Assets, were favorable, suggesting low financial risk. Market valuation ratios were neutral, while asset efficiency and interest coverage ratios were unfavorable, indicating mixed operational efficiency and coverage concerns. Overall, ratios appear slightly favorable.
Shareholder Return Policy
Morgan Stanley pays dividends with a payout ratio near 39% in 2025 and a dividend yield of about 2.36%. Dividend per share has steadily increased over recent years, supported by share buybacks, but free cash flow coverage is negative, signaling potential sustainability concerns.
The firm’s distribution strategy balances shareholder returns and capital needs amid fluctuating cash flows. While dividends and buybacks reward investors, negative free cash flow coverage warrants caution. This approach requires monitoring to ensure long-term value creation remains viable.
Score analysis
The radar chart below displays Morgan Stanley’s key financial scores for a comprehensive performance overview:
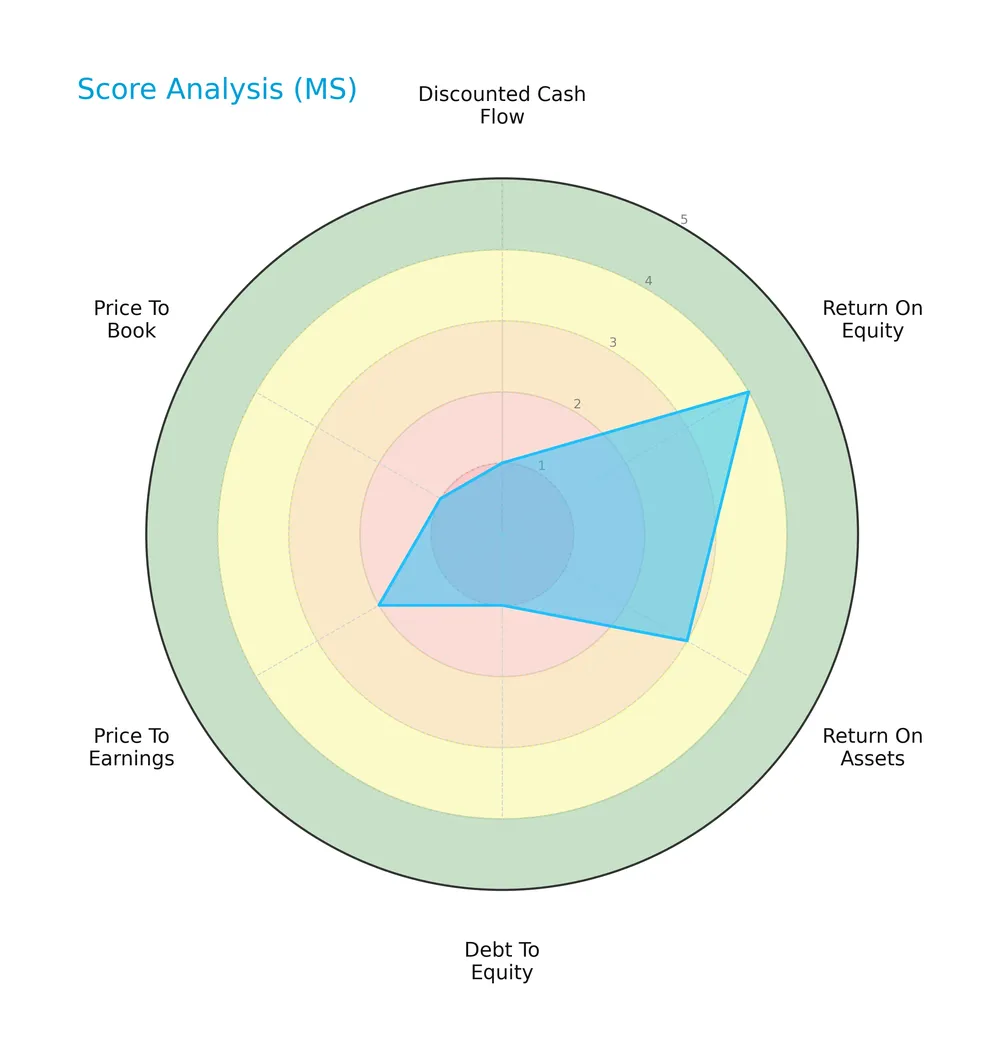
Morgan Stanley shows a mixed profile: strong return on equity (score 4) and moderate return on assets (score 3), but very weak scores in discounted cash flow, debt to equity, and price to book ratios, highlighting significant valuation and leverage concerns.
Analysis of the company’s bankruptcy risk
The Altman Z-Score places Morgan Stanley firmly in the distress zone, signaling a high risk of bankruptcy:

Is the company in good financial health?
The Piotroski Score diagram reflects Morgan Stanley’s average financial health status:

With a Piotroski Score of 6, the company shows moderate financial strength, indicating some resilience but also room for improvement in profitability and efficiency metrics.
Competitive Landscape & Sector Positioning
This section examines Morgan Stanley’s strategic positioning, revenue segments, key products, and main competitors. I will assess whether Morgan Stanley holds a competitive advantage over its peers.
Strategic Positioning
Morgan Stanley maintains a diversified business model across Institutional Securities, Wealth Management, and Investment Management. Geographically, it generates over 60% of revenue from the Americas, with significant exposure to Asia and EMEA, reflecting broad global reach within financial capital markets.
Revenue by Segment
The pie chart illustrates Morgan Stanley’s revenue distribution by business segment for fiscal year 2025, showcasing how each unit contributes to the overall top line.
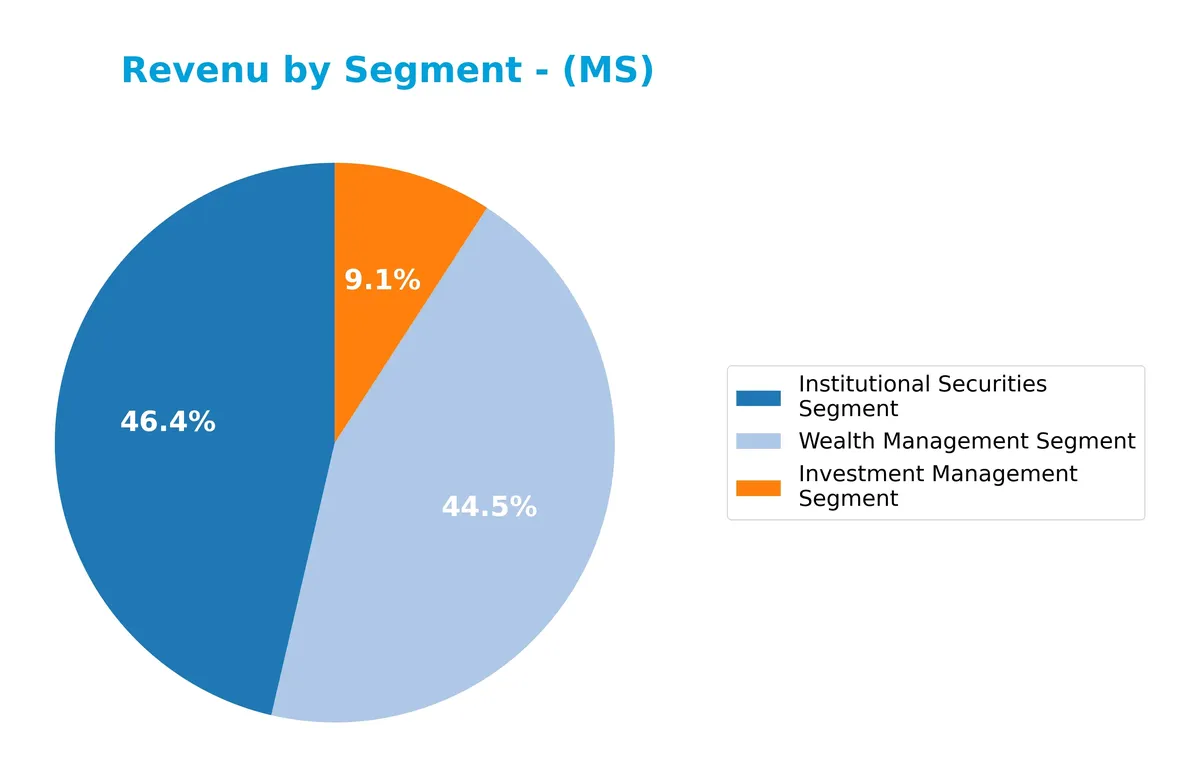
Morgan Stanley’s Institutional Securities leads with $33B in revenue, followed closely by Wealth Management at $31.8B. Investment Management, while smaller at $6.5B, shows steady growth. The Institutional segment’s acceleration signals strong deal flow and trading activity, while Wealth Management’s expansion reflects client asset growth. This dual-engine model reduces concentration risk and supports balanced revenue streams in 2025.
Key Products & Brands
Morgan Stanley’s main revenue streams come from three core business segments, detailed below:
| Product | Description |
|---|---|
| Institutional Securities | Provides capital raising, financial advisory, underwriting, sales and trading, and lending services. |
| Wealth Management | Offers brokerage, investment advisory, financial planning, lending, banking, and retirement services. |
| Investment Management | Delivers equity, fixed income, liquidity, and alternative investment products to institutional clients. |
Morgan Stanley’s diversified product portfolio spans capital markets, wealth advisory, and institutional asset management. Each segment targets distinct client needs, supporting steady revenue growth.
Main Competitors
Morgan Stanley faces competition from 6 key players in the Financial – Capital Markets sector. Below are the top 10 leaders by market capitalization:
| Competitor | Market Cap. |
|---|---|
| Morgan Stanley | 289B |
| The Goldman Sachs Group, Inc. | 287B |
| The Charles Schwab Corporation | 185B |
| Robinhood Markets, Inc. | 102B |
| Raymond James Financial, Inc. | 33B |
| Hut 8 Corp. | 5B |
Morgan Stanley ranks 1st among its competitors with a market cap slightly above Goldman Sachs by 2.81%. It stands well above the average market cap of the top 10 (150B) and the sector median (143B). The company’s scale is close to the leader, with a relative market cap of 0.9643.
Comparisons with competitors
Check out how we compare the company to its competitors:
Does Morgan Stanley have a competitive advantage?
Morgan Stanley exhibits a strong competitive advantage, consistently generating returns above its cost of capital. Its ROIC exceeds WACC by 3.45%, signaling efficient capital use and value creation over 2021-2025.
Looking ahead, Morgan Stanley benefits from expanding markets across the Americas, Asia, and EMEA. Growth in wealth management and institutional securities segments offers opportunities to leverage its global footprint and innovate financial services.
SWOT Analysis
This analysis highlights Morgan Stanley’s internal capabilities and external market conditions to guide strategic decisions.
Strengths
- strong brand with 100+ years legacy
- diversified revenue across Institutional Securities, Wealth and Investment Management
- high ROIC of 12.66% well above WACC
Weaknesses
- low liquidity ratios signal potential short-term stress
- interest coverage ratio at 0.45 is weak
- unfavorable asset turnover implies inefficient asset use
Opportunities
- expanding wealth management in emerging markets
- growing demand for sustainable investing products
- technology integration to improve trading and advisory services
Threats
- rising interest rates increasing funding costs
- regulatory complexity in multiple jurisdictions
- intense competition from fintech disruptors
Morgan Stanley’s durable competitive advantages and expanding global footprint position it well for growth. However, liquidity issues and external pressures require vigilant capital management and strategic innovation.
Stock Price Action Analysis
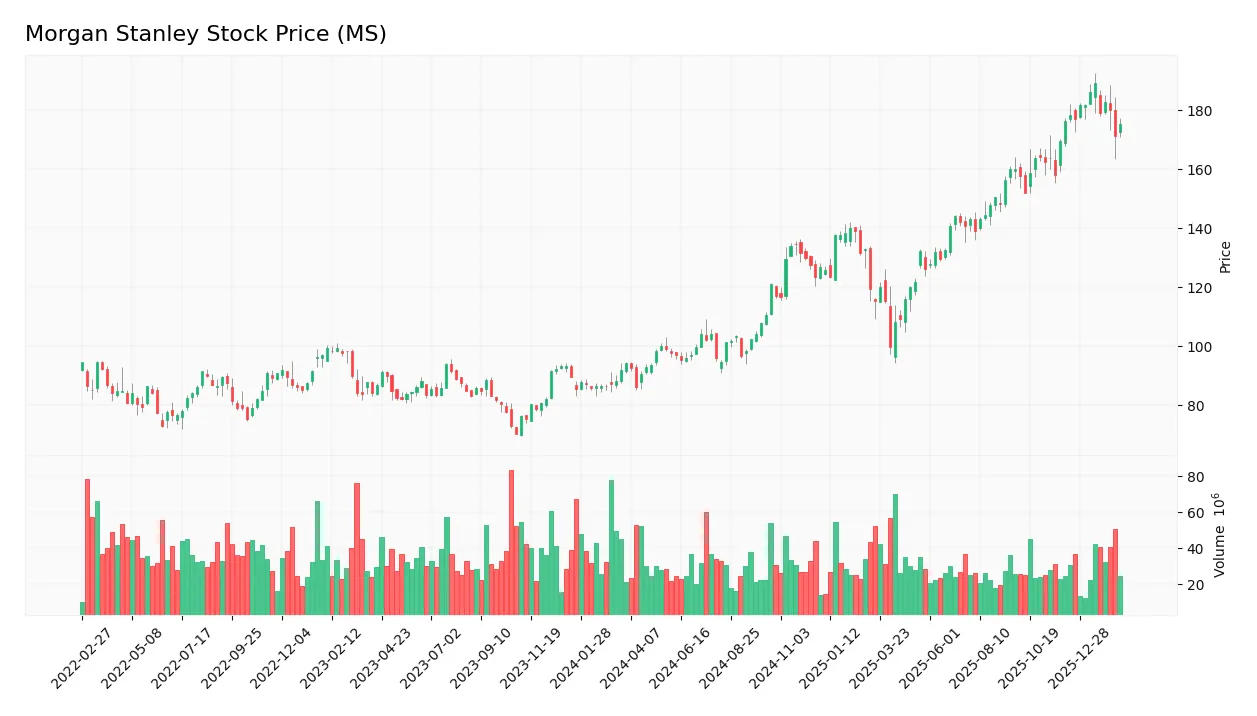
The following weekly stock chart illustrates Morgan Stanley’s price movements over the past 12 months, highlighting key highs and lows:
Trend Analysis
Over the past 12 months, Morgan Stanley’s stock surged 86.29%, signaling a strong bullish trend despite a deceleration phase. The price ranged from a low of 86.19 to a high of 189.09, with volatility reflected in a 27.77 standard deviation. Recent weeks show a slight negative trend of -0.62%.
Volume Analysis
Trading volumes over the last three months show a slightly buyer-dominant pattern, with buyers accounting for 54.43% of activity. Volume is decreasing, suggesting waning market participation and cautious investor sentiment amid marginal price declines.
Target Prices
Analysts present a confident target consensus for Morgan Stanley, reflecting cautiously optimistic expectations.
| Target Low | Target High | Consensus |
|---|---|---|
| 165 | 220 | 196 |
The target range from 165 to 220 indicates moderate upside potential. The 196 consensus suggests steady growth aligned with sector trends.

Don’t Let Luck Decide Your Entry Point
Optimize your entry points with our advanced ProRealTime indicators. You’ll get efficient buy signals with precise price targets for maximum performance. Start outperforming now!
Analyst & Consumer Opinions
This section examines Morgan Stanley’s recent analyst grades alongside consumer feedback to assess market sentiment comprehensively.
Stock Grades
The following table summarizes recent analyst grades for Morgan Stanley from established financial firms, reflecting varied but generally positive sentiment:
| Grading Company | Action | New Grade | Date |
|---|---|---|---|
| Keefe, Bruyette & Woods | Maintain | Outperform | 2026-01-16 |
| JP Morgan | Maintain | Neutral | 2026-01-08 |
| Barclays | Maintain | Overweight | 2026-01-05 |
| Keefe, Bruyette & Woods | Maintain | Outperform | 2025-12-17 |
| Wolfe Research | Upgrade | Outperform | 2025-11-24 |
| JP Morgan | Maintain | Neutral | 2025-10-21 |
| Barclays | Maintain | Overweight | 2025-10-16 |
| Citigroup | Maintain | Neutral | 2025-10-16 |
| Evercore ISI Group | Maintain | Outperform | 2025-10-16 |
| Jefferies | Maintain | Buy | 2025-10-16 |
Analyst grades for Morgan Stanley show a consistent pattern of “Outperform” and “Overweight” ratings, with several firms maintaining neutral stances. Wolfe Research notably upgraded its rating, indicating selective optimism within the consensus “Buy” sentiment.
Consumer Opinions
Morgan Stanley garners a mix of praise and criticism from its clients, reflecting a nuanced consumer sentiment.
| Positive Reviews | Negative Reviews |
|---|---|
| “Excellent wealth management with personalized advice.” | “High fees reduce overall returns.” |
| “Responsive customer service and clear communication.” | “Occasional delays in transaction processing.” |
| “Robust digital platform with intuitive tools.” | “Limited local branch access in some regions.” |
Overall, clients appreciate Morgan Stanley’s tailored advisory and digital strengths. However, fees and service delays emerge as consistent pain points, suggesting room for operational improvements.
Risk Analysis
Below is a summary table outlining Morgan Stanley’s key risk categories, probability, and impact:
| Category | Description | Probability | Impact |
|---|---|---|---|
| Financial Distress | Altman Z-Score in distress zone signals bankruptcy risk | High | High |
| Liquidity Risk | Unfavorable current and quick ratios indicate weak liquidity | Medium | Medium |
| Interest Coverage | Low interest coverage ratio (0.45) may impair debt servicing | Medium | High |
| Valuation Risk | Neutral P/E and P/B but unfavorable price-based scores | Medium | Medium |
| Operational Efficiency | Weak asset turnover metrics suggest poor asset utilization | Medium | Medium |
| Debt Management | Favorable debt-to-equity, but score indicates risk in leverage | Low | Medium |
Morgan Stanley faces its gravest risk from financial distress, evidenced by a 0.47 Altman Z-Score—well below the safe threshold of 3. Recent market volatility and credit tightening amplify this threat. Weak liquidity ratios and poor interest coverage compound vulnerability, despite solid profitability metrics. Investors must weigh these risks carefully against moderate valuation and operational concerns.
Should You Buy Morgan Stanley?
Morgan Stanley appears to be delivering improving profitability supported by a durable competitive moat with growing ROIC. However, its leverage profile suggests substantial risks, reflected in a cautious C+ rating and distress-zone Altman Z-Score, indicating a mixed financial health outlook.
Strength & Efficiency Pillars
Morgan Stanley exhibits operational strength with a net margin of 14.52% and a return on equity (ROE) of 15.1%, reflecting solid profitability. Its return on invested capital (ROIC) stands at 12.66%, comfortably above the weighted average cost of capital (WACC) at 9.21%, confirming that the company is a clear value creator. The growing ROIC trend further signals improving capital efficiency. These metrics underscore a sustainable competitive advantage and effective value creation over the 2021-2025 period.
Weaknesses and Drawbacks
The company is in financial distress, as evidenced by an Altman Z-Score of 0.47, which places it firmly in the distress zone and signals a significant bankruptcy risk. This solvency concern supersedes other weaknesses. Additionally, valuation metrics such as the price-to-earnings ratio of 16.54 and price-to-book ratio of 2.5 remain neutral but warrant monitoring. Liquidity ratios are unfavorable; the current and quick ratios register at 0, indicating potential short-term cash flow constraints. Interest coverage is critically low at 0.45, amplifying financial vulnerability.
Our Final Verdict about Morgan Stanley
Despite Morgan Stanley’s operational profitability and value creation, the company’s solvency risk, highlighted by its Altman Z-Score in the distress zone, makes its investment profile highly speculative. This financial distress overshadows favorable margins and ROIC trends. Investors might consider waiting for improvements in solvency before engaging, as the risk of bankruptcy currently outweighs operational strengths.
Disclaimer: This content is for informational purposes only and does not constitute financial, investment, or other professional advice. Investing in financial markets involves a significant risk of loss, and past performance is not indicative of future results.
Additional Resources
- Morgan Stanley Wealth Management Reduces Fees on Private Shares Marketplace EquityZen, Broadening Private Markets Access – Morgan Stanley (Feb 19, 2026)
- Morgan Stanley: Maybe I Was Wrong To Sell (And Why Preferreds Remain Attractive) (NYSE:MS) – Seeking Alpha (Feb 21, 2026)
- Tredje AP fonden Makes New Investment in Morgan Stanley $MS – MarketBeat (Feb 21, 2026)
- Here’s How Morgan Stanley Beats the Market From Here – The Motley Fool (Feb 20, 2026)
- Morgan Stanley (MS) Valuation Check As AI Wealth Push And Crypto Expansion Reshape Its Business Mix – Yahoo Finance (Feb 18, 2026)
For more information about Morgan Stanley, please visit the official website: morganstanley.com