Home > Analyses > Financial Services > Moody’s Corporation
Moody’s Corporation underpins the global financial system by delivering critical risk assessments that influence trillions in capital flows daily. As a powerhouse in financial data and credit ratings, it commands unmatched authority through Moody’s Investors Service and Moody’s Analytics. Known for innovation and rigorous analysis, Moody’s shapes how markets price risk and allocate capital worldwide. The key question now: do Moody’s robust fundamentals justify its premium valuation amid evolving market dynamics?

Table of contents
Business Model & Company Overview
Moody’s Corporation, founded in 1900 and headquartered in New York City, dominates the financial data and risk assessment sector. It operates through a cohesive ecosystem combining Moody’s Investors Service, which publishes credit ratings across 140 countries, and Moody’s Analytics, offering data, research, and risk management tools. Its comprehensive coverage spans corporate, financial institutions, sovereigns, and structured finance, solidifying its role as a global authority in credit evaluation.
The company’s revenue engine balances subscription-based analytics, software solutions, and credit rating services, serving institutional clients worldwide across the Americas, Europe, and Asia. Moody’s leverages recurring revenue streams from research and certification services alongside its highly scalable rating business. This model creates a durable economic moat, anchoring Moody’s as a vital pillar shaping the future of global financial markets.
Financial Performance & Fundamental Metrics
I analyze Moody’s Corporation’s income statement, key financial ratios, and dividend payout policy to assess its profitability, efficiency, and shareholder return quality.
Income Statement
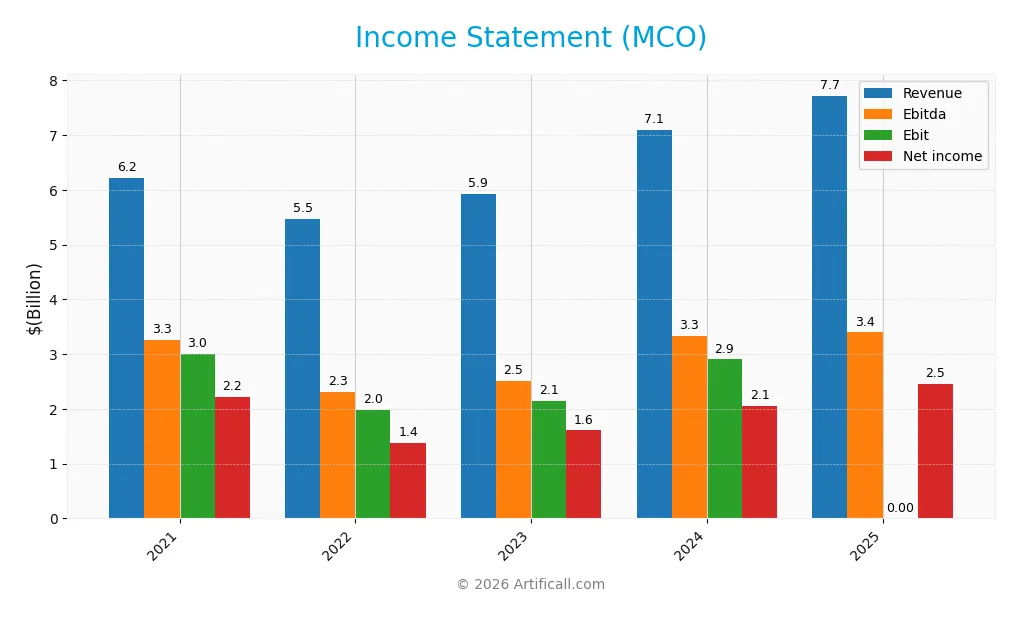
Below is Moody’s Corporation’s income statement summary for fiscal years 2021 through 2025, showing key profitability metrics and EPS performance.
| 2021 | 2022 | 2023 | 2024 | 2025 | |
|---|---|---|---|---|---|
| Revenue | 6.22B | 5.47B | 5.92B | 7.09B | 7.72B |
| Cost of Revenue | 1.89B | 1.94B | 2.06B | 2.38B | 1.97B |
| Operating Expenses | 1.48B | 1.53B | 1.63B | 1.74B | 1.80B |
| Gross Profit | 4.32B | 3.52B | 3.85B | 4.71B | 5.75B |
| EBITDA | 3.26B | 2.31B | 2.52B | 3.33B | 3.39B |
| EBIT | 3.00B | 1.98B | 2.14B | 2.90B | – |
| Interest Expense | 243M | 216M | 207M | 204M | 213M |
| Net Income | 2.21B | 1.37B | 1.61B | 2.06B | 2.46B |
| EPS | 11.88 | 7.47 | 8.77 | 11.32 | 13.73 |
| Filing Date | 2022-02-22 | 2023-02-15 | 2024-02-14 | 2025-02-14 | 2026-02-18 |
Income Statement Evolution
From 2021 to 2025, Moody’s revenue grew 24.1% to $7.72B, with net income rising 11.1% to $2.46B. Gross margin improved to 74.4%, reflecting better cost control. However, EBIT margin dropped sharply to zero in 2025, signaling a significant shift in operating profitability despite growth in absolute earnings.
Is the Income Statement Favorable?
In 2025, Moody’s showed strong fundamentals with an 8.9% revenue increase and a 22% gross profit surge. Net margin rose to 31.9%, supporting solid bottom-line growth. Interest expense remained well-managed at -2.8% of revenue. The zero EBIT margin, though unfavorable, was outweighed by overall positive income metrics, rendering the statement generally favorable.
Financial Ratios
The following table presents Moody’s Corporation key financial ratios for the fiscal years 2022 through 2025, illustrating profitability, liquidity, leverage, and market valuation metrics:
| Ratios | 2022 | 2023 | 2024 | 2025 |
|---|---|---|---|---|
| Net Margin | 25.13% | 27.16% | 29.03% | 31.86% |
| ROE | 54.55% | 48.43% | 57.73% | 60.66% |
| ROIC | 12.91% | 15.09% | 17.84% | 20.36% |
| P/E | 37.29 | 44.52 | 41.82 | 37.21 |
| P/B | 20.34 | 21.56 | 24.14 | 22.57 |
| Current Ratio | 1.72 | 1.69 | 1.43 | 1.74 |
| Quick Ratio | 1.72 | 1.69 | 1.43 | 1.74 |
| D/E | 3.12 | 2.23 | 2.17 | 1.81 |
| Debt-to-Assets | 54.80% | 50.71% | 49.96% | 46.44% |
| Interest Coverage | 9.25 | 10.73 | 14.56 | -15.73 |
| Asset Turnover | 0.38 | 0.40 | 0.46 | 0.49 |
| Fixed Asset Turnover | 6.45 | 6.72 | 8.13 | 7.69 |
| Dividend Yield | 1.01% | 0.79% | 0.72% | 0.77% |
Evolution of Financial Ratios
From 2021 to 2025, Moody’s Corporation’s Return on Equity (ROE) improved notably from 81.2% to 60.7%, reflecting strong profitability despite a recent dip. The Current Ratio increased from 1.61 to 1.74, indicating enhanced short-term liquidity. Meanwhile, the Debt-to-Equity ratio declined from 2.92 to 1.81, suggesting a gradual reduction in financial leverage over the period.
Are the Financial Ratios Favorable?
In 2025, profitability ratios such as net margin (31.9%) and ROE (60.7%) are favorable, signaling robust earnings efficiency. Liquidity ratios including current and quick ratios at 1.74 also rate favorably, ensuring adequate short-term assets. However, leverage remains high with a debt-to-equity of 1.81 and an unfavorable interest coverage ratio near zero. Market valuation metrics like P/E and P/B ratios are unfavorable, reflecting potentially rich pricing. Overall, the financial ratios present a neutral stance.
Shareholder Return Policy
Moody’s Corporation maintains a consistent dividend payout ratio around 28-35%, with dividend per share rising from $2.48 in 2021 to $3.91 in 2025. The annual dividend yield remains below 1%, supported by free cash flow coverage, indicating disciplined capital allocation without excessive distributions.
The company also engages in share buybacks, complementing dividends to return capital. This balanced approach aligns with sustainable long-term shareholder value creation by preserving financial flexibility while rewarding investors steadily.
Score analysis
The radar chart below illustrates Moody’s Corporation’s key financial scores across valuation and profitability metrics:
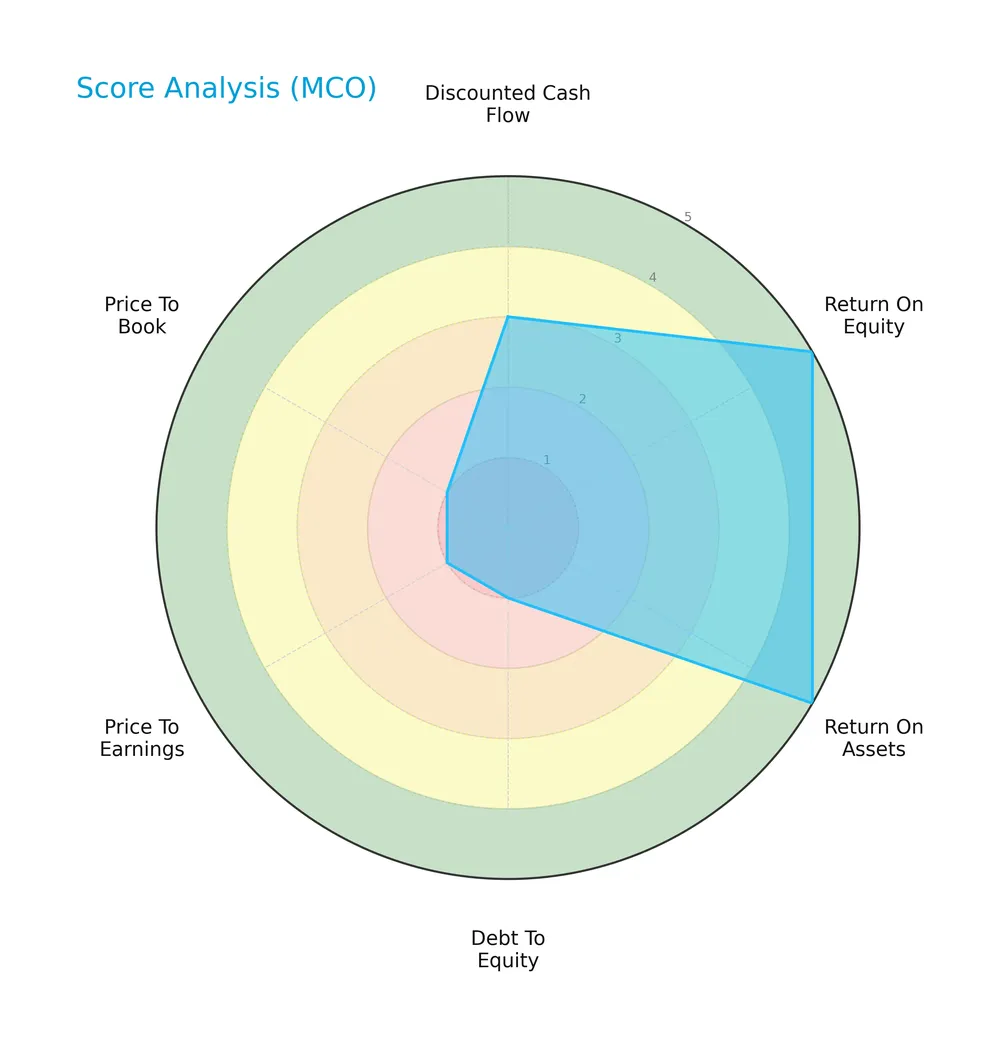
Moody’s shows very favorable returns on equity and assets with top scores of 5 each. However, the company scores poorly on leverage and valuation metrics, with debt-to-equity, PE, and PB ratios all rated very unfavorable at 1. The discounted cash flow score is moderate at 3.
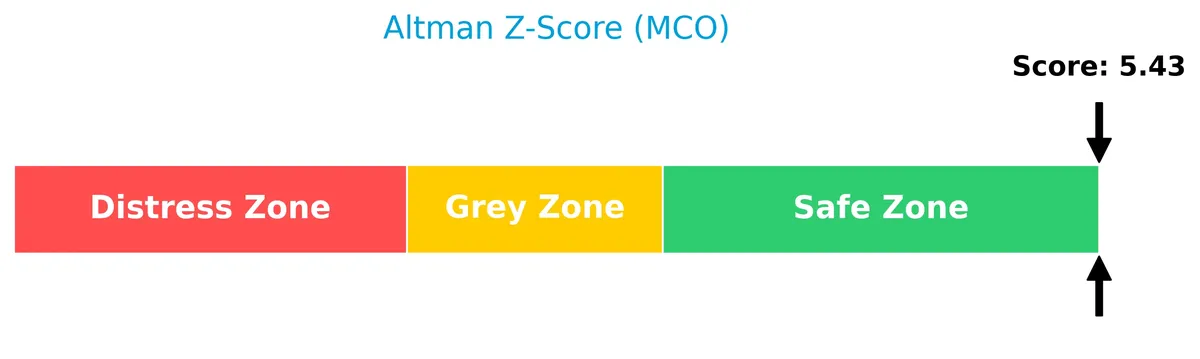
Analysis of the company’s bankruptcy risk
Moody’s Altman Z-Score places it firmly in the safe zone, indicating very low bankruptcy risk and strong financial stability:
Is the company in good financial health?
The Piotroski Score diagram below highlights Moody’s solid financial strength with a very strong score of 8 out of 9:

This high Piotroski Score suggests Moody’s maintains robust profitability, liquidity, and operational efficiency, reflecting excellent overall financial health.
Competitive Landscape & Sector Positioning
This section analyzes Moody’s Corporation’s strategic positioning, revenue segments, key products, and main competitors. I will evaluate whether Moody’s holds a competitive advantage over its industry peers.
Strategic Positioning
Moody’s maintains a balanced product portfolio with Moody’s Analytics generating $4.84B and Moody’s Investors Service $2.88B in 2025. Its geographic exposure is diversified, with significant revenue from EMEA ($2.38B), Asia Pacific ($699M), the U.S. ($472M), and other international regions ($3.55B).
Revenue by Segment
This pie chart illustrates Moody’s Corporation’s revenue distribution between Moody’s Analytics and Moody’s Investors Service for the fiscal year 2025.
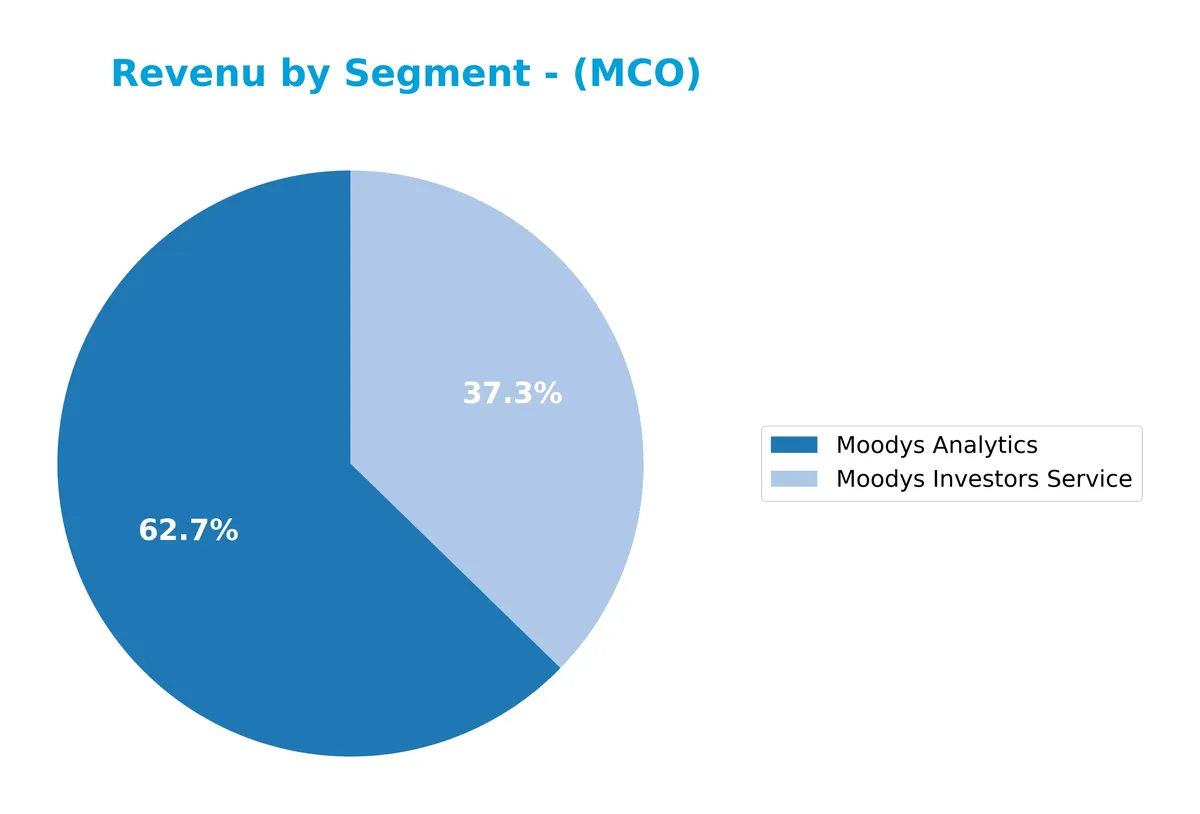
Moody’s Analytics leads with $4.84B, reflecting steady growth from $4.41B in 2024. Moody’s Investors Service contributes $2.88B, also up from $2.68B. The trend shows Moody’s Analytics increasingly drives the business, highlighting a shift toward data and analytics solutions. The 2025 acceleration underscores a strategic pivot, but investors should watch for dependence on this segment amid evolving market demands.
Key Products & Brands
Moody’s Corporation generates revenue primarily from two main segments, detailed below:
| Product | Description |
|---|---|
| Moody’s Investors Service | Publishes credit ratings and assessment services on debt obligations, issuers, and structured finance securities globally across 140 countries. |
| Moody’s Analytics | Provides subscription-based risk management products, credit research, economic forecasts, analytical tools, and training services. |
Moody’s relies on its Investors Service for authoritative credit ratings worldwide. Moody’s Analytics complements this with data-driven risk management solutions, creating a diversified revenue base.
Main Competitors
There are 9 competitors in Moody’s Corporation’s sector; the table lists the top 10 leaders by market capitalization:
| Competitor | Market Cap. |
|---|---|
| S&P Global Inc. | 155.2B |
| CME Group Inc. | 97.2B |
| Intercontinental Exchange, Inc. | 91.7B |
| Moody’s Corporation | 89.7B |
| Coinbase Global, Inc. | 60.5B |
| Nasdaq, Inc. | 55.5B |
| MSCI Inc. | 43.7B |
| Cboe Global Markets, Inc. | 26.0B |
| FactSet Research Systems Inc. | 10.8B |
Moody’s Corporation ranks 4th among its competitors, holding 52.1% of the market cap of the sector leader, S&P Global. It stands above both the average market cap of the top 10 (70.0B) and the sector median (60.5B). Moody’s maintains a 13.4% market cap lead over its nearest rival, Intercontinental Exchange, reflecting solid positioning in the Financial – Data & Stock Exchanges industry.
Comparisons with competitors
Check out how we compare the company to its competitors:
Does Moody’s Corporation have a competitive advantage?
Moody’s Corporation presents a sustainable competitive advantage, evidenced by a ROIC exceeding WACC by over 10%, signaling consistent value creation and efficient capital use. The company’s growing ROIC trend further confirms its ability to maintain profitability above industry cost of capital.
Looking ahead, Moody’s benefits from a diversified global footprint, with expanding revenues across U.S., Asia Pacific, and EMEA regions. Continued innovation in risk assessment products and analytics positions Moody’s well to capture new market opportunities and reinforce its competitive moat.
SWOT Analysis
This analysis highlights Moody’s Corporation’s core competitive position and strategic challenges.
Strengths
- strong brand with global reach
- high ROIC well above WACC
- diversified revenue from Moody’s Analytics and Investors Service
Weaknesses
- high debt-to-equity ratio
- unfavorable P/E and P/B ratios indicating expensive valuation
- declining EBIT margin
Opportunities
- expanding emerging markets exposure
- growing demand for risk analytics
- innovation in subscription-based services
Threats
- regulatory changes in financial services
- intense competition from fintech rivals
- economic downturn affecting credit markets
Moody’s maintains a durable competitive advantage with robust profitability and global scale. Yet, elevated leverage and valuation warrant caution. The company’s strategy should emphasize debt reduction and innovation to capture growth in emerging markets while managing regulatory risks.
Stock Price Action Analysis
The weekly stock chart of Moody’s Corporation (MCO) illustrates price movements and volatility trends over the past 12 months:
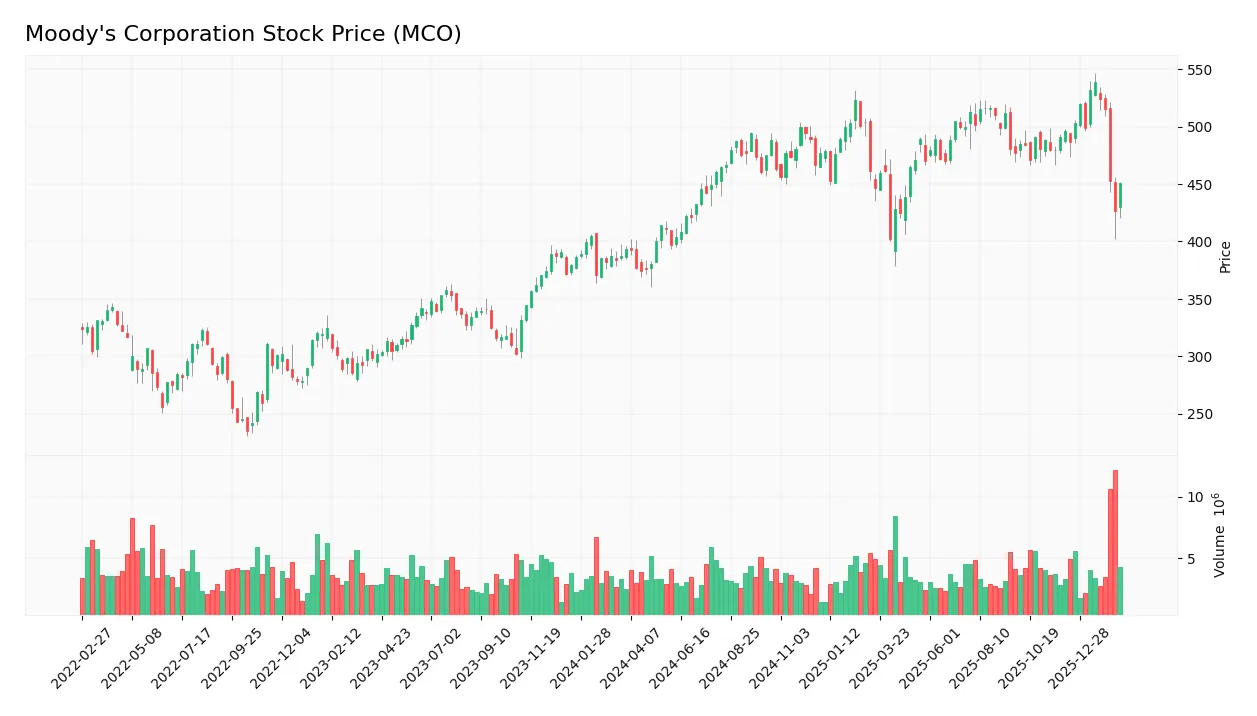
Trend Analysis
Over the past year, MCO’s stock gained 14.69%, indicating a bullish trend by a clear margin above 2%. The trend shows deceleration despite sustained gains. Price volatility remains elevated with a standard deviation of 37.72. The highest price reached 538.92, and the lowest was 374.67, reflecting a wide trading range.
Volume Analysis
Trading volume is increasing overall, with buyers accounting for 57.5% of total volume, signaling buyer-driven activity. However, in the recent period, sellers dominated with 61.7% volume, suggesting short-term selling pressure and cautious sentiment among investors.
Target Prices
Analysts set a solid target consensus for Moody’s Corporation, reflecting confidence in its growth potential.
| Target Low | Target High | Consensus |
|---|---|---|
| 507 | 620 | 557.4 |
The target range shows bullish sentiment, with analysts expecting Moody’s shares to appreciate significantly from current levels.

Don’t Let Luck Decide Your Entry Point
Optimize your entry points with our advanced ProRealTime indicators. You’ll get efficient buy signals with precise price targets for maximum performance. Start outperforming now!
Analyst & Consumer Opinions
This section reviews Moody’s Corporation’s analyst ratings and consumer feedback, providing a balanced perspective on its market standing.
Stock Grades
Here is a summary of recent credible analyst grades for Moody’s Corporation (MCO) from established financial institutions:
| Grading Company | Action | New Grade | Date |
|---|---|---|---|
| Goldman Sachs | Maintain | Buy | 2026-02-09 |
| Wells Fargo | Maintain | Overweight | 2026-01-14 |
| Daiwa Capital | Upgrade | Outperform | 2026-01-13 |
| Morgan Stanley | Maintain | Equal Weight | 2026-01-13 |
| Evercore ISI Group | Maintain | Outperform | 2026-01-08 |
| Stifel | Upgrade | Buy | 2026-01-05 |
| Goldman Sachs | Upgrade | Buy | 2025-12-16 |
| Mizuho | Maintain | Neutral | 2025-10-28 |
| Stifel | Maintain | Hold | 2025-10-23 |
| BMO Capital | Maintain | Market Perform | 2025-10-23 |
The overall trend shows a strong bias toward positive ratings, with multiple upgrades to Buy and Outperform. Most analysts maintain constructive views, reflecting confidence in Moody’s market positioning.
Consumer Opinions
Moody’s Corporation sparks strong reactions from consumers, reflecting its critical role in financial markets.
| Positive Reviews | Negative Reviews |
|---|---|
| Reliable credit ratings that aid investment choices | Some users find subscription costs steep |
| Comprehensive market insights and analysis | Occasional delays in report updates |
| User-friendly platform with detailed data | Customer service can be slow during peak periods |
Overall, consumers praise Moody’s for its accuracy and depth of financial data. However, cost concerns and service responsiveness emerge as common pain points. This balance is typical for high-value, specialized information providers.
Risk Analysis
Below is a summary table outlining key risks Moody’s Corporation faces, categorized by type, with assessed probabilities and potential impacts:
| Category | Description | Probability | Impact |
|---|---|---|---|
| Market Risk | High beta (1.44) exposes MCO to amplified stock volatility amid economic downturns. | Medium | High |
| Valuation Risk | Elevated P/E (37.2) and P/B (22.6) ratios suggest overvaluation relative to sector averages. | High | Medium |
| Leverage Risk | Debt-to-equity ratio of 1.81 signals significant leverage, raising financial flexibility concerns. | Medium | Medium |
| Operational Risk | Interest coverage near zero threatens ability to service debt during earnings pressure. | Medium | High |
| Industry Risk | Regulatory changes in credit rating transparency could disrupt Moody’s core business model. | Low | Medium |
| Liquidity Risk | Current ratio at 1.74 is healthy but must be monitored given debt levels and market shifts. | Low | Low |
The most pressing risks are Moody’s valuation and leverage. The stock trades at premium multiples, inflating downside risk if growth slows. Its debt load coupled with minimal interest coverage heightens vulnerability in a rising-rate environment. Moody’s strong Altman Z-score (5.43) and Piotroski score (8) mitigate bankruptcy fears but don’t eliminate earnings pressure risks. Prudence demands close attention to debt management and market sentiment shifts.
Should You Buy Moody’s Corporation?
Moody’s appears to be a robust value creator with a durable competitive moat, evidenced by growing ROIC well above WACC. Despite a manageable leverage profile flagged by weak debt-related scores, the company’s overall B rating suggests a very favorable financial health profile.
Strength & Efficiency Pillars
Moody’s Corporation exhibits robust profitability with a net margin of 31.86% and a return on equity (ROE) of 60.66%. Its return on invested capital (ROIC) stands at 20.36%, significantly exceeding the weighted average cost of capital (WACC) at 9.82%, confirming Moody’s as a clear value creator. The company’s very strong Piotroski score of 8 underscores its solid financial health. These metrics reflect efficient capital allocation and a sustainable competitive advantage in its sector.
Weaknesses and Drawbacks
Despite strong operational performance, Moody’s faces valuation headwinds with a high price-to-earnings ratio of 37.21 and price-to-book ratio of 22.57, signaling a premium market valuation that may limit upside. The debt-to-equity ratio of 1.81 raises concerns about leverage and financial flexibility. Additionally, recent market activity shows seller dominance at 61.7%, which could pressure short-term price performance. Interest coverage is notably unfavorable, which may increase vulnerability to rising interest rates.
Our Final Verdict about Moody’s Corporation
The company’s long-term fundamentals appear solid, supported by strong profitability and value creation. However, recent seller dominance introduces caution. Despite its bullish trend, Moody’s might warrant a wait-and-see approach for a more favorable entry point. The premium valuation and leverage risks suggest investors should monitor market conditions closely before committing capital.
Disclaimer: This content is for informational purposes only and does not constitute financial, investment, or other professional advice. Investing in financial markets involves a significant risk of loss, and past performance is not indicative of future results.
Additional Resources
- Mergers Market and Ratings Demand Drive Bullish Views on Moody’s (MCO) – Finviz (Feb 19, 2026)
- Moody’s Corporation (MCO) Surges 5.4% — Developing Story – AlphaStreet News (Feb 18, 2026)
- Moodys Corp (MCO) Q4 2025 Earnings Call Highlights: Record Revenue and Strategic Growth Initiatives – GuruFocus (Feb 18, 2026)
- Moody’s Corporation Reports Results for Fourth Quarter and Full Year 2025 – Business Wire (Feb 18, 2026)
- Moody’s jumps as Q4 results beat expectations and 2026 outlook points to continued growth – Quiver Quantitative (Feb 18, 2026)
For more information about Moody’s Corporation, please visit the official website: moodys.com