Home > Analyses > Technology > MongoDB, Inc.
MongoDB revolutionizes how data drives modern businesses, powering applications that touch millions daily. Its flagship product, MongoDB Atlas, leads the cloud database market with unmatched flexibility and scalability. Known for innovation and seamless hybrid deployments, the company reshapes software infrastructure standards. As competition intensifies, I question whether MongoDB’s growth trajectory and financial health still justify its premium market valuation in 2026.

Table of contents
Business Model & Company Overview
MongoDB, Inc., founded in 2007 and headquartered in New York City, dominates the Software – Infrastructure sector with a versatile general-purpose database platform. Its ecosystem integrates MongoDB Enterprise Advanced for enterprises, MongoDB Atlas multi-cloud service, and the free Community Server. This suite supports developers and large organizations alike, positioning MongoDB as a core enabler of modern data management.
The company’s revenue engine balances commercial database licenses, cloud-based subscriptions, and professional consulting services across the Americas, Europe, and Asia. MongoDB’s recurring revenue from its cloud-hosted Atlas service drives growth and scalability. Its strong competitive advantage lies in creating a flexible, developer-friendly platform pivotal in shaping the future of database technology worldwide.
Financial Performance & Fundamental Metrics
I analyze MongoDB, Inc.’s income statement, key financial ratios, and dividend payout policy to reveal the company’s underlying financial health and strategic positioning.
Income Statement
The following table summarizes MongoDB, Inc.’s annual income statement figures from 2022 to 2026, highlighting key profitability and expense metrics.

| 2022 | 2023 | 2024 | 2025 | 2026 | |
|---|---|---|---|---|---|
| Revenue | 874M | 1.28B | 1.68B | 2.01B | 2.46B |
| Cost of Revenue | 259M | 349M | 424M | 535M | 696M |
| Operating Expenses | 904M | 1.28B | 1.49B | 1.69B | 1.90B |
| Gross Profit | 614M | 935M | 1.26B | 1.47B | 1.77B |
| EBITDA | -267M | -294M | -122M | -97M | -29M |
| EBIT | -292M | -323M | -154M | -124M | -56M |
| Interest Expense | 11M | 10M | 9M | 8M | 0M |
| Net Income | -307M | -345M | -177M | -129M | -71M |
| EPS | -4.75 | -5.03 | -2.48 | -1.73 | -0.88 |
| Filing Date | 2022-03-18 | 2023-03-17 | 2024-03-15 | 2025-03-21 | 2026-03-11 |
Income Statement Evolution
MongoDB’s revenue rose sharply from 873M in 2022 to 2.46B in 2026, nearly tripling over five years. Net income losses narrowed significantly, improving from -307M in 2022 to -71M in 2026. Gross margins remained strong and stable around 72%, while operating and net margins, though still negative, displayed marked improvement in the latest year.
Is the Income Statement Favorable?
In 2026, revenue grew 23% year-over-year, driving a 20% gross profit increase. Operating expenses scaled proportionally, keeping margins under pressure but improving EBIT by 55%. Despite a net loss of 71M, the net margin nearly halved its deficit. Interest expenses were negligible. Overall, fundamentals show clear progress, though profitability remains elusive amid high costs.
Financial Ratios
The following table presents key financial ratios for MongoDB, Inc. over the past five fiscal years, illustrating profitability, liquidity, leverage, and efficiency metrics:
| Ratios | 2022 | 2023 | 2024 | 2025 | 2026 |
|---|---|---|---|---|---|
| Net Margin | -35% | -27% | -10% | -6% | -3% |
| ROE | -46% | -47% | -17% | -5% | -2% |
| ROIC | -15% | -17% | -10% | -7% | -4% |
| P/E | -85 | -43 | -162 | -158 | -424 |
| P/B | 39.2 | 19.9 | 26.7 | 7.3 | 10.2 |
| Current Ratio | 4.0 | 3.8 | 4.4 | 5.2 | 4.7 |
| Quick Ratio | 4.0 | 3.8 | 4.4 | 5.2 | 4.7 |
| D/E | 1.8 | 1.6 | 1.1 | 0.01 | 0.01 |
| Debt-to-Assets | 48% | 46% | 41% | 1% | 1% |
| Interest Coverage | -26 | -35 | -25 | -27 | 0 |
| Asset Turnover | 0.36 | 0.50 | 0.59 | 0.58 | 0.66 |
| Fixed Asset Turnover | 8.4 | 13.0 | 18.6 | 24.8 | 35.8 |
| Dividend Yield | 0% | 0% | 0% | 0% | 0% |
Evolution of Financial Ratios
From 2022 to 2026, MongoDB’s Return on Equity (ROE) improved from -46% to -2.4%, showing a steady reduction in losses but still negative profitability. The Current Ratio rose from about 4.0 to 4.65, indicating strong liquidity. The Debt-to-Equity Ratio dropped sharply from 1.77 to 0.01, reflecting a significant deleveraging trend over the period.
Are the Financial Ratios Fovorable?
In 2026, profitability ratios remain unfavorable, with net margin at -2.9% and ROE at -2.4%. Liquidity is mixed; the current ratio is high but flagged unfavorable, while the quick ratio is favorable at 4.65. Leverage ratios are very strong, with debt-to-equity at 0.01 and debt-to-assets below 1%. Efficiency is neutral for asset turnover but favorable for fixed asset turnover. Overall, 57% of key ratios are unfavorable, signaling caution.
Shareholder Return Policy
MongoDB, Inc. does not pay dividends, reflecting its persistent net losses and reinvestment focus. The company prioritizes growth, funding operations and R&D, while maintaining no share buyback activity.
This approach supports long-term value creation by emphasizing expansion over immediate returns. However, absence of distributions may challenge income-focused investors seeking cash flow amid negative profit margins.
Score analysis
The following radar chart illustrates MongoDB, Inc.’s financial scores across key valuation and profitability metrics:

MongoDB’s discounted cash flow score is moderate at 3, but its return on equity and assets scores are very unfavorable at 1 each. The debt-to-equity score stands out favorably at 4, while both price-to-earnings and price-to-book scores remain very unfavorable at 1.
Analysis of the company’s bankruptcy risk
MongoDB’s Altman Z-Score places it well within the safe zone, indicating a low risk of bankruptcy in the near term:

Is the company in good financial health?
The Piotroski Score diagram provides insight into MongoDB’s current financial strength and operational efficiency:

With a Piotroski Score of 4, MongoDB shows average financial health. This suggests moderate strength but also room for improvement in profitability and balance sheet robustness.
Competitive Landscape & Sector Positioning
This analysis explores MongoDB, Inc.’s strategic positioning and its revenue composition by segment within the software infrastructure sector. I will assess whether MongoDB holds a competitive advantage over its main rivals in this evolving market.
Strategic Positioning
MongoDB, Inc. centralizes its product portfolio around database services, with MongoDB Atlas driving 1.81B USD in 2026 revenue. Geographically, it balances exposure across Americas (1.50B), EMEA (681M), and Asia Pacific (285M), reflecting a focused yet global footprint in software infrastructure.
Revenue by Segment
This pie chart illustrates MongoDB, Inc.’s revenue breakdown by segment for fiscal year 2026, highlighting the composition of its subscription and service revenues.

MongoDB Atlas Related subscriptions dominate with $1.81B, reflecting strong cloud migration trends. Other Subscription contributes $578M, growing steadily but at a slower pace. Service revenue remains small at $78M, indicating a clear shift toward recurring, scalable revenue streams. The 2026 data shows accelerating growth in Atlas, underscoring concentration risk but also demonstrating the company’s expanding moat in cloud database services.
Key Products & Brands
The table below summarizes MongoDB, Inc.’s main products and brands by offering and function:
| Product | Description |
|---|---|
| MongoDB Atlas | Hosted multi-cloud database-as-a-service platform for scalable, managed database deployment across cloud providers. |
| MongoDB Enterprise Advanced | Commercial database server for enterprises, deployable on cloud, on-premise, or hybrid environments. |
| Community Server | Free-to-download database version with core developer functionalities to start building applications. |
| Professional Services | Consulting and training services supporting customer implementations and adoption of MongoDB technology. |
| Other Subscription | Additional subscription offerings beyond Atlas, supporting broader database platform usage. |
| Service | Ancillary services revenue, including support and maintenance contracts. |
MongoDB’s product suite centers on flexible database solutions spanning cloud and on-premise needs. Atlas drives rapid revenue growth, reflecting strong market adoption of cloud-managed databases. Subscription and service revenues complement the core platform, reinforcing a diversified software infrastructure offering.
Main Competitors
MongoDB, Inc. competes with 32 companies in its sector; the following table lists the top 10 leaders by market capitalization:
| Competitor | Market Cap. |
|---|---|
| Microsoft Corporation | 3.52T |
| Oracle Corporation | 553B |
| Palantir Technologies Inc. | 383B |
| Adobe Inc. | 140B |
| Palo Alto Networks, Inc. | 120B |
| CrowdStrike Holdings, Inc. | 113B |
| Synopsys, Inc. | 92B |
| Cloudflare, Inc. | 69B |
| Fortinet, Inc. | 59B |
| Block, Inc. | 40B |
MongoDB ranks 13th among 32 competitors, with a market cap just 0.54% that of Microsoft, the sector leader. It sits below the 508B average market cap of the top 10 but above the sector median of 19B. The company enjoys a significant 85% gap to its next larger competitor, indicating a clear market tier separation.
Comparisons with competitors
Check out how we compare the company to its competitors:
Does MDB have a competitive advantage?
MongoDB, Inc. currently does not present a strong competitive advantage, as it is shedding value with an ROIC below its WACC by over 15%. However, the company’s profitability is improving, reflected in a growing ROIC trend.
Looking ahead, MDB has opportunities to expand through its MongoDB Atlas multi-cloud database service and enterprise solutions across Americas, EMEA, and Asia Pacific markets. Continued revenue growth near 23% supports its potential for future competitive positioning.
SWOT Analysis
This analysis identifies MongoDB’s internal strengths and weaknesses alongside external opportunities and threats to guide strategic decisions.
Strengths
- Strong revenue growth of 182% over 5 years
- High gross margin at 71.75%
- Low debt levels with DE ratio at 0.01
Weaknesses
- Negative net margin at -2.89%
- ROIC below WACC, indicating value destruction
- High PB ratio at 10.22 signals overvaluation
Opportunities
- Expansion in multi-cloud database services
- Rising demand for cloud infrastructure
- Geographic growth in Asia Pacific and EMEA
Threats
- Intense competition in cloud databases
- Market volatility impacting tech valuations
- Rising operational expenses could pressure margins
MongoDB benefits from robust growth and strong market positioning but faces margin pressure and valuation concerns. The company must leverage cloud trends while managing costs to sustain its competitive edge.
Stock Price Action Analysis
The following weekly chart illustrates MongoDB, Inc.’s stock price fluctuations over the past 12 months, highlighting key trend points and volatility patterns:
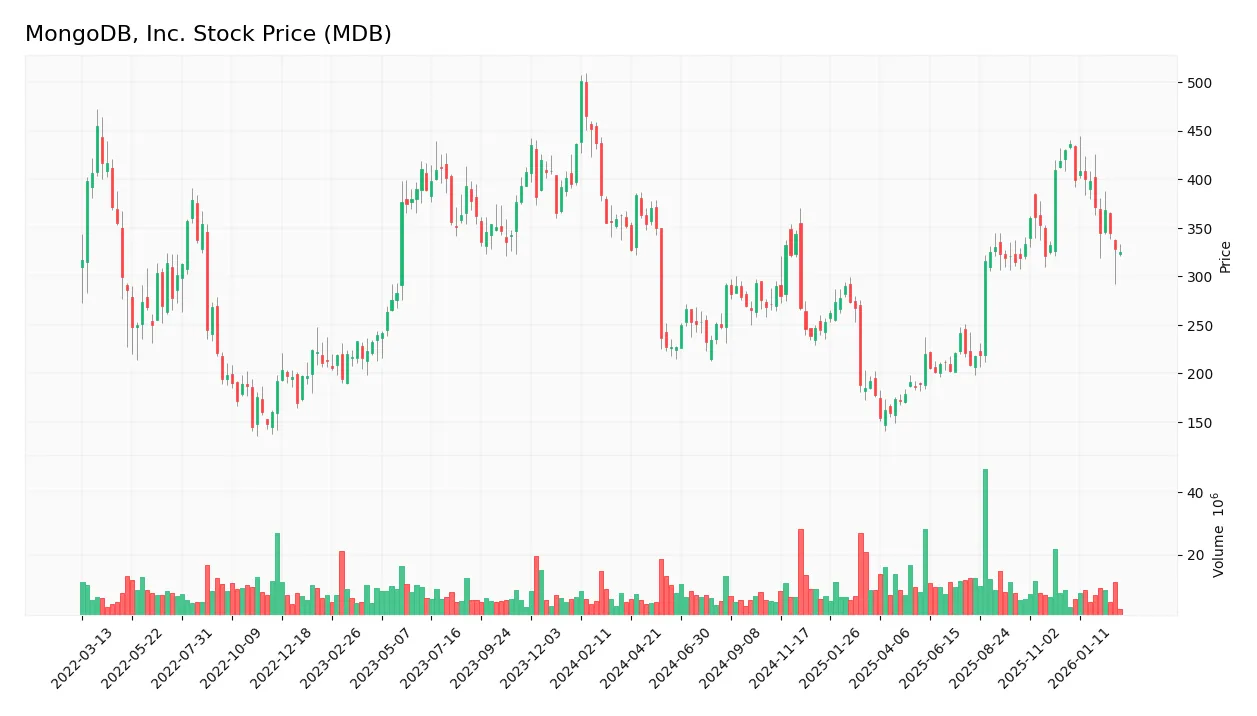
Trend Analysis
Over the past 12 months, MDB’s stock price fell by 35.09%, signaling a bearish trend. The decline shows deceleration despite high volatility (std dev 67.94). The stock peaked at 435.85 and bottomed at 154.39, indicating wide price swings but a weakening downward momentum.
Volume Analysis
Trading volume has increased, with seller volume slightly exceeding buyer volume overall (52% sellers). Recent months show strong seller dominance (only 20% buyer volume), reflecting bearish investor sentiment and cautious market participation.
Target Prices
Analysts show a bullish consensus for MongoDB, Inc., projecting strong upside potential.
| Target Low | Target High | Consensus |
|---|---|---|
| 300 | 500 | 415 |
The target range suggests confidence in MongoDB’s growth trajectory, with expectations well above current market levels.

Don’t Let Luck Decide Your Entry Point
Optimize your entry points with our advanced ProRealTime indicators. You’ll get efficient buy signals with precise price targets for maximum performance. Start outperforming now!
Analyst & Consumer Opinions
This section reviews analyst ratings and consumer feedback to provide insight into MongoDB, Inc.’s market perception.
Stock Grades
The latest analyst ratings for MongoDB, Inc. reflect a generally positive outlook with several upgrades and consistent buy recommendations:
| Grading Company | Action | New Grade | Date |
|---|---|---|---|
| Mizuho | Upgrade | Outperform | 2026-03-23 |
| Scotiabank | Upgrade | Sector Outperform | 2026-03-05 |
| Goldman Sachs | Maintain | Buy | 2026-03-04 |
| Rosenblatt | Maintain | Buy | 2026-03-03 |
| Canaccord Genuity | Maintain | Buy | 2026-03-03 |
| Stifel | Maintain | Buy | 2026-03-03 |
| Wells Fargo | Maintain | Overweight | 2026-03-03 |
| BMO Capital | Maintain | Outperform | 2026-03-03 |
| Mizuho | Maintain | Neutral | 2026-03-03 |
| Piper Sandler | Maintain | Overweight | 2026-03-03 |
The trend shows a strong buy consensus with multiple firms upgrading their stance recently. Most maintain buy or outperform ratings, indicating broad confidence in the stock’s prospects.
Consumer Opinions
MongoDB, Inc. sparks strong reactions from its user base, revealing a blend of enthusiasm and areas needing improvement.
| Positive Reviews | Negative Reviews |
|---|---|
| Intuitive interface simplifies complex queries. | Customer support response times can lag. |
| Robust scalability supports enterprise growth. | Pricing structure feels steep for startups. |
| Frequent updates improve performance steadily. | Some documentation lacks clarity for beginners. |
Overall, MongoDB users praise its scalability and user-friendly design. However, concerns about customer service and pricing consistently emerge as pain points.
Risk Analysis
Below is a summary table of MongoDB, Inc.’s key risks, detailing their probability and impact on the company:
| Category | Description | Probability | Impact |
|---|---|---|---|
| Profitability | Negative net margin (-2.89%) and ROE (-2.41%) indicate losses. | High | High |
| Valuation | Extremely high P/B ratio (10.22) suggests overvaluation risk. | Medium | Medium |
| Liquidity | High current ratio (4.65) may indicate inefficient capital use. | Medium | Low |
| Debt & Interest | Very low debt (D/E 0.01) but zero interest coverage suggests no earnings to cover interest. | Low | Medium |
| Operational Efficiency | Modest asset turnover (0.66) limits revenue generation from assets. | Medium | Medium |
| Financial Strength | Piotroski score of 4 (average) signals moderate financial health. | Medium | Medium |
The most concerning risks are the persistent losses and negative returns on invested capital, which weigh heavily on shareholder value. Despite being in the safe zone for bankruptcy per Altman Z-score, the company’s valuation metrics and weak profitability warrant caution. Recent trading volatility and a 2.4% price decline highlight market concerns over execution and growth sustainability.
Should You Buy MongoDB, Inc.?
MongoDB, Inc. appears to be shedding value despite a growing profitability trend, suggesting a slightly unfavorable moat profile. While debt leverage seems manageable, overall financial efficiency and returns remain weak, resulting in a cautious C rating.
Strength & Efficiency Pillars
MongoDB, Inc. maintains a robust gross margin of 71.75%, reflecting strong operational efficiency. Despite negative net margin (-2.89%) and ROIC (-4.42%), the Altman Z-Score of 14.76 firmly places the company in the safe zone for solvency. Leverage metrics are favorable with a minimal debt-to-equity ratio of 0.01 and debt-to-assets at 0.87%. The company shows promising revenue growth of 22.79% in the past year and a 181.97% rise over the overall period, signaling effective top-line expansion.
Weaknesses and Drawbacks
MongoDB faces critical profitability challenges, evidenced by unfavorable net margin (-2.89%), ROE (-2.41%), and ROIC (-4.42%). Its price-to-book ratio stands elevated at 10.22, indicating a potentially overvalued equity base. The current ratio, though high at 4.65, is flagged unfavorable, suggesting possible inefficiencies in asset deployment. Recent market activity highlights seller dominance with only 20.41% buyer volume, exerting short-term downward pressure on the stock price. These factors create significant headwinds despite solid solvency.
Our Final Verdict about MongoDB, Inc.
MongoDB’s fundamental profile suggests operational growth and strong solvency, but persistent negative profitability and valuation concerns temper enthusiasm. The bearish price trend and seller dominance in recent periods imply caution. Despite long-term growth potential, the current market pressure and profitability issues may suggest a wait-and-see approach for a more favorable entry point. This profile might appear attractive only to investors with a higher risk tolerance.
Disclaimer: This content is for informational purposes only and does not constitute financial, investment, or other professional advice. Investing in financial markets involves a significant risk of loss, and past performance is not indicative of future results.
Additional Resources
- MongoDB, Inc. (MDB) Appoints Ryan Mac Ban as Chief Revenue Officer – Yahoo Finance (Mar 27, 2026)
- MDB Stock Price, Quote & Chart | MONGODB INC (NASDAQ:MDB) – ChartMill (Mar 24, 2026)
- MongoDB, Inc. (MDB) Appoints Ryan Mac Ban as Chief Revenue Officer – Insider Monkey (Mar 27, 2026)
- Vanguard amends 13G/A after realignment — MongoDB holdings (MDB) – Stock Titan (Mar 27, 2026)
- Assenagon Asset Management S.A. Has $36.02 Million Stake in MongoDB, Inc. $MDB – MarketBeat (Mar 26, 2026)
For more information about MongoDB, Inc., please visit the official website: mongodb.com