Home > Analyses > Consumer Defensive > Mondelez International, Inc.
Mondelez International shapes daily indulgence with iconic snacks like Oreo, Cadbury, and Toblerone, enjoyed worldwide. The company commands the food confectioners industry through relentless innovation and a diverse portfolio spanning chocolates, biscuits, gums, and beverages. Its global reach and strong brand equity drive consistent consumer demand. Yet, as market dynamics evolve, I question whether Mondelez’s fundamentals still justify its current valuation and growth trajectory in 2026.
Table of contents
Business Model & Company Overview
Mondelez International, Inc. operates as a global powerhouse in the Food Confectioners industry. Founded in 2000 and headquartered in Chicago, it commands a vast ecosystem of snack brands, including Cadbury, Oreo, and Toblerone. This portfolio spans biscuits, chocolates, gums, and powdered beverages, creating a cohesive mission to satisfy diverse consumer cravings worldwide. With 90K employees, Mondelez leverages scale and innovation to maintain its dominant market position.
Its revenue engine balances strong recurring sales from iconic consumer brands across Americas, Europe, and Asia. Mondelez generates value through a mix of direct store delivery, e-commerce, and third-party distribution, ensuring broad retail penetration. This multi-channel approach supports steady cash flow and resilience in volatile markets. The company’s economic moat lies in its brand loyalty and extensive global footprint, shaping the future of the snack food industry.
Financial Performance & Fundamental Metrics
I analyze Mondelez International’s income statement, key financial ratios, and dividend payout policy to assess its operational efficiency and shareholder returns.
Income Statement
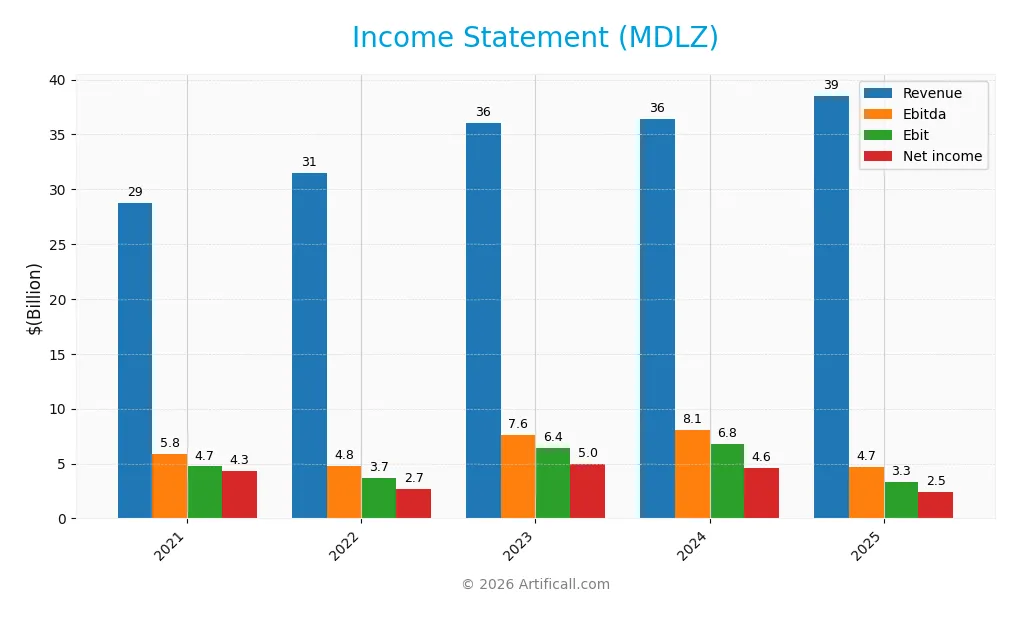
The table below summarizes Mondelez International, Inc.’s annual income statement figures from 2021 to 2025, reported in USD and scaled for clarity.
| 2021 | 2022 | 2023 | 2024 | 2025 | |
|---|---|---|---|---|---|
| Revenue | 28.7B | 31.5B | 36.0B | 36.4B | 38.5B |
| Cost of Revenue | 17.5B | 20.2B | 22.3B | 22.2B | 27.7B |
| Operating Expenses | 6.6B | 7.8B | 8.3B | 7.9B | 7.2B |
| Gross Profit | 11.3B | 11.3B | 13.8B | 14.3B | 10.8B |
| EBITDA | 5.8B | 4.8B | 7.6B | 8.1B | 4.7B |
| EBIT | 4.7B | 3.7B | 6.4B | 6.8B | 3.3B |
| Interest Expense | 365M | 428M | 550M | 508M | 282M |
| Net Income | 4.3B | 2.7B | 5.0B | 4.6B | 2.5B |
| EPS | 3.06 | 1.97 | 3.64 | 3.44 | 1.89 |
| Filing Date | 2022-02-04 | 2023-02-03 | 2024-02-02 | 2025-02-05 | 2026-02-04 |
Income Statement Evolution
Mondelez’s revenue grew steadily by 34.2% from 2021 to 2025, yet net income declined 43% over the same period. Gross margins contracted sharply in 2025, falling 24.3% year-over-year, while operating expenses expanded in line with revenue growth. EBIT and net margins also weakened, indicating margin pressures despite top-line gains.
Is the Income Statement Favorable?
In 2025, revenue reached $38.5B, up 5.7% from 2024, but gross profit dropped 24.3% to $10.8B, signaling rising costs or pricing challenges. EBIT margin remained neutral at 8.55%, while net margin of 6.36% was favorable relative to interest expense. However, net income declined nearly 50% year-over-year to $2.45B, reflecting profitability headwinds against steady revenue growth. Overall, fundamentals show mixed signals with margin erosion a key concern.
Financial Ratios
The following table summarizes key financial ratios for Mondelez International, Inc. (MDLZ) over the last five fiscal years:
| Ratios | 2021 | 2022 | 2023 | 2024 | 2025 |
|---|---|---|---|---|---|
| Net Margin | 15% | 9% | 14% | 13% | 6% |
| ROE | 15% | 10% | 18% | 17% | 9% |
| ROIC | 7% | 5% | 8% | 9% | 5% |
| P/E | 22 | 34 | 20 | 17 | 28 |
| P/B | 3.3 | 3.4 | 3.5 | 3.0 | 2.7 |
| Current Ratio | 0.74 | 0.60 | 0.62 | 0.68 | 0.59 |
| Quick Ratio | 0.54 | 0.40 | 0.43 | 0.48 | 0.39 |
| D/E | 0.71 | 0.88 | 0.70 | 0.68 | 0.87 |
| Debt-to-Assets | 30% | 33% | 28% | 27% | 31% |
| Interest Coverage | 13 | 8 | 10 | 12 | 13 |
| Asset Turnover | 0.43 | 0.44 | 0.50 | 0.53 | 0.54 |
| Fixed Asset Turnover | 3.1 | 3.3 | 3.5 | 3.6 | 3.4 |
| Dividend Yield | 2.0% | 2.2% | 2.2% | 2.9% | 3.6% |
Evolution of Financial Ratios
From 2021 to 2025, Mondelez’s ROE declined from 15.2% to 9.5%, indicating reduced profitability. The Current Ratio steadily dropped, falling below 0.6 in 2025, signaling weakening liquidity. The Debt-to-Equity Ratio varied but remained near 0.7–0.87, showing moderate leverage with some increase in debt reliance.
Are the Financial Ratios Favorable?
In 2025, profitability ratios like net margin (6.36%) and ROIC (5.13%) are neutral, while ROE at 9.5% is unfavorable relative to typical benchmarks. Liquidity ratios, including a current ratio of 0.59 and quick ratio of 0.39, are unfavorable, raising short-term risk concerns. Leverage ratios are neutral, but interest coverage at 11.7x and dividend yield at 3.57% are favorable. Overall, the ratios present a neutral financial profile.
Shareholder Return Policy
Mondelez International maintains a consistent dividend policy, with a payout ratio near 101% in 2025 and a 3.57% dividend yield, supported by share buybacks. Dividend payments are covered by free cash flow, though the high payout ratio signals potential pressure on sustainability.
The company’s buyback activity complements dividends, aiming to return capital to shareholders. While this policy supports shareholder returns, the near-full payout of earnings warrants close monitoring to ensure long-term value creation amid possible cash flow fluctuations.
Score analysis
The radar chart below presents a comprehensive view of Mondelez International’s key financial scores:
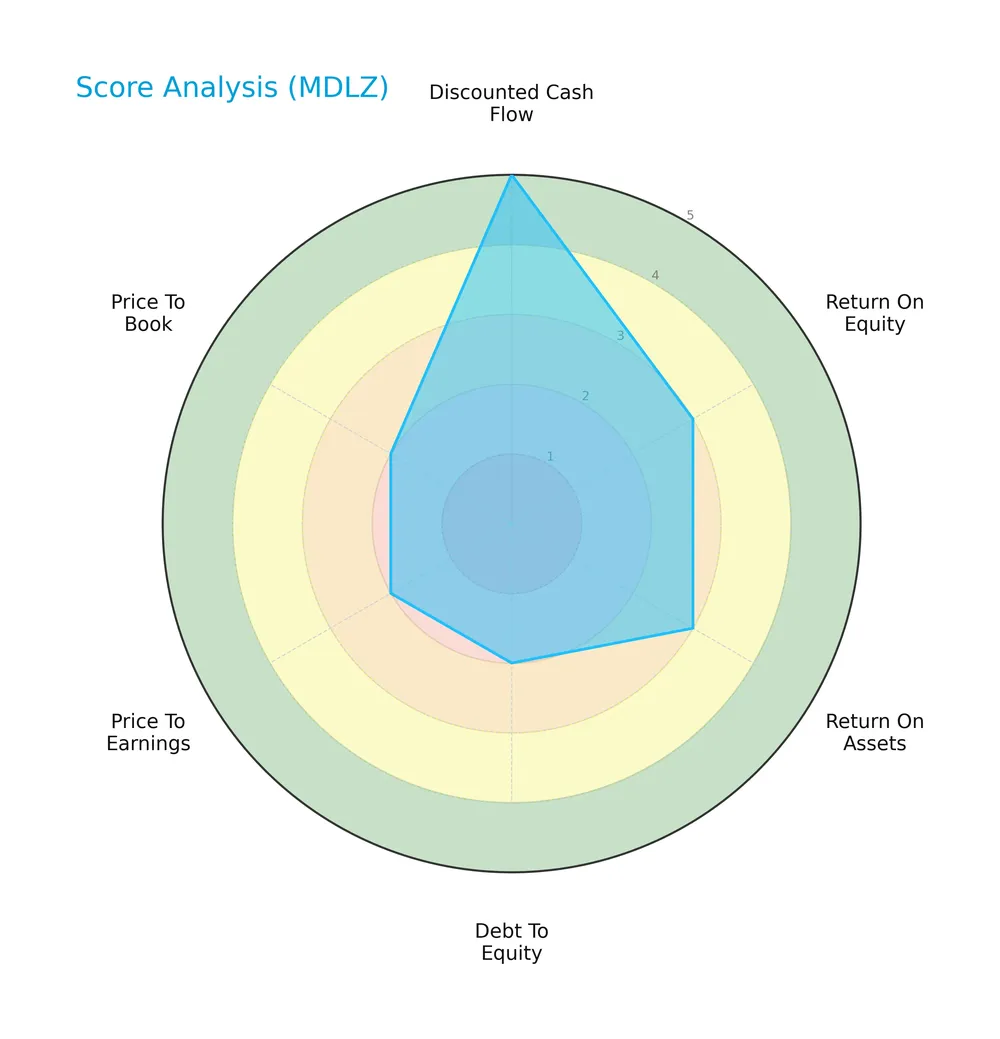
Mondelez scores very favorably on discounted cash flow with a 5, while return on equity and assets each register a moderate 3. Debt to equity, price to earnings, and price to book scores are moderate at 2, indicating room for improvement.
Analysis of the company’s bankruptcy risk
Mondelez’s Altman Z-Score places it in the grey zone, suggesting a moderate risk of bankruptcy that investors should monitor closely:

Is the company in good financial health?
The Piotroski diagram illustrates Mondelez’s current financial strength based on nine key criteria:

With a Piotroski Score of 6, Mondelez reflects average financial health, indicating reasonable profitability and efficiency but not yet reaching a strong rating.
Competitive Landscape & Sector Positioning
This section examines Mondelez International’s strategic positioning within the Food Confectioners industry. It covers revenue breakdowns, key products, main competitors, and competitive advantages. I will assess whether Mondelez holds a sustainable competitive edge over its peers.
Strategic Positioning
Mondelez International maintains a diversified product portfolio, with biscuits (18.4B), chocolate (12.7B), and gum/candy (4.1B) leading revenues in 2025. It operates globally, generating substantial sales across Europe (15B), North America (10.7B), Asia, Middle East, Africa (7.9B), and Latin America (4.9B).
Revenue by Segment
This pie chart displays Mondelez International’s revenue distribution by product segment for the fiscal year 2025, highlighting the company’s diversified consumer packaged goods portfolio.
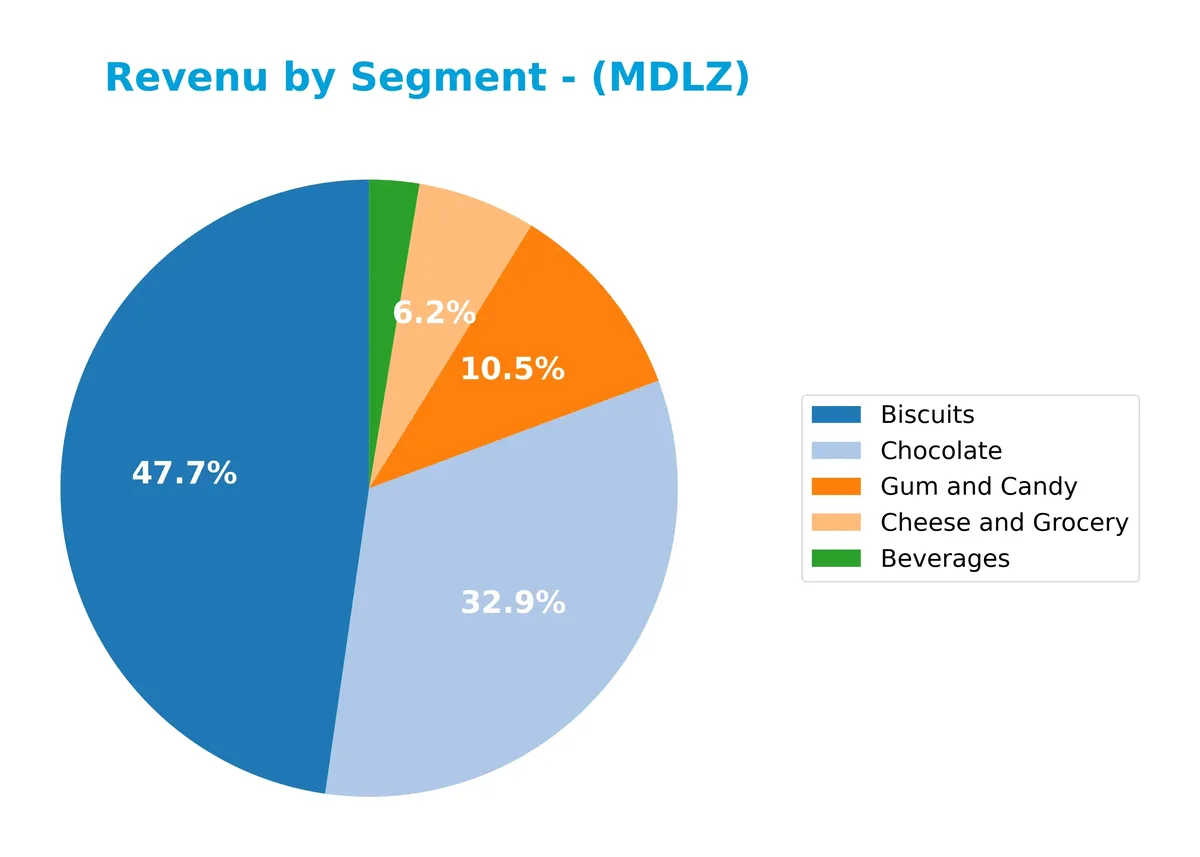
Biscuits lead Mondelez’s revenue at 18.4B, followed by Chocolate at 12.7B and Gum and Candy at 4.1B. Cheese and Grocery, and Beverages contribute smaller shares of 2.4B and 1B respectively. The 2025 data shows steady growth in the core segments of Biscuits and Chocolate, signaling a concentration in snack foods with limited exposure to beverages, which have declined slightly. This reflects Mondelez’s strategic focus on high-margin snacks amid evolving consumer preferences.
Key Products & Brands
Mondelez International’s portfolio spans several major snack categories, detailed as follows:
| Product | Description |
|---|---|
| Biscuits | Includes cookies, crackers, and salted snacks; brands include Oreo, belVita, and LU biscuits. |
| Chocolate | Features Cadbury, Milka, and Toblerone chocolates. |
| Gum and Candy | Comprises gums and candies such as Trident gums and Halls candies. |
| Cheese and Grocery | Encompasses various cheese and grocery products. |
| Beverages | Includes powdered beverage products like Tang. |
Mondelez’s product range balances staple biscuit sales with strong chocolate and confectionery brands. Biscuits represent the largest revenue segment, reflecting sustained consumer demand across regions.
Main Competitors
There are 2 main competitors in the Food Confectioners industry; the table lists the top 10 leaders by market capitalization:
| Competitor | Market Cap. |
|---|---|
| Mondelez International, Inc. | 69.3B |
| The Hershey Company | 37.0B |
Mondelez International ranks 1st among its competitors with a market cap 12% above the top player benchmark. It stands above both the average market cap of the top 10 and the median of the sector. The company leads The Hershey Company by a significant 110% margin, showing a dominant scale position.
Comparisons with competitors
Check out how we compare the company to its competitors:
Does MDLZ have a competitive advantage?
Mondelez International currently shows a slightly unfavorable moat. Its ROIC exceeds WACC by 0.14, but the trend reveals declining profitability and value erosion over 2021-2025.
Looking ahead, Mondelez’s broad geographic reach and diverse snack portfolio offer growth potential. Expansion in emerging markets and innovation in product lines could enhance competitive positioning.
SWOT Analysis
This SWOT analysis highlights Mondelez International’s key internal and external factors affecting its competitive position and growth prospects.
Strengths
- Strong global brand portfolio
- Diversified geographic revenue base
- Favorable gross margin of 28%
Weaknesses
- Declining ROIC signals value erosion
- Weak liquidity ratios (current 0.59, quick 0.39)
- Net income and EPS sharply down over 5 years
Opportunities
- Growth potential in Asia and emerging markets
- Rising demand for healthier snacks
- Expansion of e-commerce channels
Threats
- Intense competition in consumer snacks
- Rising input costs pressure margins
- Currency fluctuations impact international sales
Mondelez’s global scale and solid brands provide a durable foundation. However, declining profitability and liquidity weaknesses require strategic focus on operational efficiency. Capturing growth in emerging markets and digital sales channels can offset margin pressures from cost inflation and competition.
Stock Price Action Analysis
The weekly stock chart illustrates Mondelez International’s price movements over the past 12 months, highlighting key fluctuations and trend shifts:
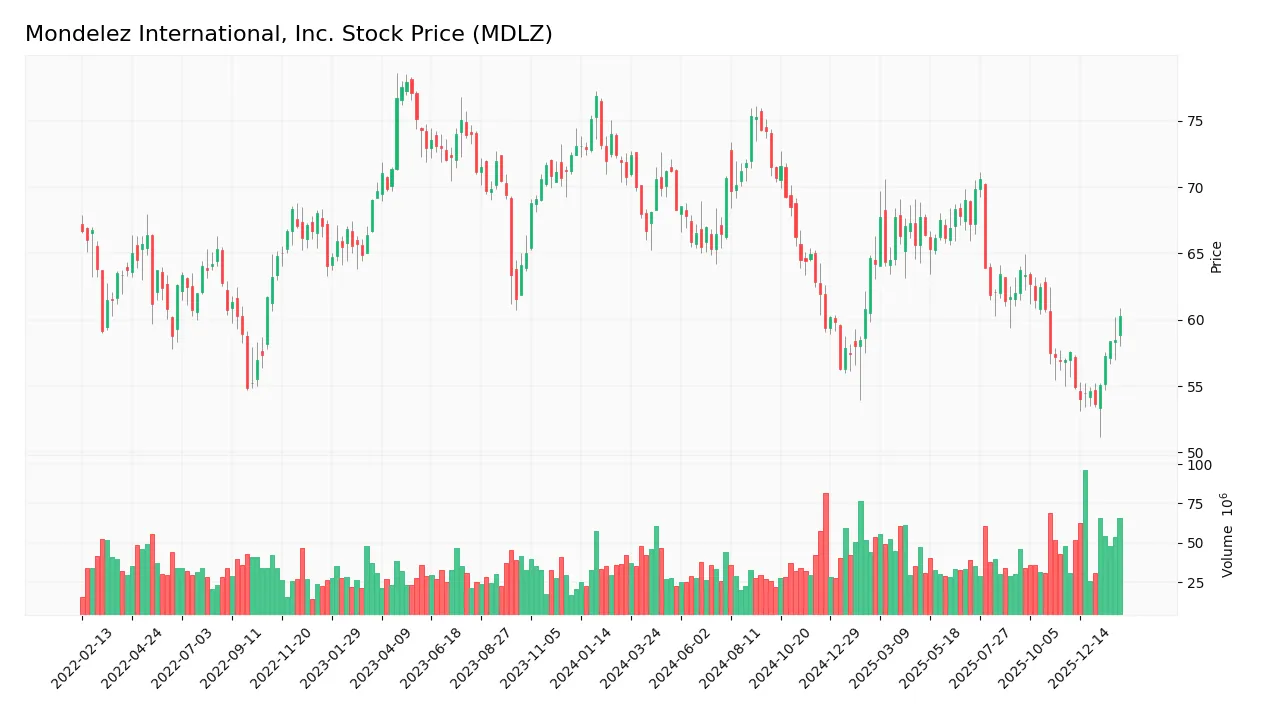
Trend Analysis
Over the past 12 months, MDLZ’s stock price declined by 14.76%, signaling a clear bearish trend with accelerating downward momentum. The stock traded between a high of 75.31 and a low of 53.65, with volatility reflected by a 5.27 standard deviation. Recent months show a mild recovery with a 5.81% gain.
Volume Analysis
Trading volume in the last three months has increased, driven strongly by buyers who account for 77% of activity. This buyer dominance suggests rising investor interest and confidence, contrasting the longer-term bearish price trend and indicating potential shifts in market participation.
Target Prices
Analysts present a moderately bullish consensus for Mondelez International, Inc.
| Target Low | Target High | Consensus |
|---|---|---|
| 61 | 84 | 67.5 |
The target range reflects cautious optimism, with expectations that the stock could appreciate modestly from current levels.

Don’t Let Luck Decide Your Entry Point
Optimize your entry points with our advanced ProRealTime indicators. You’ll get efficient buy signals with precise price targets for maximum performance. Start outperforming now!
Analyst & Consumer Opinions
This section examines Mondelez International, Inc.’s recent analyst ratings alongside key consumer sentiment indicators and feedback.
Stock Grades
The latest grades from leading financial firms on Mondelez International, Inc. demonstrate consistent sentiment and stable recommendations:
| Grading Company | Action | New Grade | Date |
|---|---|---|---|
| Wells Fargo | Maintain | Overweight | 2026-02-04 |
| Piper Sandler | Maintain | Neutral | 2026-02-04 |
| Stifel | Maintain | Buy | 2026-02-04 |
| DA Davidson | Maintain | Neutral | 2026-02-04 |
| JP Morgan | Maintain | Overweight | 2026-02-04 |
| DA Davidson | Maintain | Neutral | 2026-01-29 |
| JP Morgan | Maintain | Overweight | 2026-01-21 |
| UBS | Maintain | Neutral | 2026-01-14 |
| Mizuho | Maintain | Outperform | 2026-01-08 |
| TD Cowen | Maintain | Buy | 2026-01-08 |
Most analysts maintain positive views, with a strong bias toward buy and overweight ratings. Neutral grades appear as a cautious counterbalance, reflecting measured optimism.
Consumer Opinions
Mondelez International sparks diverse reactions, reflecting its broad global reach and varied product portfolio.
| Positive Reviews | Negative Reviews |
|---|---|
| Consistently fresh and tasty snacks. | Packaging often arrives damaged. |
| Wide variety of flavors and innovative options. | Some products feel overly sweet. |
| Reliable quality across different markets. | Price point higher than competitors. |
Consumers praise Mondelez for its dependable quality and flavor innovation. However, packaging durability and pricing remain recurring concerns.
Risk Analysis
Below is a concise table presenting the key risks facing Mondelez International, Inc., including their likelihood and potential impact:
| Category | Description | Probability | Impact |
|---|---|---|---|
| Liquidity Risk | Current ratio at 0.59 signals tight short-term liquidity. | High | Medium |
| Valuation Risk | Elevated P/E of 28.4 may limit upside amid market corrections. | Medium | High |
| Profitability Risk | ROE at 9.5% is below industry norms, indicating subdued returns. | Medium | Medium |
| Leverage Risk | Debt-to-equity ratio near 0.87 could pressure financial flexibility. | Medium | Medium |
| Market Volatility | Beta of 0.39 suggests stability but may limit gains in bull runs. | Low | Low |
Liquidity risk stands out due to the unfavorable current and quick ratios, threatening operational agility. Valuation risk is also critical given Mondelez’s premium multiple amid uncertain consumer trends. The Altman Z-Score in the grey zone signals moderate financial distress risk, warranting caution. Overall, prudent risk management is essential before adding MDLZ to portfolios.
Should You Buy Mondelez International, Inc.?
Mondelez International appears to be a moderately profitable company with a slightly unfavorable moat due to declining ROIC versus WACC. Despite a manageable but moderate leverage profile, its overall B rating suggests a stable yet cautious investment profile.
Strength & Efficiency Pillars
Mondelez International posts a solid gross margin of 28.01%, reflecting operational efficiency in its core business. The company maintains a favorable interest expense ratio at 0.73%, supporting manageable financing costs. Its weighted average cost of capital (4.99%) slightly undercuts its return on invested capital (5.13%), indicating a marginal value creator status, though the moat analysis signals a declining ROIC trend. The Altman Z-score of 2.26 places Mondelez in the grey zone, while a Piotroski score of 6 suggests average financial health.
Weaknesses and Drawbacks
Valuation metrics pose risks with a price-to-earnings ratio at 28.42, signaling a premium that could pressure future returns. Liquidity appears constrained, as the current ratio stands at a low 0.59, raising concerns about short-term financial flexibility. The return on equity is underwhelming at 9.49%, below typical sector benchmarks, indicating suboptimal capital efficiency. Market sentiment has been bearish overall with a 14.76% price decline, although recent buyer dominance at 76.99% suggests short-term recovery may be underway.
Our Verdict about Mondelez International, Inc.
Mondelez’s long-term fundamentals appear moderately favorable, balancing efficiency with some financial risks. Despite a bearish overall trend, recent buyer strength could signal an emerging turnaround. However, the premium valuation and liquidity issues suggest investors might adopt a wait-and-see stance before committing. The company’s profile may appear attractive for those with a tolerance for moderate risk and a focus on recovery potential.
Disclaimer: This content is for informational purposes only and does not constitute financial, investment, or other professional advice. Investing in financial markets involves a significant risk of loss, and past performance is not indicative of future results.
Additional Resources
- TD Cowen Raises Mondelez (MDLZ) Target While North America Volumes Remain Weak – Finviz (Feb 05, 2026)
- TD Cowen lifts PT on Mondelez International (MDLZ) to $65 from $62, maintains a buy rating – MSN (Feb 05, 2026)
- TD Cowen Lifts PT on Mondelez International (MDLZ) to $65 From $62, Maintains a Buy Rating – Insider Monkey (Feb 05, 2026)
- Decoding Mondelez International Inc (MDLZ): A Strategic SWOT Ins – GuruFocus (Feb 05, 2026)
- Mondelez International, Inc. $MDLZ Stock Position Raised by Jones Financial Companies Lllp – MarketBeat (Feb 03, 2026)
For more information about Mondelez International, Inc., please visit the official website: mondelezinternational.com