Home > Analyses > Consumer Defensive > Molson Coors Beverage Company
Molson Coors shapes social moments worldwide, fueling celebrations with its iconic beer and malt beverages. The company commands a stronghold in the alcoholic beverage sector, boasting a diverse portfolio from flagship lagers to innovative craft and ready-to-drink options. Known for its blend of tradition and forward-thinking, Molson Coors continually adapts to evolving consumer tastes. As the market shifts, I question whether its current fundamentals support sustained growth and justify its valuation in 2026.

Table of contents
Business Model & Company Overview
Molson Coors Beverage Company, founded in 1774 and headquartered in Golden, Colorado, stands as a dominant player in the alcoholic beverages industry. It operates a cohesive ecosystem of beer, flavored malt, craft, and ready-to-drink beverages, serving diverse consumer tastes worldwide. The company leverages its deep heritage and broad brand portfolio to maintain a strong foothold across multiple regions.
Molson Coors generates revenue through a balanced mix of product categories, blending traditional beer offerings with innovative malt beverages. It commands strategic market presence across the Americas, Europe, Middle East, Africa, and Asia Pacific. Its competitive advantage lies in its diversified product suite and global distribution network, which together create a resilient economic moat shaping the future of alcoholic beverage consumption.
Financial Performance & Fundamental Metrics
I analyze Molson Coors Beverage Company’s income statement, key financial ratios, and dividend payout policy to assess its fiscal health and shareholder value.
Income Statement
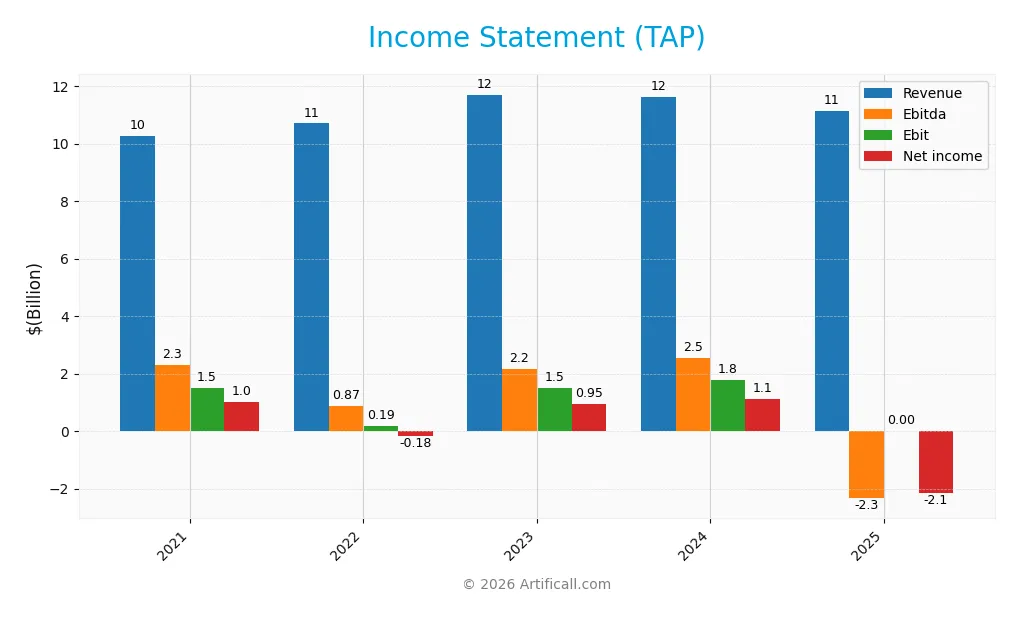
This table summarizes Molson Coors Beverage Company’s key income statement figures for fiscal years 2021 through 2025, reported in USD.
| 2021 | 2022 | 2023 | 2024 | 2025 | |
|---|---|---|---|---|---|
| Revenue | 10.3B | 10.7B | 11.7B | 11.6B | 11.1B |
| Cost of Revenue | 6.2B | 7.0B | 7.3B | 7.1B | 6.9B |
| Operating Expenses | 2.6B | 3.5B | 2.9B | 2.8B | 2.6B |
| Gross Profit | 4.1B | 3.7B | 4.4B | 4.5B | 4.3B |
| EBITDA | 2.3B | 873M | 2.2B | 2.5B | -2.3B |
| EBIT | 1.5B | 188M | 1.5B | 1.8B | 0 |
| Interest Expense | 262M | 236M | 229M | 279M | 248M |
| Net Income | 1.0B | -175M | 949M | 1.1B | -2.1B |
| EPS | 4.63 | -0.86 | 4.39 | 5.38 | -10.75 |
| Filing Date | 2022-02-23 | 2023-02-21 | 2024-02-20 | 2025-02-18 | 2026-02-18 |
Income Statement Evolution
Molson Coors’ revenue grew modestly by 8.4% from 2021 to 2025 but declined 4.2% in the latest year. Gross profit followed a similar pattern, slipping 5.7% in 2025. Margins contracted sharply, with net margin falling dramatically, reflecting deteriorating profitability despite a stable gross margin near 38%.
Is the Income Statement Favorable?
The 2025 income statement shows unfavorable fundamentals. Operating income swung to a significant loss, dragging net income down to -$2.14B from a $1.12B profit in 2024. EBIT margin collapsed to zero, and net margin turned negative at -19.2%. Interest expense remains manageable, but overall earnings and margin trends indicate operational and profitability challenges.
Financial Ratios
The following table presents key financial ratios for Molson Coors Beverage Company (TAP) over the past five fiscal years:
| Ratios | 2021 | 2022 | 2023 | 2024 | 2025 |
|---|---|---|---|---|---|
| Net Margin | 9.78% | -1.64% | 8.11% | 9.65% | -19.21% |
| ROE | 7.50% | -1.38% | 7.19% | 8.57% | -20.91% |
| ROIC | 4.82% | 0.69% | 4.73% | 5.85% | -11.77% |
| P/E | 10.01 | -63.75 | 13.93 | 10.66 | -4.34 |
| P/B | 0.75 | 0.88 | 1.00 | 0.91 | 0.91 |
| Current Ratio | 0.77 | 0.78 | 0.70 | 0.94 | 0.55 |
| Quick Ratio | 0.54 | 0.55 | 0.50 | 0.70 | 0.42 |
| D/E | 0.54 | 0.52 | 0.48 | 0.47 | 0.62 |
| Debt-to-Assets | 26.1% | 25.5% | 23.8% | 23.8% | 27.7% |
| Interest Coverage | 5.56 | 0.67 | 6.29 | 6.28 | 9.43 |
| Asset Turnover | 0.37 | 0.41 | 0.44 | 0.45 | 0.49 |
| Fixed Asset Turnover | 2.45 | 2.53 | 2.63 | 2.61 | 2.34 |
| Dividend Yield | 1.47% | 2.95% | 2.68% | 3.08% | 4.05% |
Evolution of Financial Ratios
Return on Equity (ROE) declined sharply from positive levels around 7-9% in 2021-24 to -20.9% in 2025. The Current Ratio weakened steadily from about 0.93 in 2024 to 0.55 in 2025, indicating deteriorating liquidity. Debt-to-Equity remained stable near 0.5-0.6, showing consistent leverage. Profitability turned negative in 2025, reversing prior improvements.
Are the Financial Ratios Fovorable?
In 2025, profitability ratios such as net margin (-19.2%) and ROE (-20.9%) are unfavorable, signaling losses and weak returns. Liquidity ratios (current 0.55, quick 0.42) fall below safe thresholds, raising short-term risk concerns. Leverage is neutral with a debt-to-equity of 0.62 and favorable debt-to-assets at 27.7%. Market valuations are attractive, with P/E at -4.34 and P/B at 0.91. Overall, ratios suggest a slightly unfavorable financial profile.
Shareholder Return Policy
Molson Coors maintains a consistent dividend policy, with a payout ratio fluctuating around 15% to 37% from 2021 to 2025. The dividend per share grew steadily to $1.89 in 2025, yielding approximately 4%, supported by moderate free cash flow coverage.
Despite negative net income in 2025, the company sustained dividends, indicating potential risks in distribution sustainability. There is no explicit mention of share buybacks. Overall, the policy balances shareholder returns with operational cash flow, but monitors for long-term viability.
Score analysis
Below is a radar chart illustrating Molson Coors Beverage Company’s key financial scores for comprehensive evaluation:
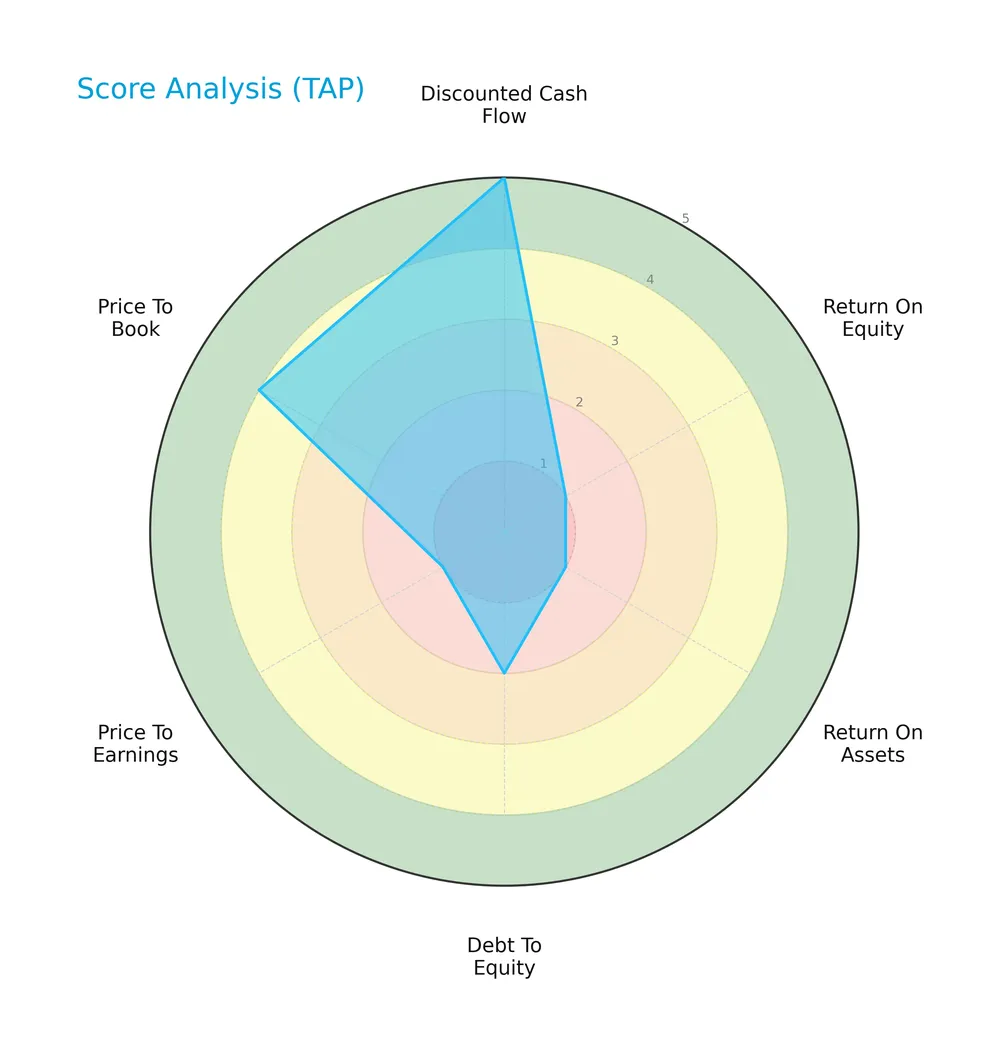
The company scores very favorably on discounted cash flow (5) but poorly on return on equity (1) and return on assets (1). Debt-to-equity (2) and price-to-earnings (1) ratios are unfavorable, while price-to-book (4) shows a favorable valuation metric.
Analysis of the company’s bankruptcy risk
Molson Coors is currently positioned in the distress zone with an Altman Z-Score below 1.8, indicating a high risk of bankruptcy:

Is the company in good financial health?
The Piotroski Score diagram below reflects the company’s moderate financial strength:

A score of 5 signals average financial health, suggesting Molson Coors maintains some fundamentals but lacks strong indicators of robust financial stability.
Competitive Landscape & Sector Positioning
This sector analysis explores Molson Coors Beverage Company’s strategic positioning and revenue composition. I will assess whether Molson Coors holds a competitive advantage over its main rivals.
Strategic Positioning
Molson Coors Beverage Company concentrates its revenue primarily in the Americas, generating $8.7B in 2025, with Europe contributing $2.5B. The firm focuses on beer and malt beverages, maintaining strong geographic concentration in mature markets rather than broad diversification.
Key Products & Brands
The table below outlines Molson Coors Beverage Company’s primary products and brands:
| Product | Description |
|---|---|
| Beer | Core malt beverage offering sold globally across Americas, Europe, Middle East, Africa, Asia Pacific. |
| Flavored Malt Beverages | Includes a variety of flavored alcoholic drinks targeting diverse consumer preferences. |
| Craft Beverages | Smaller-batch, specialty beers catering to niche and premium market segments. |
| Ready to Drink Beverages | Pre-mixed alcoholic drinks designed for convenience and on-the-go consumption. |
Molson Coors focuses on a broad alcoholic beverage portfolio. Its range spans traditional beer to innovative malt-based drinks. This diversification supports resilience across varying regional markets.
Main Competitors
There are 2 competitors in the Consumer Defensive sector. The table below lists the top 10 leaders by market capitalization:
| Competitor | Market Cap. |
|---|---|
| Anheuser-Busch InBev SA/NV | 125B |
| Molson Coors Beverage Company | 9.6B |
Molson Coors Beverage Company ranks 2nd among its competitors. Its market cap is only 8.03% of the sector leader, Anheuser-Busch InBev. The company sits below both the average market cap of the top 10 (67.3B) and the sector median (67.3B). It trails its nearest rival by a significant 1144.63% margin, highlighting a large scale gap.
Does TAP have a competitive advantage?
Molson Coors Beverage Company does not currently present a competitive advantage. Its return on invested capital (ROIC) falls significantly below its weighted average cost of capital (WACC), indicating value destruction and declining profitability.
Looking ahead, the company operates across multiple regions including the Americas and Europe, offering various malt and ready-to-drink beverages. Growth opportunities may arise from expanding product lines or markets, but recent financial trends suggest challenges in sustaining margin improvements.
Comparisons with competitors
Check out how we compare the company to its competitors:
SWOT Analysis
This analysis identifies Molson Coors Beverage Company’s internal strengths and weaknesses alongside external opportunities and threats.
Strengths
- strong brand portfolio
- diversified geographic presence
- consistent dividend yield of 4.05%
Weaknesses
- negative net margin at -19.21%
- low current and quick ratios (0.55, 0.42) signal liquidity risks
- declining ROIC far below WACC
Opportunities
- growth potential in emerging markets
- expanding flavored malt and ready-to-drink segments
- cost optimization through operational efficiencies
Threats
- shifting consumer preferences away from traditional beer
- intense competition in alcoholic beverages
- regulatory and tax pressures in key markets
Molson Coors faces significant profitability and liquidity challenges that undermine its value creation. The company must leverage growth in new product categories and emerging regions while aggressively managing costs and navigating industry headwinds.
Stock Price Action Analysis
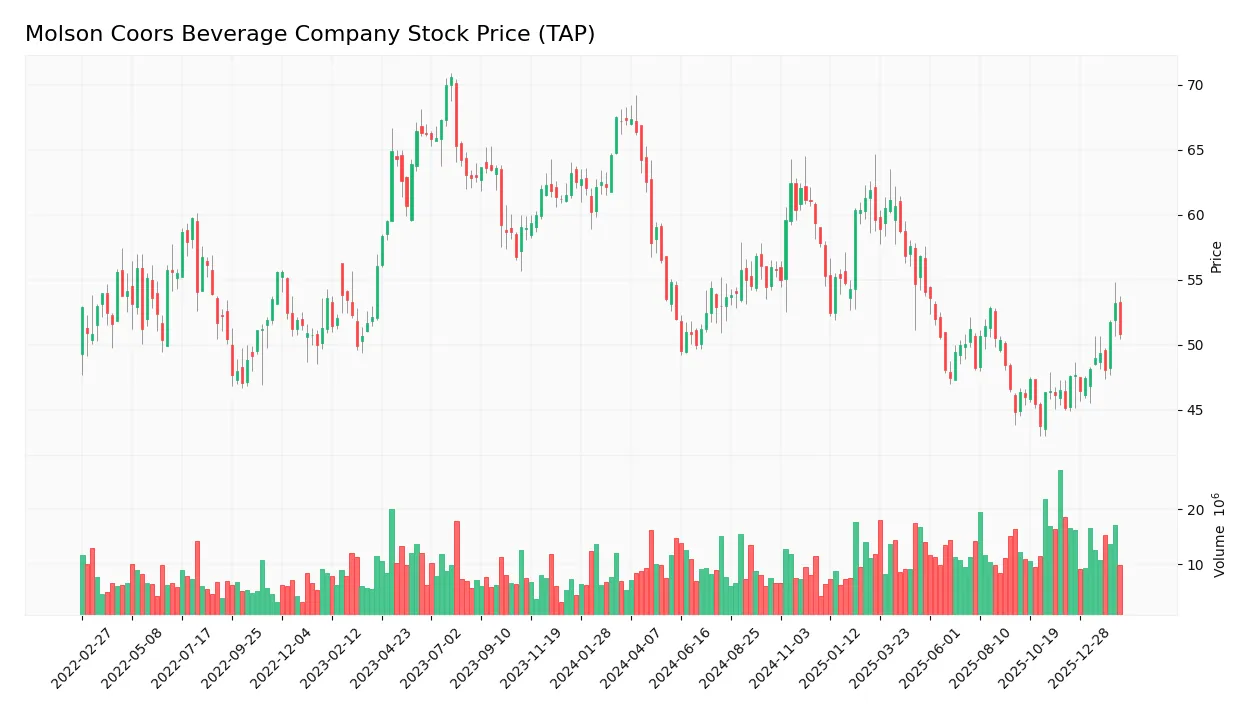
The weekly stock price chart of Molson Coors Beverage Company (TAP) highlights recent price movements and volatility patterns:
Trend Analysis
Over the past 12 months, TAP’s stock declined by 24.43%, indicating a bearish trend with accelerating downward momentum. The price ranged from a high of 67.35 to a low of 43.72, with volatility measured by a 5.48 standard deviation.
Volume Analysis
In the last three months, trading volumes have increased, driven predominantly by buyers who account for 68.1% of activity. This buyer dominance suggests growing investor interest and a potentially improving market sentiment despite the overall bearish trend.
Target Prices
Analysts set a clear target consensus for Molson Coors Beverage Company.
| Target Low | Target High | Consensus |
|---|---|---|
| 40 | 65 | 51.11 |
The target range from 40 to 65 shows moderate upside potential. The consensus at 51.11 signals cautious optimism amid sector volatility.
Analyst & Consumer Opinions
This section reviews analyst ratings and consumer feedback to provide insight into Molson Coors Beverage Company’s market perception.

Don’t Let Luck Decide Your Entry Point
Optimize your entry points with our advanced ProRealTime indicators. You’ll get efficient buy signals with precise price targets for maximum performance. Start outperforming now!
Stock Grades
Here are the latest verified analyst grades for Molson Coors Beverage Company, highlighting recent rating actions and trends:
| Grading Company | Action | New Grade | Date |
|---|---|---|---|
| UBS | Maintain | Neutral | 2026-01-14 |
| Piper Sandler | Maintain | Neutral | 2025-11-21 |
| Wells Fargo | Downgrade | Equal Weight | 2025-11-19 |
| Barclays | Maintain | Underweight | 2025-11-06 |
| Bernstein | Maintain | Market Perform | 2025-11-05 |
| Jefferies | Maintain | Hold | 2025-11-05 |
| Evercore ISI Group | Maintain | Outperform | 2025-11-05 |
| Wells Fargo | Maintain | Overweight | 2025-11-05 |
| UBS | Maintain | Neutral | 2025-11-05 |
| Roth Capital | Maintain | Buy | 2025-11-05 |
The consensus leans toward a Hold rating, reflecting mixed views with a tilt toward caution. Analysts maintain stable ratings with few changes, signaling a balanced outlook on Molson Coors’ near-term prospects.
Consumer Opinions
Molson Coors Beverage Company (TAP) draws mixed reactions, reflecting its strong brand legacy yet facing evolving consumer expectations.
| Positive Reviews | Negative Reviews |
|---|---|
| Iconic beer portfolio with consistent quality. | Limited innovation in new beverage flavors. |
| Affordable pricing appeals to value seekers. | Packaging feels outdated compared to rivals. |
| Wide availability across retail and bars. | Some consumers cite declining taste consistency. |
Overall, consumers praise Molson Coors for reliable quality and broad accessibility. However, frequent remarks about lack of innovation and packaging issues signal areas requiring urgent strategic focus.
Risk Analysis
The table below outlines key risks for Molson Coors Beverage Company, highlighting their likelihood and potential impact:
| Category | Description | Probability | Impact |
|---|---|---|---|
| Financial Health | Negative net margin and ROE indicate weak profitability. | High | High |
| Liquidity Risk | Current and quick ratios below 1 signal potential short-term cash issues. | High | Medium |
| Bankruptcy Risk | Altman Z-Score of 0.87 places company in distress zone. | Medium | High |
| Market Volatility | Beta of 0.49 suggests lower sensitivity, but market shifts may affect stock price. | Low | Medium |
| Debt Management | Moderate debt-to-equity ratio (0.62) with unfavorable interest coverage. | Medium | Medium |
| Dividend Sustainability | Dividend yield at 4.05% may be at risk given poor earnings. | Medium | Medium |
Molson Coors faces considerable financial stress, with losses eroding shareholder value. The distressed Altman Z-Score and poor liquidity ratios are red flags. Profitability must improve to maintain dividends and manage debt safely.
Should You Buy Molson Coors Beverage Company?
Molson Coors appears to be facing declining profitability and a very unfavorable competitive moat, suggesting value destruction. Despite manageable leverage, financial distress signals persist. The overall B- rating could be seen as cautious, reflecting mixed operational efficiency and risk.
Strength & Efficiency Pillars
Molson Coors Beverage Company shows operational resilience with a favorable gross margin of 38.37%. Interest expense remains well-controlled at -2.23%, helping cushion earnings. However, the company’s profitability metrics reflect significant challenges: return on invested capital stands at -11.77%, well below the cost of capital at 4.85%, confirming the company is currently destroying value. Given the Altman Z-Score signals distress, I limit praise to operational margins only, as financial health is severely compromised.
Weaknesses and Drawbacks
The company is in financial distress with an Altman Z-Score of 0.87, well below the 1.8 distress threshold, indicating a high bankruptcy risk. Profitability is under severe pressure, reflected in a net margin of -19.21% and a negative return on equity of -20.91%. Liquidity ratios are weak, with a current ratio of 0.55 and quick ratio of 0.42, signaling potential difficulties meeting short-term obligations. Despite a reasonable debt-to-equity ratio of 0.62, negative interest coverage heightens solvency concerns.
Our Final Verdict about Molson Coors Beverage Company
Despite the operational gross margin strength, the company’s solvency risk, highlighted by the Altman Z-Score of 0.87, makes its profile highly speculative. The deteriorating profitability and liquidity metrics suggest that Molson Coors remains too risky for conservative capital. Investors should approach with extreme caution until clear signs of financial stabilization emerge.
Disclaimer: This content is for informational purposes only and does not constitute financial, investment, or other professional advice. Investing in financial markets involves a significant risk of loss, and past performance is not indicative of future results.
Additional Resources
- Decoding Molson Coors Beverage Co (TAP): A Strategic SWOT Insigh – GuruFocus (Feb 19, 2026)
- Molson Coors Brewing (TAP) Surpasses Q4 Earnings Estimates – Yahoo Finance (Feb 18, 2026)
- Molson Coors Stock Tapped Out After Q4 Earnings: What To Know – Benzinga (Feb 18, 2026)
- Molson Coors (NYSE:TAP) Misses Q4 CY2025 Revenue Estimates, Stock Drops – Finviz (Feb 18, 2026)
- Molson Coors Beverage (NYSE:TAP) Releases FY 2026 Earnings Guidance – MarketBeat (Feb 18, 2026)
For more information about Molson Coors Beverage Company, please visit the official website: molsoncoors.com