Home > Analyses > Healthcare > Molina Healthcare, Inc.
Molina Healthcare transforms access to essential medical care for millions of low-income Americans. It dominates the managed healthcare plans sector through Medicaid, Medicare, and state marketplaces. The company’s reputation for tailored, cost-effective services sets a high bar in a complex industry. As healthcare demands evolve, I question whether Molina’s current fundamentals can sustain its market valuation and deliver long-term growth in a competitive landscape.

Table of contents
Business Model & Company Overview
Molina Healthcare, Inc. was founded in 1980 and is headquartered in Long Beach, California. It holds a dominant position in the managed healthcare sector, focusing on low-income families and individuals. Its core mission centers on delivering Medicaid, Medicare, and government-sponsored healthcare plans through a cohesive service ecosystem spanning four segments: Medicaid, Medicare, Marketplace, and Other.
The company’s revenue engine balances government contracts with managed care services across 18 states, serving roughly 5.2M members. Molina leverages its strategic presence in key U.S. markets to optimize value from recurring Medicaid and Medicare programs. This competitive advantage underpins its resilient economic moat in an evolving healthcare landscape.
Financial Performance & Fundamental Metrics
I will analyze Molina Healthcare, Inc.’s income statement, key financial ratios, and dividend payout policy to assess its core financial health and shareholder value.
Income Statement
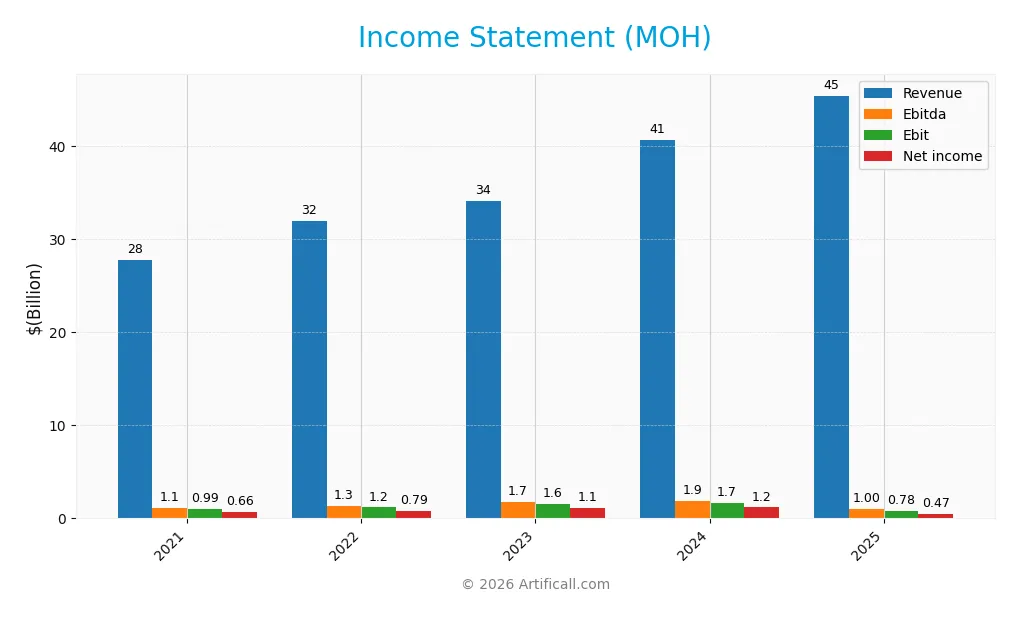
The table below summarizes Molina Healthcare, Inc.’s income statement items for fiscal years 2021 through 2025, reflecting key profitability and expense metrics.
| 2021 | 2022 | 2023 | 2024 | 2025 | |
|---|---|---|---|---|---|
| Revenue | 27.8B | 31.9B | 34.1B | 40.7B | 45.4B |
| Cost of Revenue | 24.5B | 28.0B | 29.7B | 35.9B | 40.8B |
| Operating Expenses | 2.26B | 2.75B | 2.76B | 3.03B | 3.83B |
| Gross Profit | 3.28B | 3.93B | 4.33B | 4.74B | 4.61B |
| EBITDA | 1.13B | 1.35B | 1.74B | 1.89B | 996M |
| EBIT | 995M | 1.17B | 1.57B | 1.71B | 783M |
| Interest Expense | 120M | 110M | 109M | 118M | 194M |
| Net Income | 659M | 792M | 1.09B | 1.18B | 472M |
| EPS | 11.40 | 13.70 | 18.71 | 20.52 | 8.93 |
| Filing Date | 2022-02-14 | 2023-02-13 | 2023-12-31 | 2025-02-11 | 2026-02-10 |
Income Statement Evolution
Molina Healthcare’s revenue rose 11.75% in 2025, continuing a 63.57% growth since 2021. However, gross profit declined 2.6% last year, reflecting margin pressure. EBIT and net income contracted sharply, down 54.13% and 64.18% respectively, signaling deteriorating profitability. Margins broadly weakened, with net margin falling by more than half over the period.
Is the Income Statement Favorable?
The 2025 income statement shows mixed fundamentals. Revenue growth remains favorable, supported by stable interest expense ratios. Yet, operating expenses scaled with revenue, eroding EBIT margin to 1.72%. Net income fell to 472M, dragging net margin to 1.04%. Overall, profitability metrics and earnings per share deteriorated, rendering the income statement’s outlook unfavorable despite top-line gains.
Financial Ratios
This table presents Molina Healthcare, Inc.’s key financial ratios for the fiscal years 2023 to 2025, offering a clear view of the company’s performance metrics:
| Ratios | 2023 | 2024 | 2025 |
|---|---|---|---|
| Net Margin | 3.20% | 2.90% | 1.04% |
| ROE | 25.9% | 26.2% | 11.6% |
| ROIC | 17.4% | 16.4% | 7.7% |
| P/E | 19.2 | 14.2 | 18.7 |
| P/B | 5.0 | 3.7 | 2.2 |
| Current Ratio | 1.54 | 1.62 | 1.69 |
| Quick Ratio | 1.54 | 1.62 | 1.69 |
| D/E | 0.57 | 0.69 | 0.97 |
| Debt-to-Assets | 16.0% | 19.9% | 25.4% |
| Interest Coverage | 14.4 | 14.5 | 4.0 |
| Asset Turnover | 2.29 | 2.60 | 2.92 |
| Fixed Asset Turnover | 126.2 | 141.1 | 150.9 |
| Dividend Yield | 0.0% | 0.0% | 0.0% |
Evolution of Financial Ratios
From 2021 to 2025, Molina Healthcare’s Return on Equity (ROE) showed a decline from around 25% to 11.6%. The Current Ratio improved steadily, rising from 1.43 to 1.69, indicating enhanced liquidity. Debt-to-Equity Ratio fluctuated but ended near 0.97, reflecting moderate leverage. Profitability margins contracted notably in 2025, signaling pressure on net income.
Are the Financial Ratios Fovorable?
In 2025, profitability was weak with a net margin of 1.04%, marked unfavorable. ROE and Return on Invested Capital (ROIC) hovered neutrally above WACC, which remained favorable at 5.14%. Liquidity ratios were strong, with current and quick ratios at 1.69. Leverage ratios were neutral to favorable, including debt-to-assets at 25.4%. Overall, ratios suggest a slightly favorable financial position amid profitability challenges.
Shareholder Return Policy
Molina Healthcare, Inc. does not pay dividends, reflecting a reinvestment strategy aligned with maintaining operational stability. The company’s free cash flow remains negative in recent years, limiting capacity for shareholder distributions. Share buybacks are not reported, consistent with a focus on growth and balance sheet health.
This approach prioritizes long-term value creation through reinvestment rather than immediate returns. Given the modest net profit margins and negative free cash flow, withholding dividends supports financial prudence. Sustained reinvestment aims to strengthen competitive positioning, though shareholders receive value primarily through capital appreciation rather than income.
Score analysis
Here is a radar chart illustrating Molina Healthcare’s key financial scores for a concise overview:
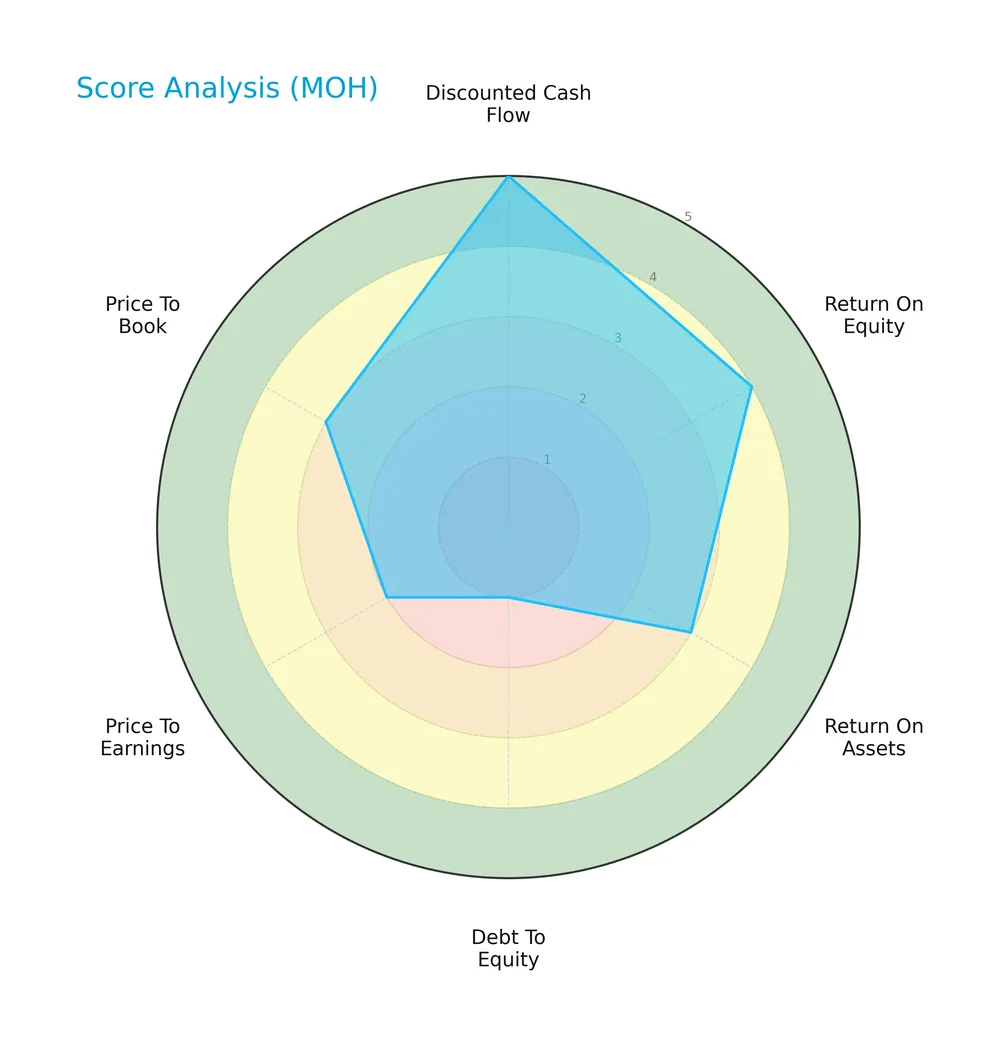
Molina Healthcare presents a very favorable discounted cash flow score of 5 and a favorable return on equity score of 4. Return on assets and price-to-book scores sit at moderate levels of 3, while debt-to-equity and price-to-earnings scores are weak at 1 and 2, respectively.
Analysis of the company’s bankruptcy risk
The Altman Z-Score places Molina Healthcare solidly in the safe zone, indicating a low risk of bankruptcy:

Is the company in good financial health?
This Piotroski diagram outlines Molina Healthcare’s financial health based on nine key criteria:

With a Piotroski Score of 6, Molina Healthcare shows average financial health. The score suggests moderate strength but leaves room for improvement in profitability and efficiency measures.
Competitive Landscape & Sector Positioning
This analysis examines Molina Healthcare, Inc.’s strategic positioning within the healthcare plans sector. I will review its revenue streams, key products, and main competitors. I aim to determine whether Molina Healthcare holds a competitive advantage in this market.
Strategic Positioning
Molina Healthcare concentrates on managed care for low-income populations through Medicaid, Medicare, and state marketplaces. The firm’s revenue heavily relies on Medicaid Solutions, contributing $30.6B in 2024, supported by Medicare ($5.5B) and Marketplace ($2.5B) segments, reflecting focused diversification within U.S. government healthcare programs.
Revenue by Segment
This pie chart presents Molina Healthcare, Inc.’s revenue breakdown by segment for the fiscal year ending 2024, highlighting the scale and distribution of its core business areas.
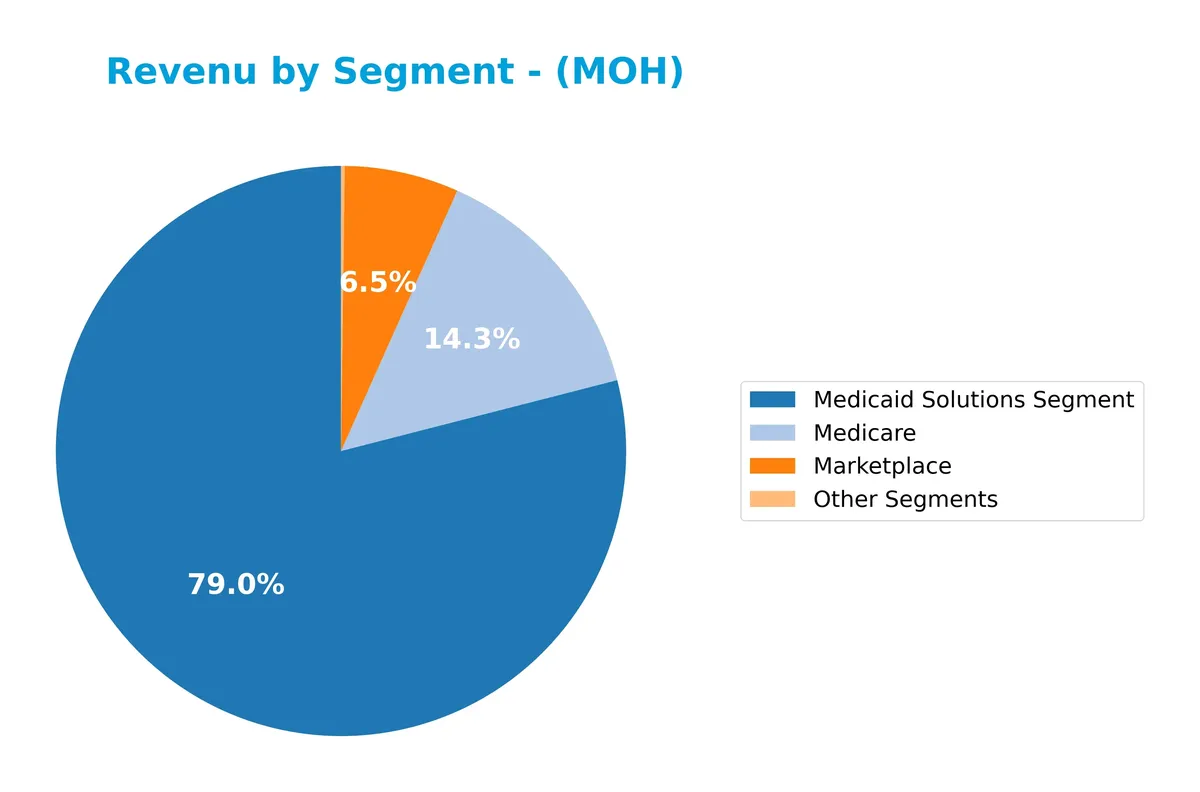
Medicaid Solutions dominates revenue with $30.6B in 2024, showing steady growth from prior years. Medicare follows with $5.5B, nearly doubling since 2022, signaling strong expansion. Marketplace revenue at $2.5B declined slightly from 2021 but remains significant. Other Segments contribute marginally at $81M, indicating minimal diversification. The concentration in Medicaid creates exposure risk but also underscores Molina’s moat in government programs.
Key Products & Brands
The table below outlines Molina Healthcare, Inc.’s main products and brands by segment and description:
| Product | Description |
|---|---|
| Medicaid Solutions Segment | Managed health care services primarily for low-income families under Medicaid programs. |
| Medicare | Health plans tailored for Medicare beneficiaries, focusing on senior and disabled populations. |
| Marketplace | Health insurance plans offered through state insurance marketplaces under the Affordable Care Act. |
| Other Segments | Miscellaneous healthcare services and programs outside the core Medicaid, Medicare, and Marketplace lines. |
Molina Healthcare’s revenue primarily stems from Medicaid and Medicare segments, reflecting its core focus on government-sponsored healthcare plans. Marketplace and other segments contribute smaller shares, underscoring a targeted product mix.
Main Competitors
There are 7 competitors in the Healthcare sector; below is the list of the top 7 leaders by market capitalization:
| Competitor | Market Cap. |
|---|---|
| UnitedHealth Group Incorporated | 305B |
| CVS Health Corporation | 102B |
| Elevance Health Inc. | 79B |
| Cigna Corporation | 75B |
| Humana Inc. | 32B |
| Centene Corporation | 20.5B |
| Molina Healthcare, Inc. | 9.7B |
Molina Healthcare ranks 7th among its competitors with a market cap just 2.12% of UnitedHealth Group’s 305B. It sits well below both the average 88.8B and median 74.6B market caps for the sector’s top players. The company maintains a significant 218.5% gap to Centene, its closest competitor above.
Comparisons with competitors
Check out how we compare the company to its competitors:
Does MOH have a competitive advantage?
Molina Healthcare, Inc. demonstrates a slight competitive advantage by generating returns on invested capital (ROIC) above its cost of capital, indicating value creation despite declining profitability. Its low beta of 0.49 suggests relative stability in the volatile healthcare plans sector.
Looking ahead, Molina’s focus on Medicaid, Medicare, and state insurance marketplaces positions it to capture growth from expanding government-sponsored healthcare programs. Opportunities may arise as it serves approximately 5.2M members across 18 states with potential for geographic and segment expansion.
SWOT Analysis
This SWOT analysis highlights Molina Healthcare’s core strategic factors to guide investment decisions.
Strengths
- Strong Medicaid and Medicare membership base
- Favorable debt-to-assets ratio at 25.4%
- Current and quick ratios at 1.69 indicate solid liquidity
Weaknesses
- Declining profitability with net margin at 1.04%
- Negative trends in EPS and net income growth
- Low dividend yield undermines income appeal
Opportunities
- Growing demand for managed healthcare in low-income populations
- Expansion potential in additional states
- Increasing government healthcare spending
Threats
- Regulatory changes impacting Medicaid/Medicare funding
- Intense competition in healthcare plans
- Rising operating expenses reducing profit margins
Molina Healthcare maintains a stable membership and liquidity base but faces profitability challenges. Strategic focus should be on cost control and leveraging growth in underserved markets while managing regulatory risks.
Stock Price Action Analysis
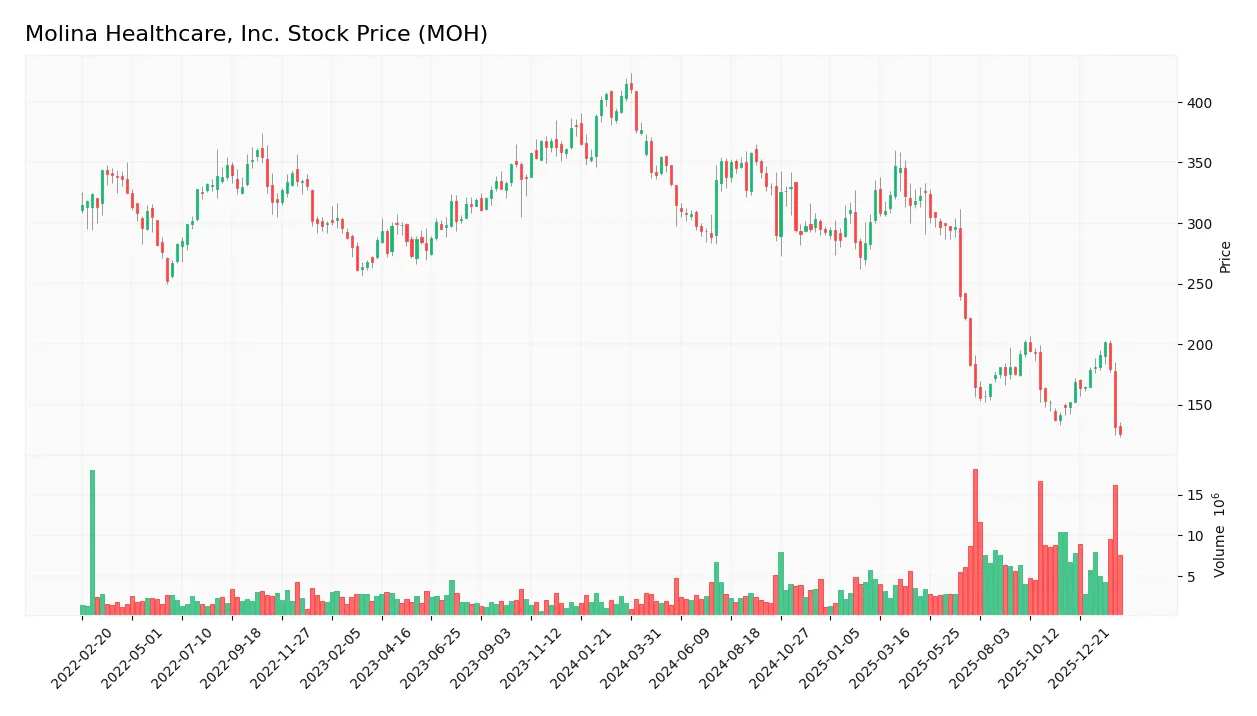
The following weekly stock chart illustrates Molina Healthcare, Inc.’s price movements and volatility over the past 100 weeks:
Trend Analysis
Over the past 100 weeks, MOH’s stock price fell sharply by 69.76%, indicating a clear bearish trend with accelerating downward momentum. The price swung between a high of 414.72 and a low of 125.43, reflecting extreme volatility with a 75.16 standard deviation.
Volume Analysis
In the last three months, trading volume has increased, with buyers slightly dominating at 54.45%. This buyer-driven activity suggests renewed investor interest despite the prevailing bearish price trend, indicating cautious optimism or accumulation phases.
Target Prices
Analysts show a bullish consensus for Molina Healthcare, Inc. with a solid range of target prices.
| Target Low | Target High | Consensus |
|---|---|---|
| 109 | 224 | 167.55 |
The target prices reflect confidence in Molina’s growth prospects, with a wide range indicating varied risk appetite among analysts.

Don’t Let Luck Decide Your Entry Point
Optimize your entry points with our advanced ProRealTime indicators. You’ll get efficient buy signals with precise price targets for maximum performance. Start outperforming now!
Analyst & Consumer Opinions
This section reviews analyst ratings and consumer feedback to provide a balanced view on Molina Healthcare, Inc. (MOH).
Stock Grades
Here are the latest verified analyst grades for Molina Healthcare, Inc. from recognized financial institutions:
| Grading Company | Action | New Grade | Date |
|---|---|---|---|
| Cantor Fitzgerald | Maintain | Neutral | 2026-02-09 |
| TD Cowen | Maintain | Hold | 2026-02-09 |
| Wells Fargo | Maintain | Overweight | 2026-01-07 |
| Barclays | Maintain | Underweight | 2026-01-05 |
| Wells Fargo | Maintain | Overweight | 2025-11-12 |
| UBS | Maintain | Neutral | 2025-10-24 |
| Cantor Fitzgerald | Maintain | Neutral | 2025-10-24 |
| Goldman Sachs | Maintain | Neutral | 2025-10-24 |
| Barclays | Downgrade | Underweight | 2025-10-24 |
| Morgan Stanley | Maintain | Equal Weight | 2025-10-14 |
The grades show a general trend of stability with a mix of neutral and hold ratings. Notably, Wells Fargo consistently rates the stock as overweight, while Barclays recently downgraded to underweight.
Consumer Opinions
Molina Healthcare, Inc. draws mixed reactions from its consumers, reflecting both trust in its services and concerns about certain operational aspects.
| Positive Reviews | Negative Reviews |
|---|---|
| Efficient claims processing speeds. | Occasional delays in customer support response. |
| Comprehensive coverage options for low-income families. | Confusing billing statements reported. |
| Friendly and knowledgeable healthcare providers. | Limited network of specialists in some regions. |
Overall, consumers appreciate Molina’s commitment to accessible healthcare and quick claims handling. However, persistent issues with customer service responsiveness and billing clarity pose challenges to user satisfaction.
Risk Analysis
Below is a summary of key risks for Molina Healthcare, Inc., including likelihood and potential impact:
| Category | Description | Probability | Impact |
|---|---|---|---|
| Regulatory Risk | Changes in Medicaid/Medicare policies could reduce reimbursements | High | High |
| Market Competition | Increased competition from other managed care providers | Medium | Medium |
| Financial Leverage | Debt-to-equity ratio near 1.0 raises concerns about financial risk | Medium | Medium |
| Profitability | Low net margin (1.04%) limits buffer against earnings shocks | High | High |
| Stock Volatility | Wide trading range (123.71–359.97) shows potential price swings | Medium | Medium |
Regulatory changes remain the most likely and impactful risk, given Molina’s reliance on government programs. The narrow net margin limits resilience to cost pressures. Financial leverage and stock volatility add moderate risk layers, demanding close monitoring.
Should You Buy Molina Healthcare, Inc.?
Molina Healthcare appears to be a company with manageable leverage and a slightly favorable moat, as it creates value despite declining profitability. While operational efficiency seems moderate, its overall B+ rating suggests a financially stable profile with some valuation and debt concerns.
Strength & Efficiency Pillars
Molina Healthcare, Inc. maintains a safe financial footing with an Altman Z-Score of 4.14, signaling low bankruptcy risk. The company shows moderate profitability, with a return on equity (ROE) of 11.6% and a return on invested capital (ROIC) of 7.66%. Notably, its weighted average cost of capital (WACC) stands at 5.14%, meaning MOH is a clear value creator as ROIC (7.66%) exceeds WACC. Operational efficiency is visible in solid asset turnovers, supporting its slightly favorable moat status despite declining ROIC trends.
Weaknesses and Drawbacks
Molina Healthcare’s valuation metrics and leverage present concerns. The price-to-earnings ratio of 18.68 is neutral but not especially cheap. Debt-to-equity ratio near 1.0 signals moderate leverage, which may amplify financial risk in downturns. The net margin is weak at 1.04%, reflecting operational pressure and declining profitability. Additionally, the company’s earnings per share and net margin have contracted sharply over recent years, indicating profitability erosion. These factors warrant caution despite stable liquidity ratios.
Our Final Verdict about Molina Healthcare, Inc.
Molina Healthcare’s profile suggests a company with stable solvency and some operational strengths, but profitability erosion and moderate leverage temper enthusiasm. Despite a safe Z-Score, the bearish long-term stock trend and recent margin declines suggest a cautious stance. The slightly favorable moat and value-creating ROIC indicate potential, but recent financial pressures may suggest waiting for a more attractive entry point. The profile might appear suitable for investors with a higher risk tolerance.
Disclaimer: This content is for informational purposes only and does not constitute financial, investment, or other professional advice. Investing in financial markets involves a significant risk of loss, and past performance is not indicative of future results.
Additional Resources
- Barclays Lowers Molina Healthcare (MOH) Price Target to $133 | M – GuruFocus (Feb 10, 2026)
- Molina Healthcare Reports Fourth Quarter and Year-End 2025 Financial Results – Business Wire (Feb 05, 2026)
- Important Notice to Long-Term Shareholders of Molina Healthcare, Inc. (MOH): Grabar Law Office Investigates Claims on Your Behalf – TMX Newsfile (Feb 09, 2026)
- Molina Healthcare Stock Craters. Why Its Earnings Outlook Is So Bleak. – Barron’s (Feb 06, 2026)
- Molina plunges as 2026 guidance disappoints (MOH:NYSE) – Seeking Alpha (Feb 05, 2026)
For more information about Molina Healthcare, Inc., please visit the official website: molinahealthcare.com