Home > Analyses > Healthcare > Moderna, Inc.
Moderna, Inc. revolutionizes healthcare by pioneering messenger RNA (mRNA) technology that transforms vaccine development and therapeutic treatments. Its groundbreaking COVID-19 vaccine reshaped pandemic response and solidified Moderna’s reputation for innovation and speed. The company leads in respiratory and immuno-oncology vaccines, partnering with industry giants to expand its pipeline. As the biotech sector evolves, I ask: does Moderna’s current valuation fully reflect its growth potential and underlying fundamentals?

Table of contents
Business Model & Company Overview
Moderna, Inc., founded in 2010 and headquartered in Cambridge, MA, leads in biotechnology with a focus on messenger RNA therapeutics and vaccines. Its ecosystem spans infectious diseases, immuno-oncology, rare and cardiovascular diseases, and auto-immune disorders. The company’s innovative pipeline integrates respiratory, latent, and public health vaccines, alongside systemic and localized therapeutics, positioning it as a pioneer in next-generation medicine.
Moderna’s revenue engine balances cutting-edge vaccine sales with strategic collaborations across the Americas, Europe, and Asia. Its portfolio includes COVID-19 and flu vaccines, supported by partnerships with AstraZeneca, Merck, and others, creating recurring revenues and robust product diversification. This combination forms a strong economic moat, securing Moderna’s role in shaping the future of global healthcare.
Financial Performance & Fundamental Metrics
I will analyze Moderna, Inc.’s income statement, key financial ratios, and dividend payout policy to assess its core financial health and shareholder value approach.
Income Statement
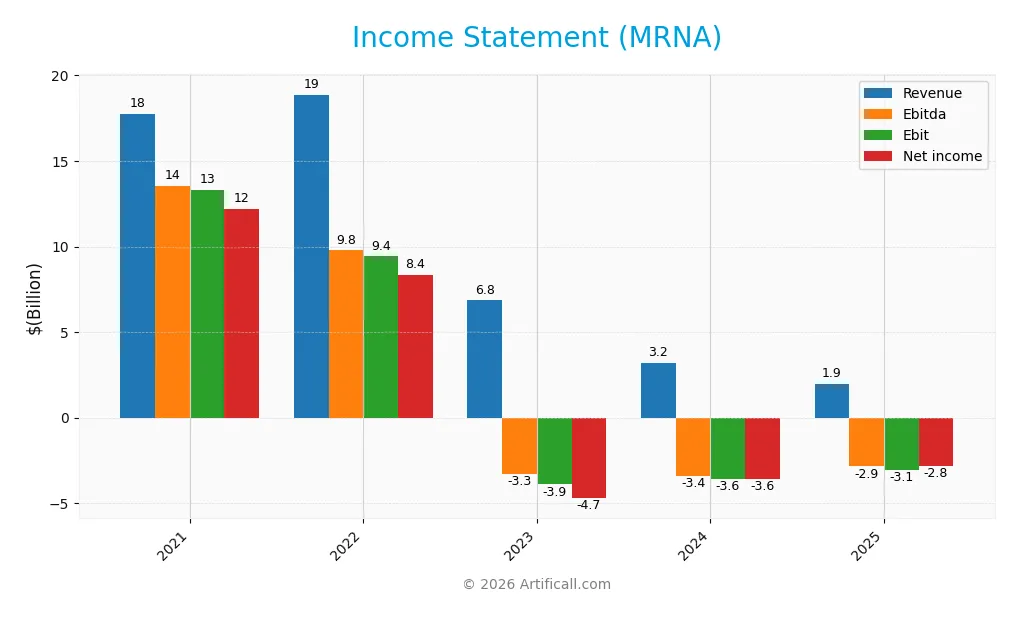
This table summarizes Moderna, Inc.’s key income statement figures for fiscal years 2021 through 2025, reflecting trends in profitability and expenses.
| 2021 | 2022 | 2023 | 2024 | 2025 | |
|---|---|---|---|---|---|
| Revenue | 17.7B | 18.9B | 6.8B | 3.2B | 1.9B |
| Cost of Revenue | 2.6B | 5.4B | 4.7B | 1.5B | 868M |
| Operating Expenses | 1.8B | 4.0B | 6.4B | 5.7B | 4.2B |
| Gross Profit | 15.1B | 13.5B | 2.2B | 1.7B | 1.1B |
| EBITDA | 13.5B | 9.8B | -3.3B | -3.4B | -2.9B |
| EBIT | 13.3B | 9.4B | -3.9B | -3.6B | -3.1B |
| Interest Expense | 18M | 29M | 38M | 24M | 0 |
| Net Income | 12.2B | 8.4B | -4.7B | -3.6B | -2.8B |
| EPS | 30.31 | 21.26 | -12.34 | -9.27 | -7.26 |
| Filing Date | 2022-02-25 | 2023-02-24 | 2024-02-23 | 2025-02-21 | 2026-02-20 |
Income Statement Evolution
Moderna’s revenue declined sharply from 17.7B in 2021 to 1.9B in 2025, reflecting an 89% drop over five years. Net income swung from a 12.2B profit in 2021 to a 2.8B loss in 2025, with net margins deteriorating significantly. Gross margins remained relatively strong at 55.35% in 2025 despite revenue contraction, but operating and net margins stayed deeply negative.
Is the Income Statement Favorable?
The 2025 income statement reveals unfavorable fundamentals. Revenue and gross profit declined nearly 40% year-over-year, while operating expenses exceeded revenue by a wide margin. Negative EBIT and net income margins of -158% and -145% indicate ongoing losses. Favorable metrics include zero interest expense and modest EBIT improvement, but overall, the income statement reflects persistent operational challenges.
Financial Ratios
The table below summarizes Moderna, Inc.’s key financial ratios for the fiscal years 2021 through 2025:
| Ratios | 2021 | 2022 | 2023 | 2024 | 2025 |
|---|---|---|---|---|---|
| Net Margin | 69% | 44% | -69% | -111% | -145% |
| ROE | 86% | 44% | -34% | -33% | -33% |
| ROIC | 78% | 39% | -27% | -33% | -30% |
| P/E | 8.39 | 8.46 | -8.06 | -4.48 | -4.07 |
| P/B | 7.24 | 3.70 | 2.74 | 1.46 | 1.33 |
| Current Ratio | 1.76 | 2.73 | 3.42 | 3.67 | 3.29 |
| Quick Ratio | 1.60 | 2.54 | 3.36 | 3.62 | 3.22 |
| D/E | 0.065 | 0.063 | 0.090 | 0.069 | 0.222 |
| Debt-to-Assets | 3.7% | 4.6% | 6.7% | 5.3% | 15.5% |
| Interest Coverage | 739 | 325 | -112 | -164 | 0 |
| Asset Turnover | 0.72 | 0.73 | 0.37 | 0.23 | 0.16 |
| Fixed Asset Turnover | 12.82 | 8.82 | 2.58 | 1.08 | 0.68 |
| Dividend Yield | 0 | 0 | 0 | 0 | 0 |
Evolution of Financial Ratios
Return on Equity (ROE) declined sharply, turning negative by 2025, reflecting deteriorating profitability. The Current Ratio remained high and relatively stable, indicating strong short-term liquidity. Debt-to-Equity Ratio increased moderately but stayed low, signaling controlled leverage. Profitability margins collapsed from positive in 2021–2022 to deep negative territory by 2025.
Are the Financial Ratios Favorable?
In 2025, profitability ratios like ROE and net margin were unfavorable, reflecting operational challenges. Liquidity was mixed: Current Ratio was high but marked unfavorable, while Quick Ratio remained favorable. Leverage ratios, including Debt-to-Equity and Debt-to-Assets, were favorable and low. Efficiency metrics such as Asset Turnover were weak. Overall, the financial ratios signal an unfavorable profile with some liquidity and leverage strengths.
Shareholder Return Policy
Moderna, Inc. does not pay dividends, reflecting its negative net income and ongoing reinvestment focus. The company prioritizes growth and R&D, which aligns with its high cash reserves and capital allocation toward innovation rather than immediate shareholder payouts.
Despite no dividends, Moderna engages in share buybacks, though their scale and impact are not detailed here. This policy supports long-term value creation by balancing capital return with reinvestment, a prudent approach given current profitability challenges.
Score analysis
The following radar chart illustrates Moderna, Inc.’s key financial scores across valuation and profitability metrics:
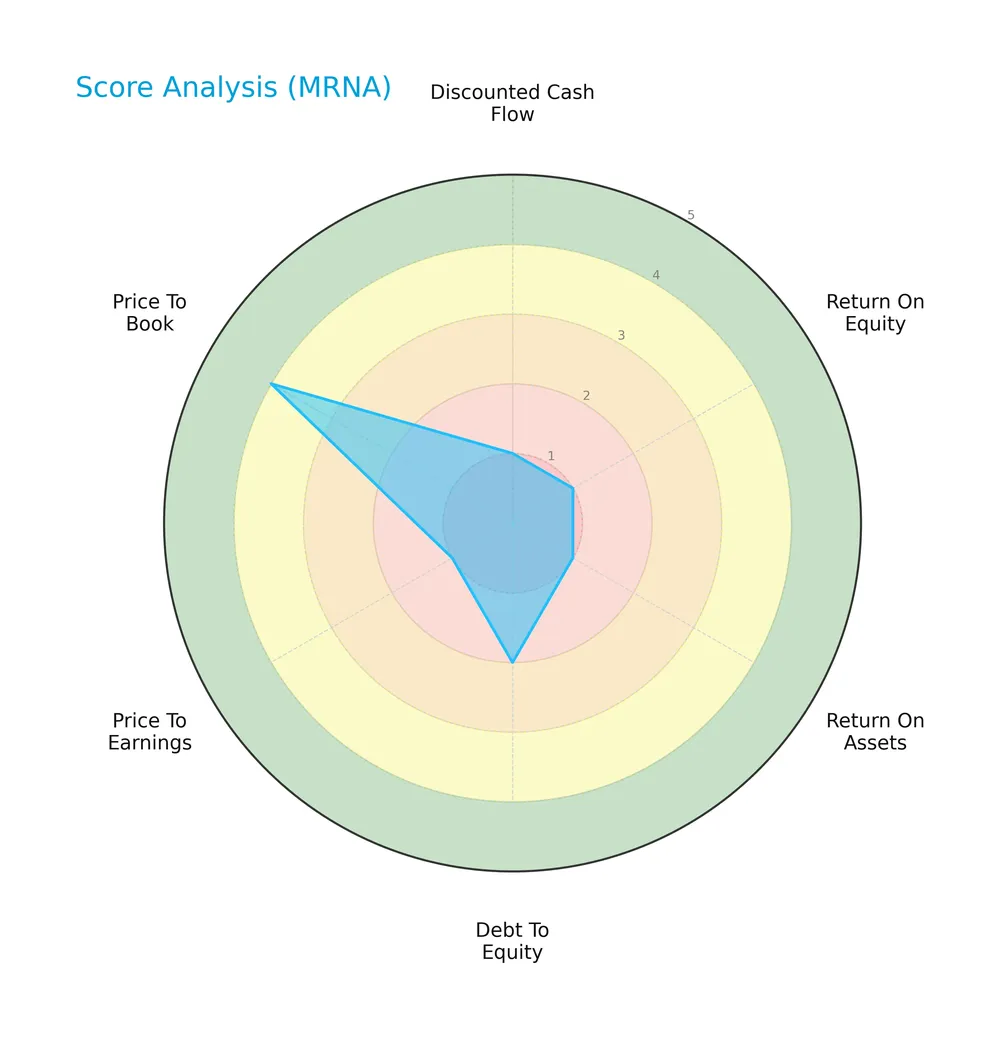
Moderna scores poorly in discounted cash flow, ROE, ROA, debt-to-equity, and P/E ratios, reflecting significant challenges. Only its price-to-book ratio stands out as favorable, indicating some market valuation support.
Analysis of the company’s bankruptcy risk
Moderna’s Altman Z-Score positions it firmly in the safe zone, signaling low bankruptcy risk and solid financial stability:

Is the company in good financial health?
The Piotroski Score diagram highlights Moderna’s weak financial health with a low score of 2 out of 9:

A very weak Piotroski Score suggests poor profitability, liquidity, and operational efficiency, indicating substantial financial risks despite low bankruptcy probability.
Competitive Landscape & Sector Positioning
This sector analysis explores Moderna, Inc.’s strategic positioning, revenue segments, key products, and main competitors. I will assess whether Moderna holds a sustainable competitive advantage in the biotechnology industry.
Strategic Positioning
Moderna, Inc. focuses on messenger RNA medicines and vaccines across infectious, immuno-oncology, and rare diseases. Its revenue declined from 19.3B in 2022 to 3.3B in 2025, showing concentration in mRNA products. Geographically, the U.S. remains the largest market, with Europe and Rest of World revenues shrinking sharply.
Revenue by Segment
This pie chart breaks down Moderna, Inc.’s revenue by product segments over the fiscal year 2025, highlighting the composition and scale of its income streams.
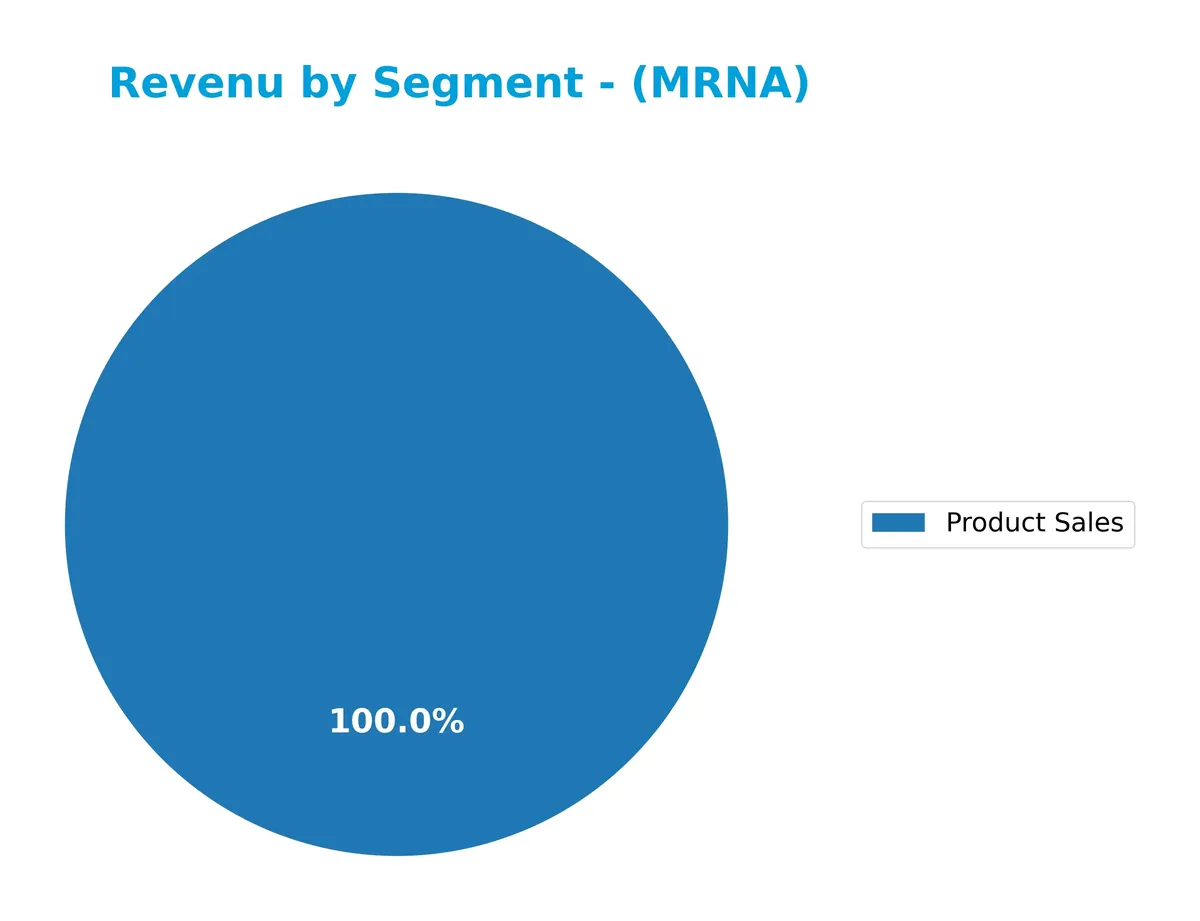
Moderna’s revenue in 2025 is concentrated entirely in Product Sales, totaling 3.3B USD. This marks a decline from 4.5B USD in 2024, signaling a slowdown in core sales. Collaboration and grant revenues, present in 2024, were negligible in 2025, indicating a shift towards reliance on direct product revenues. The trend suggests Moderna is streamlining its revenue base but faces concentration risk as diversification diminishes.
Key Products & Brands
The table below summarizes Moderna, Inc.’s key products and their descriptions:
| Product | Description |
|---|---|
| Messenger RNA (mRNA) Medicines | Therapeutics and vaccines using mRNA technology targeting infectious diseases, cancer, and rare conditions. |
| Respiratory Vaccines | Vaccines for COVID-19, flu, respiratory syncytial virus, endemic HCoV, and hMPV+PIV3. |
| Latent Vaccines | Vaccines for cytomegalovirus, Epstein-Barr virus, HIV, herpes simplex virus, and varicella-zoster. |
| Public Health Vaccines | Vaccines for Zika and Nipah viruses. |
| Cancer Vaccines | Personalized cancer vaccines including KRAS and checkpoint inhibitors. |
| Systemic Therapeutics | Systemic secreted and cell surface therapeutics, including immuno-oncology and regenerative therapies. |
Moderna’s portfolio centers on mRNA-based medicines with a broad scope across infectious and non-infectious diseases. Its respiratory, latent, and public health vaccines complement its innovative cancer and systemic therapies.
Main Competitors
There are 5 competitors identified in the Biotechnology industry; below is a table of the top 5 leaders by market capitalization:
| Competitor | Market Cap. |
|---|---|
| Vertex Pharmaceuticals Incorporated | 116B |
| Regeneron Pharmaceuticals, Inc. | 80.2B |
| Incyte Corporation | 19.9B |
| Moderna, Inc. | 12.1B |
| Bio-Techne Corporation | 9.4B |
Moderna ranks 4th among its competitors with a market cap at 16.8% of the leader, Vertex Pharmaceuticals. It sits below both the average market cap of the top 10 (47.5B) and the median sector market cap (19.9B). Moderna is just 2.18% behind the next competitor above, Incyte, signaling a narrow gap with its closest rival.
Comparisons with competitors
Check out how we compare the company to its competitors:
Does MRNA have a competitive advantage?
Moderna, Inc. does not currently present a competitive advantage, as its ROIC is significantly below its WACC, indicating value destruction and declining profitability from 2021 to 2025. The company’s income statement shows unfavorable margins and declining revenue, reinforcing operational challenges amid a shrinking market presence.
Looking ahead, Moderna targets expansion through diverse messenger RNA therapeutics and vaccines, including infectious diseases and immuno-oncology, supported by strategic alliances with major pharmaceutical firms. These opportunities may offer growth potential as it explores new markets and therapeutic areas beyond its established respiratory vaccines.
SWOT Analysis
This SWOT analysis highlights Moderna’s current strategic position and financial challenges in the evolving biotech landscape.
Strengths
- Strong mRNA technology platform
- Diverse vaccine pipeline
- Strategic alliances with top pharma
Weaknesses
- Declining revenue and net margin
- Negative ROIC and ROE
- Weak profitability and efficiency metrics
Opportunities
- Expansion in infectious and rare diseases
- Growth in immuno-oncology vaccines
- Geographic market diversification
Threats
- Intense biotech competition
- Regulatory risks and approvals
- Dependence on COVID-19 vaccine demand
Moderna’s core strength lies in its innovative mRNA platform and partnerships. However, significant profitability erosion and declining returns demand cautious capital allocation. The company must prioritize pipeline advancement and market expansion to offset intensifying competition and regulatory hurdles.
Stock Price Action Analysis
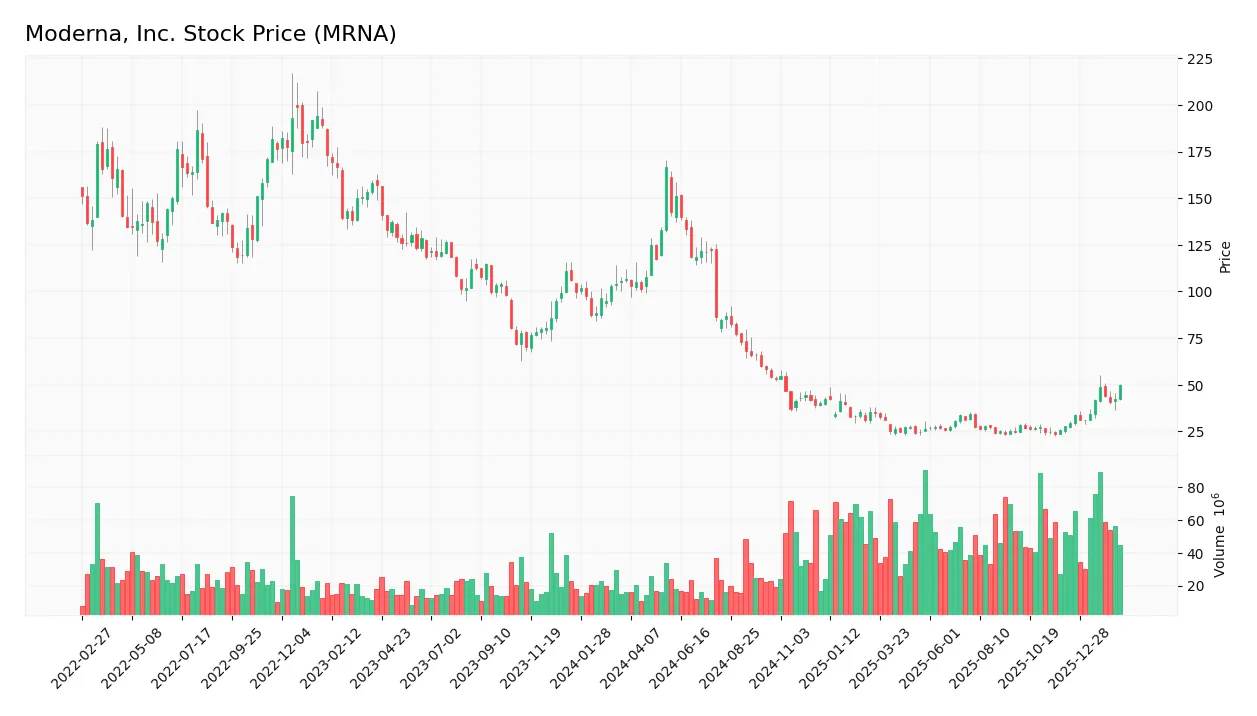
The weekly stock chart displays Moderna, Inc.’s price fluctuations and key support and resistance levels over the last 12 months:
Trend Analysis
Over the past year, Moderna’s stock price declined sharply by 53.2%, confirming a bearish trend with accelerating downward momentum. The stock exhibited high volatility, with a standard deviation of 36.74. Prices ranged between a high of 166.61 and a low of 23.51, underscoring significant market swings.
Volume Analysis
Trading volumes have increased, driven predominantly by buyers who account for 54.45% of total activity. In the recent three-month period, buyer dominance strengthened to 73.7%, indicating robust market participation and growing investor interest favoring accumulation.
Target Prices
Analysts present a broad range of target prices for Moderna, reflecting varied outlooks.
| Target Low | Target High | Consensus |
|---|---|---|
| 15 | 63 | 32.9 |
The consensus target of $32.9 suggests moderate upside from current levels, though the wide range signals uncertainty in growth prospects.

Don’t Let Luck Decide Your Entry Point
Optimize your entry points with our advanced ProRealTime indicators. You’ll get efficient buy signals with precise price targets for maximum performance. Start outperforming now!
Analyst & Consumer Opinions
This section examines analyst ratings and consumer feedback to provide a comprehensive view of Moderna, Inc.’s market perception.
Stock Grades
Here are the latest stock grades for Moderna, Inc. from several recognized analysts as of early 2026:
| Grading Company | Action | New Grade | Date |
|---|---|---|---|
| Evercore ISI Group | Maintain | In Line | 2026-02-17 |
| Goldman Sachs | Maintain | Neutral | 2026-02-17 |
| RBC Capital | Maintain | Sector Perform | 2026-02-17 |
| Morgan Stanley | Maintain | Equal Weight | 2025-12-12 |
| Piper Sandler | Maintain | Overweight | 2025-11-21 |
| RBC Capital | Maintain | Sector Perform | 2025-11-21 |
| Leerink Partners | Maintain | Underperform | 2025-11-21 |
| B of A Securities | Maintain | Underperform | 2025-11-10 |
| Barclays | Maintain | Equal Weight | 2025-11-07 |
| UBS | Maintain | Buy | 2025-10-23 |
The overall trend shows a predominance of neutral to hold ratings, with a minority of buy and underperform grades. This broad consistency suggests cautious optimism tempered by some skepticism among analysts.
Consumer Opinions
Consumers consistently express strong enthusiasm about Moderna’s innovative vaccine technology and its impact on public health. However, some concerns about pricing and side effects persist.
| Positive Reviews | Negative Reviews |
|---|---|
| “Moderna’s mRNA vaccines have revolutionized medicine.” | “Vaccine side effects were tougher than expected.” |
| “Appreciate their transparent communication during the rollout.” | “High vaccine cost limits accessibility for some.” |
| “Rapid development and approval saved countless lives.” | “Occasional supply shortages caused inconvenience.” |
Overall, consumers praise Moderna for scientific breakthroughs and transparency. Yet, side effects and pricing remain common pain points, signaling areas for improvement.
Risk Analysis
The table below summarizes key risk categories for Moderna, highlighting their probability and potential impact:
| Category | Description | Probability | Impact |
|---|---|---|---|
| Profitability Risk | Negative net margin (-145%) and ROE (-33%) signal ongoing losses and weak earnings power. | High | High |
| Liquidity Risk | Strong quick ratio (3.22) contrasts with an unfavorable current ratio (3.29), indicating asset composition concerns. | Medium | Medium |
| Operational Risk | Low asset turnover (0.16) and fixed asset turnover (0.68) reflect inefficiencies in asset use. | Medium | Medium |
| Leverage Risk | Low debt-to-equity (0.22) and debt-to-assets (15.5%) ratios reduce solvency concerns. | Low | Low |
| Market Volatility | Beta of 1.34 implies higher stock price swings relative to the market, increasing investment risk. | High | Medium |
| Credit Risk | Interest coverage ratio at 0 raises red flags about ability to service debt interest expenses. | High | High |
| Valuation Risk | Favorable price-to-book (1.33) but negative P/E (-4.07) suggests market skepticism about earnings. | Medium | Medium |
| Financial Health | Altman Z-Score of 3.84 in safe zone contrasts with weak Piotroski score (2), signaling mixed financial strength. | Medium | Medium |
Moderna’s most pressing risks are its severe profitability losses and inability to cover interest expenses, despite a healthy balance sheet. The biotech sector’s typical R&D intensity and regulatory hurdles amplify these challenges. Investors should monitor operational efficiency improvements and pipeline progress closely.
Should You Buy Moderna, Inc.?
Moderna appears to be experiencing declining profitability and value destruction, suggesting a very unfavorable competitive moat. Despite a manageable leverage profile and a safe Altman Z-Score, its overall rating is a cautious C, reflecting significant operational challenges.
Strength & Efficiency Pillars
Moderna, Inc. reports a strong gross margin of 55.35%, highlighting operational efficiency. Despite an unfavorable net margin of -145.16% and negative ROIC of -29.7%, its Altman Z-Score of 3.84 places it securely in the safe zone, indicating solid solvency. The company benefits from a low debt-to-equity ratio of 0.22, suggesting conservative leverage. However, with ROIC below the WACC of 9.38%, Moderna is currently a value destroyer rather than a creator.
Weaknesses and Drawbacks
Moderna faces significant profitability challenges, reflected in a net margin of -145.16% and a return on equity of -32.62%, both deeply unfavorable. The company’s Piotroski Score is very weak at 2, signaling financial distress in operational performance. While its price-to-book ratio stands at a reasonable 1.33, the negative price-to-earnings ratio (-4.07) implies losses. Additionally, interest coverage of zero raises concerns about its ability to service debt, despite a strong current ratio of 3.29.
Our Final Verdict about Moderna, Inc.
Moderna’s profile suggests caution. Despite a safe solvency position (Altman Z-Score 3.84) and recent strong buyer dominance (74%), its continued value destruction and weak profitability undermine its appeal. The bearish long-term trend and unfavorable financial metrics might indicate that investors should adopt a wait-and-see approach, seeking a better entry point as operational improvements emerge.
Disclaimer: This content is for informational purposes only and does not constitute financial, investment, or other professional advice. Investing in financial markets involves a significant risk of loss, and past performance is not indicative of future results.
Additional Resources
- Moderna says FDA will now consider its new mRNA flu shot after initial refusal – PBS (Feb 18, 2026)
- Moderna | History, Innovation, Challenges, & Facts | Britannica Money – Britannica (Feb 18, 2026)
- FDA agrees to review Moderna mRNA flu vaccine in dramatic reversal – Scientific American (Feb 18, 2026)
- BNP PARIBAS ASSET MANAGEMENT Holding S.A. Cuts Stake in Moderna, Inc. $MRNA – MarketBeat (Feb 21, 2026)
- Decoding Moderna Inc (MRNA): A Strategic SWOT Insight – GuruFocus (Feb 21, 2026)
For more information about Moderna, Inc., please visit the official website: modernatx.com