Home > Analyses > Consumer Cyclical > Mobileye Global Inc.
Mobileye reshapes how millions navigate roads daily through cutting-edge autonomous driving and safety systems. Its advanced driver assistance solutions lead the auto parts industry, blending real-time detection with cloud-enhanced intelligence. Known for innovation and robust partnerships, Mobileye pushes boundaries in vehicle autonomy and mobility services. As the race for self-driving dominance intensifies, I ask: does Mobileye’s current financial footing and technology pipeline justify its market valuation and growth promise?

Table of contents
Business Model & Company Overview
Mobileye Global Inc., founded in 1999 and headquartered in Jerusalem, Israel, commands a leading position in the auto parts industry with its advanced driver assistance systems (ADAS) and autonomous driving technologies. The company builds a cohesive ecosystem spanning safety alerts, emergency interventions, and point-to-point assisted driving, integrating real-time detection with cloud-based enhancements. Its suite ranges from Mobileye SuperVision to Level 4 autonomous solutions, reflecting a mission to revolutionize mobility globally.
Mobileye’s revenue engine balances recurring software services and cutting-edge hardware, leveraging cloud computing for constant updates and enhanced road experience management. It serves diverse markets across the Americas, Europe, and Asia, capitalizing on growing demand for autonomous and semi-autonomous vehicle solutions. With strong technological integration and global reach, Mobileye sustains a robust economic moat that shapes the future of autonomous driving.
Financial Performance & Fundamental Metrics
I will analyze Mobileye Global Inc.’s income statement, key financial ratios, and dividend payout policy to assess its financial health and growth potential.
Income Statement
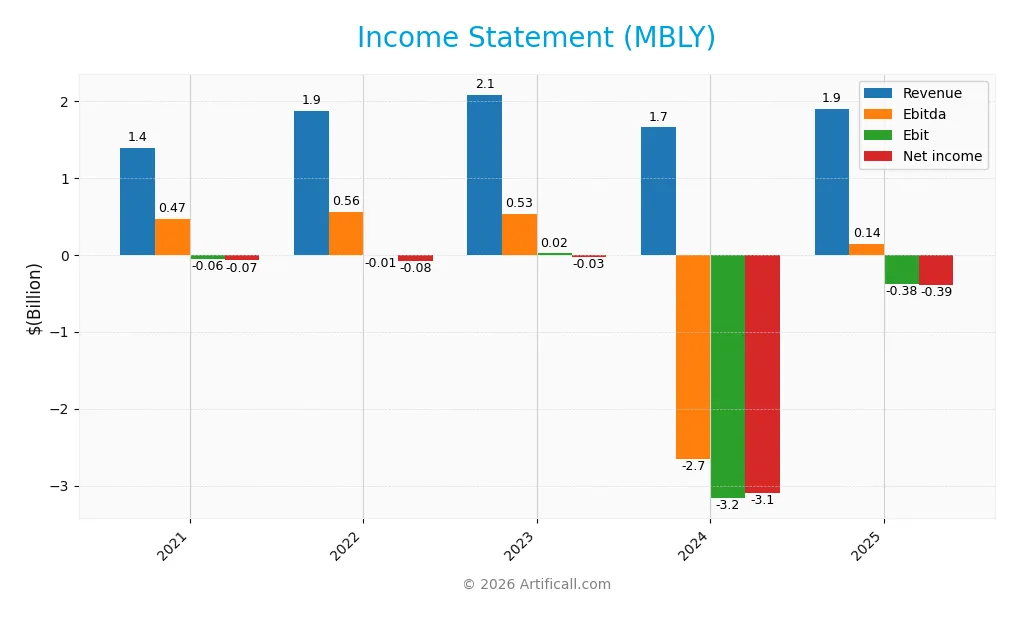
The table below presents Mobileye Global Inc.’s income statement figures for fiscal years 2021 through 2025, reflecting revenue, expenses, profitability, and earnings per share.
| 2021 | 2022 | 2023 | 2024 | 2025 | |
|---|---|---|---|---|---|
| Revenue | 1.39B | 1.87B | 2.08B | 1.65B | 1.89B |
| Cost of Revenue | 731M | 947M | 1.03B | 913M | 990M |
| Operating Expenses | 712M | 959M | 1.08B | 3.97B | 1.34B |
| Gross Profit | 655M | 922M | 1.05B | 741M | 904M |
| EBITDA | 469M | 559M | 529M | -2.66B | 140M |
| EBIT | -57M | -8M | 16M | -3.16B | -377M |
| Interest Expense | 0 | 24M | 0 | 0 | 0 |
| Net Income | -75M | -82M | -27M | -3.09B | -392M |
| EPS | -0.09 | -0.10 | -0.03 | -3.82 | -0.48 |
| Filing Date | 2021-12-31 | 2023-03-09 | 2024-02-23 | 2025-02-13 | 2026-02-12 |
Income Statement Evolution
Mobileye’s revenue rose steadily from $1.39B in 2021 to $1.89B in 2025, marking a 36.7% growth over five years. Gross profit expanded notably, with a favorable gross margin near 48% in 2025. However, net income remained negative, though losses narrowed significantly in 2025 compared to prior years. Margins showed improvement, but the net margin stayed unfavorable at -20.7%.
Is the Income Statement Favorable?
In 2025, Mobileye delivered a 14.5% revenue increase and a sharp 88% growth in EBIT, signaling operational improvement. Despite a negative EBIT margin of -19.9%, the reduction in losses and absence of interest expenses support a more favorable financial stance. Overall, the fundamentals reflect progress but highlight ongoing profitability challenges.
Financial Ratios
The table below summarizes key financial ratios for Mobileye Global Inc. over the last five fiscal years:
| Ratios | 2021 | 2022 | 2023 | 2024 | 2025 |
|---|---|---|---|---|---|
| Net Margin | -5.4% | -4.4% | -1.3% | -187% | -20.7% |
| ROE | -0.47% | -0.55% | -0.18% | -25.6% | -3.3% |
| ROIC | -0.35% | -0.25% | 0.36% | -25.7% | -3.6% |
| P/E | -308 | -343 | -1292 | -5.24 | -21.6 |
| P/B | 1.45 | 1.90 | 2.34 | 1.34 | 0.71 |
| Current Ratio | 4.79 | 3.95 | 5.13 | 6.53 | 6.10 |
| Quick Ratio | 4.58 | 3.65 | 4.16 | 5.28 | 5.30 |
| D/E | 0 | 0 | 0.0034 | 0.0041 | 0.0056 |
| Debt-to-Assets | 0 | 0 | 0.0032 | 0.0040 | 0.0054 |
| Interest Coverage | 0 | -1.54 | 0 | 0 | 0 |
| Asset Turnover | 0.08 | 0.12 | 0.13 | 0.13 | 0.15 |
| Fixed Asset Turnover | 4.56 | 4.87 | 4.19 | 3.61 | 4.00 |
| Dividend Yield | 0 | 1.20% | 0 | 0 | 0 |
Evolution of Financial Ratios
Return on Equity (ROE) showed persistent weakness, hovering around -3.3% in 2025, signaling ongoing profitability challenges. The Current Ratio remained elevated, peaking above 6 in 2024 and slightly declining to 6.1 in 2025, indicating strong liquidity but potential inefficiency. The Debt-to-Equity ratio stayed minimal at 0.01, reflecting a conservative leverage approach with stable debt levels.
Are the Financial Ratios Favorable?
Profitability ratios like net margin (-20.7%) and ROE (-3.3%) are unfavorable, confirming weak earnings despite a favorable weighted average cost of capital (6.24%). Liquidity is mixed: a high Current Ratio (6.1) is unfavorable due to potential asset inefficiency, but the Quick Ratio (5.3) is favorable. Leverage is low and favorable, while asset turnover (0.15) is unfavorable. Overall, the financial ratios present a neutral stance, balancing strengths and weaknesses.
Shareholder Return Policy
Mobileye Global Inc. does not pay dividends, reflecting its negative net income and ongoing reinvestment in growth and innovation. The company does not engage in share buybacks, focusing capital on expanding its technology and market reach.
This policy aligns with a long-term strategy prioritizing shareholder value creation through growth rather than immediate distributions. While this approach suits Mobileye’s current phase, investors should monitor profitability and cash flow trends to assess sustainability.
Score analysis
The radar chart below illustrates key financial metrics for Mobileye Global Inc., highlighting strengths and weaknesses across valuation and profitability:
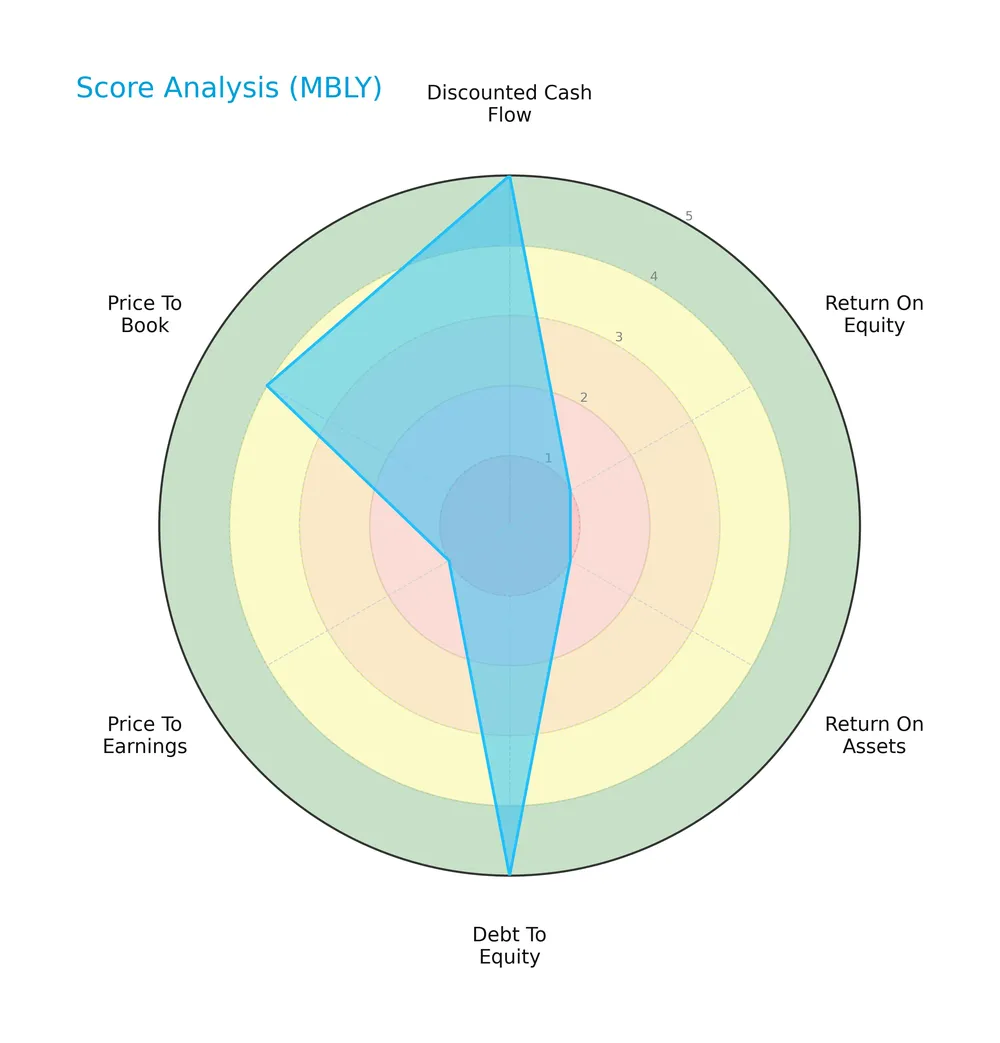
Mobileye scores very favorably on discounted cash flow and debt-to-equity, showing strong capital management and low leverage. However, return on equity, return on assets, and price-to-earnings scores are very unfavorable, signaling profitability challenges. The price-to-book score is favorable, suggesting moderate market valuation relative to book value.
Analysis of the company’s bankruptcy risk
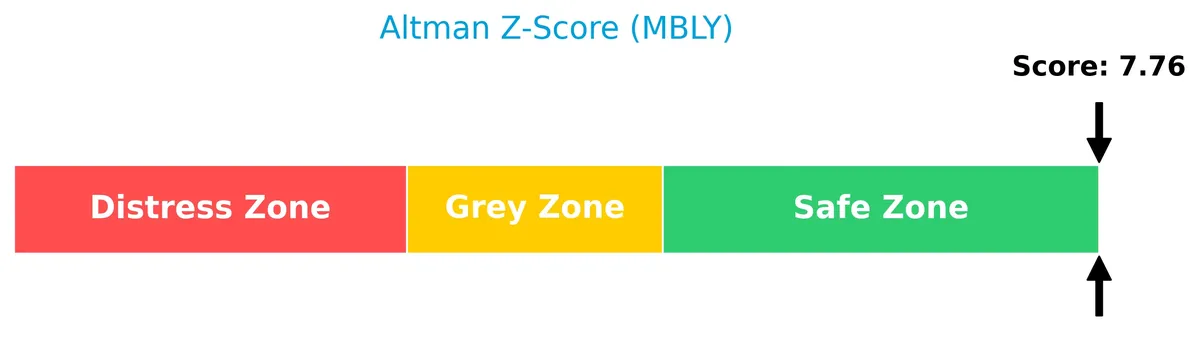
Mobileye’s Altman Z-Score places it firmly in the safe zone, indicating a low risk of bankruptcy based on its financial ratios:
Is the company in good financial health?
The Piotroski Score diagram provides insight into Mobileye’s current financial condition based on nine fundamental criteria:

With a Piotroski Score of 3, Mobileye is classified as very weak, reflecting underlying financial weaknesses despite a strong capital structure. This low score signals caution regarding operational efficiency and profitability metrics.
Competitive Landscape & Sector Positioning
This analysis examines Mobileye Global Inc.’s sector, focusing on strategic positioning, revenue segments, and key products. I will assess whether Mobileye holds a competitive advantage over its main competitors in the auto parts industry.
Strategic Positioning
Mobileye Global Inc. concentrates its revenue largely in advanced driver assistance systems under a single segment. Geographically, it diversifies across key markets, including the US (416M), China (428M), Germany (297M), and Korea (192M), balancing mature and emerging regions.
Revenue by Segment
This pie chart illustrates Mobileye Global Inc.’s revenue distribution by segment over the fiscal year 2025, highlighting the dominance of its core Mobileye business.
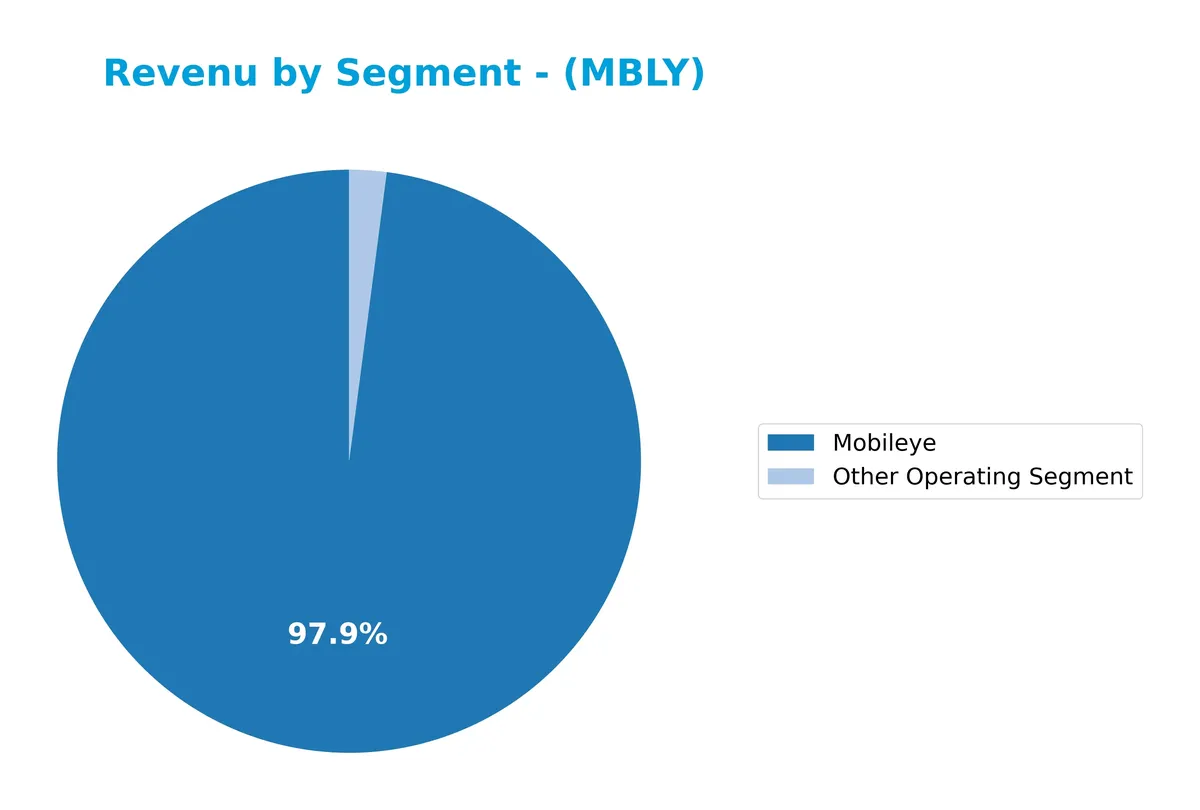
Mobileye remains the powerhouse, generating $1.86B in 2025, up from $1.61B in 2024, signaling solid growth momentum. Other segments contribute marginally, around $39M, showing limited diversification. The revenue concentration in Mobileye underscores both its strategic moat and a potential risk if market dynamics shift. The recent acceleration after a dip in 2023 reflects a rebound in core demand, affirming Mobileye’s leadership in autonomous driving technology.
Key Products & Brands
Mobileye Global Inc. offers advanced driver assistance and autonomous driving technologies, including several key solutions:
| Product | Description |
|---|---|
| Driver Assist | ADAS and autonomous vehicle solutions with real-time detection of road users, geometry, semantics, and markings providing safety alerts and emergency interventions. |
| Cloud-Enhanced Driver Assist | Real-time scene interpretation for drivers leveraging cloud technology. |
| Mobileye SuperVision Lite | A driver assist solution offering enhanced situational awareness. |
| Mobileye SuperVision | Point-to-point assisted driving navigation with cloud-based updates and road experience management. |
| Mobileye Chauffeur | Generation autonomous driving solution. |
| Mobileye Drive | Level 4 autonomous driving system covering self-driving vehicles and Autonomous Mobility as a Service. |
Mobileye’s product portfolio centers on safety and autonomy, integrating cloud computing to enhance driver assistance and autonomous vehicle capabilities. The company’s offerings span from ADAS to fully autonomous driving systems.
Main Competitors
Mobileye Global Inc. faces competition from 4 main companies in the Auto – Parts industry; here are the top 4 leaders by market capitalization:
| Competitor | Market Cap. |
|---|---|
| O’Reilly Automotive, Inc. | 76.3B |
| AutoZone, Inc. | 55.3B |
| Aptiv PLC | 17.0B |
| Mobileye Global Inc. | 8.5B |
Mobileye ranks 4th among its competitors with a market cap just 9.8% of the leader’s size. It sits below both the average market cap of the top 10 (39.3B) and the sector median (36.1B). The company maintains a significant 126.6% gap to Aptiv, its closest rival above.
Comparisons with competitors
Check out how we compare the company to its competitors:
Does MBLY have a competitive advantage?
Mobileye Global Inc. currently lacks a competitive advantage, as it is destroying value with a declining ROIC well below its WACC. This indicates inefficient capital use and deteriorating profitability over the 2021-2025 period.
Looking ahead, Mobileye targets growth through advanced driver assistance and autonomous driving solutions worldwide. Expansion into new markets and product upgrades, including cloud-enhanced features and Level 4 autonomy, present future revenue opportunities despite current challenges.
SWOT Analysis
This SWOT analysis distills Mobileye Global Inc.’s core strategic factors to guide investment decisions.
Strengths
- strong revenue growth
- leading ADAS technology
- low debt levels
Weaknesses
- negative net margin
- declining ROIC
- weak profitability metrics
Opportunities
- expanding autonomous vehicle market
- cloud-based enhancements
- global geographic diversification
Threats
- intense competition
- regulatory risks
- technology adoption delays
Mobileye shows promising growth and technological leadership but struggles with profitability and value destruction. The company must leverage market trends while managing cost and execution risks to improve shareholder value.
Stock Price Action Analysis
The following weekly stock chart illustrates Mobileye Global Inc.’s price movements and volatility over the past 12 months:
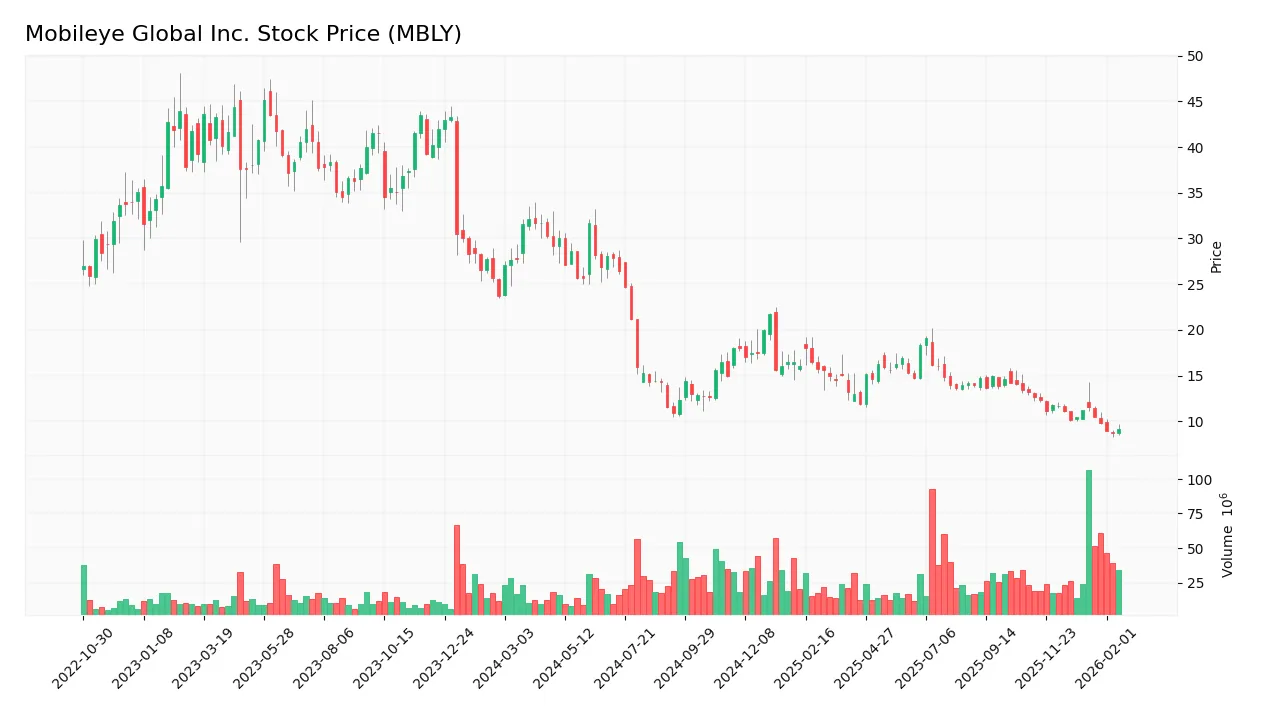
Trend Analysis
Over the past 12 months, MBLY’s stock price declined sharply by 70.89%, indicating a clear bearish trend. The price dropped from a high of 32.15 to a low of 8.71, with volatility measured by a standard deviation of 6.06. The downtrend shows deceleration, suggesting the pace of decline is slowing.
Volume Analysis
Trading volumes over the last three months show an increasing trend. Seller volume dominates at 57.52%, indicating slight selling pressure. This seller-driven activity points to cautious market participation and subdued investor confidence during the recent period.
Target Prices
Analysts project a target consensus that suggests moderate upside potential for Mobileye Global Inc.
| Target Low | Target High | Consensus |
|---|---|---|
| 11 | 28 | 16.71 |
The target range reflects cautious optimism, with a consensus price indicating a roughly 10-20% potential gain from current levels.

Don’t Let Luck Decide Your Entry Point
Optimize your entry points with our advanced ProRealTime indicators. You’ll get efficient buy signals with precise price targets for maximum performance. Start outperforming now!
Analyst & Consumer Opinions
This section reviews analyst grades and consumer feedback to provide insights into Mobileye Global Inc.’s market perception.
Stock Grades
Here are the latest verified analyst grades for Mobileye Global Inc., reflecting current market sentiment and trends:
| Grading Company | Action | New Grade | Date |
|---|---|---|---|
| Tigress Financial | Maintain | Buy | 2026-01-29 |
| RBC Capital | Maintain | Sector Perform | 2026-01-23 |
| Morgan Stanley | Maintain | Equal Weight | 2026-01-23 |
| Needham | Maintain | Buy | 2026-01-23 |
| UBS | Maintain | Neutral | 2026-01-23 |
| Canaccord Genuity | Maintain | Buy | 2026-01-23 |
| Wells Fargo | Maintain | Overweight | 2026-01-23 |
| HSBC | Downgrade | Hold | 2026-01-23 |
| UBS | Maintain | Neutral | 2026-01-14 |
| Wolfe Research | Downgrade | Peer Perform | 2026-01-12 |
The majority of analysts maintain a Buy or equivalent stance, signaling confidence in Mobileye’s prospects. However, notable downgrades to Hold and Peer Perform highlight some caution in the near term.
Consumer Opinions
Consumer sentiment around Mobileye Global Inc. (MBLY) reveals a blend of enthusiasm for innovation and concerns about product integration.
| Positive Reviews | Negative Reviews |
|---|---|
| “Mobileye’s advanced driver-assist tech feels cutting-edge and reliable.” | “Some updates caused system glitches affecting performance temporarily.” |
| “Their safety features have noticeably improved my driving confidence.” | “Customer service response times could be faster and more helpful.” |
| “The integration with various car models is seamless and intuitive.” | “Pricing seems high compared to similar offerings in the market.” |
Overall, consumers praise Mobileye’s technology and safety benefits, but they frequently cite issues with software updates and customer support. Pricing remains a moderate concern for some users.
Risk Analysis
Below is a summary table of key risks facing Mobileye Global Inc. (MBLY) as of 2026:
| Category | Description | Probability | Impact |
|---|---|---|---|
| Profitability | Negative net margin (-20.7%) signals persistent losses. | High | High |
| Financial Health | Very weak Piotroski score (3) indicates fragile fundamentals. | High | Medium |
| Liquidity | Extremely high current ratio (6.1) may indicate inefficient capital use. | Medium | Medium |
| Market Volatility | Low beta (0.56) moderates stock price swings but limits upside. | Medium | Low |
| Debt Management | Very low debt (D/E 0.01) reduces financial risk. | Low | Low |
| Innovation Risk | Heavy reliance on autonomous driving tech; market adoption uncertain. | Medium | High |
I view Mobileye’s biggest risks as ongoing unprofitability and weak financial health. Despite a strong balance sheet and safe Altman Z-Score (7.76), losses reflect tough competition and high R&D costs. The company’s low ROIC (-3.64%) against WACC (6.24%) warns of value destruction. Its innovative edge is promising but demands patience, given the evolving ADAS/autonomous vehicle market. Investors must weigh these factors carefully against Mobileye’s growth potential.
Should You Buy Mobileye Global Inc.?
Mobileye’s analytical profile appears to be mixed, with improving operational efficiency but persistent value destruction indicated by its declining ROIC versus WACC. Despite a manageable leverage profile and a strong Altman Z-score signaling financial stability, its profitability and moat remain very unfavorable. The company’s overall rating of B suggests moderate investment appeal amid risks.
Strength & Efficiency Pillars
Mobileye Global Inc. posts a favorable gross margin of 47.73%, reflecting operational efficiency in its core business. The company maintains a very low debt-to-equity ratio of 0.01, signaling conservative leverage. Its weighted average cost of capital (WACC) stands at a reasonable 6.24%, supporting capital discipline. However, Mobileye’s return on invested capital (ROIC) is negative at -3.64%, indicating value destruction rather than creation. Despite solid operational margins, profitability metrics like ROE (-3.3%) and net margin (-20.7%) remain unfavorable.
Weaknesses and Drawbacks
Mobileye is in the safe zone with an Altman Z-Score of 7.76, yet it faces serious challenges. Negative profitability metrics, including a net margin of -20.7% and ROE of -3.3%, raise concerns about earnings quality and capital efficiency. The current ratio at 6.1 is unusually high, which may indicate inefficient working capital management. The stock’s price-to-earnings ratio is negative, reflecting losses, though the price-to-book ratio of 0.71 suggests undervaluation. Market pressure is evident with a seller-dominant trend and a 38.03% buyer volume, signaling investor caution.
Our Final Verdict about Mobileye Global Inc.
Mobileye’s long-term fundamental profile appears mixed. Despite a strong balance sheet and operational efficiency, the sustained negative returns on capital and earnings losses suggest significant challenges ahead. The bearish price trend and recent seller dominance warrant caution. This profile might appear speculative and better suited for risk-tolerant investors willing to wait for a turnaround. Conservative capital may find the risk-reward profile too uncertain for immediate exposure.
Disclaimer: This content is for informational purposes only and does not constitute financial, investment, or other professional advice. Investing in financial markets involves a significant risk of loss, and past performance is not indicative of future results.
Additional Resources
- Mobileye Global Inc. (MBLY) Anticipates Annual Revenue Below Expectations as Tariffs Weigh on Automakers – Yahoo Finance (Feb 11, 2026)
- Skylands Capital LLC Increases Stock Position in Mobileye Global Inc. $MBLY – MarketBeat (Feb 11, 2026)
- India’s second-largest auto maker selects Mobileye’s ADAS for six new models (MBLY:NASDAQ) – Seeking Alpha (Feb 10, 2026)
- Analysts Reiterate Mobileye Global (MBLY) Upside Post Earnings – Finviz (Feb 03, 2026)
- How is MBLY Stock Positioned for 2026 After a Strong 2025? – Nasdaq (Jan 26, 2026)
For more information about Mobileye Global Inc., please visit the official website: mobileye.com