Home > Analyses > Real Estate > Mid-America Apartment Communities, Inc.
Mid-America Apartment Communities, Inc. shapes how tens of thousands live by providing quality apartment homes across key U.S. regions. As a dominant REIT in residential real estate, MAA excels in owning, managing, and developing large-scale communities with a reputation for consistent innovation and operational excellence. I’ve observed that its strategic footprint in the Southeast and Mid-Atlantic fuels steady rental demand. The critical question: does MAA’s financial strength still support its premium valuation and growth prospects today?

Table of contents
Business Model & Company Overview
Mid-America Apartment Communities, Inc. is a leading REIT specializing in quality apartment communities. Founded in 1994 and headquartered in Germantown, TN, it commands a significant presence across 16 states and the District of Columbia. The company’s ecosystem integrates ownership, management, acquisition, development, and redevelopment, driving a cohesive strategy in residential real estate. Its focus on full-cycle investment performance has cemented its status as a dominant player within the residential REIT sector.
The company generates value through a diversified portfolio of 102,772 apartment units, balancing stable rental income with strategic development projects. Its footprint spans the Southeast, Southwest, and Mid-Atlantic regions, anchoring its revenue engine in high-growth U.S. markets. This geographic spread supports resilient cash flows and growth potential. The firm’s economic moat lies in its scale and operational expertise, shaping the future of multifamily housing investment.
Financial Performance & Fundamental Metrics
I analyze Mid-America Apartment Communities, Inc.’s income statement, key financial ratios, and dividend payout policy to assess its core financial health and shareholder value.
Income Statement
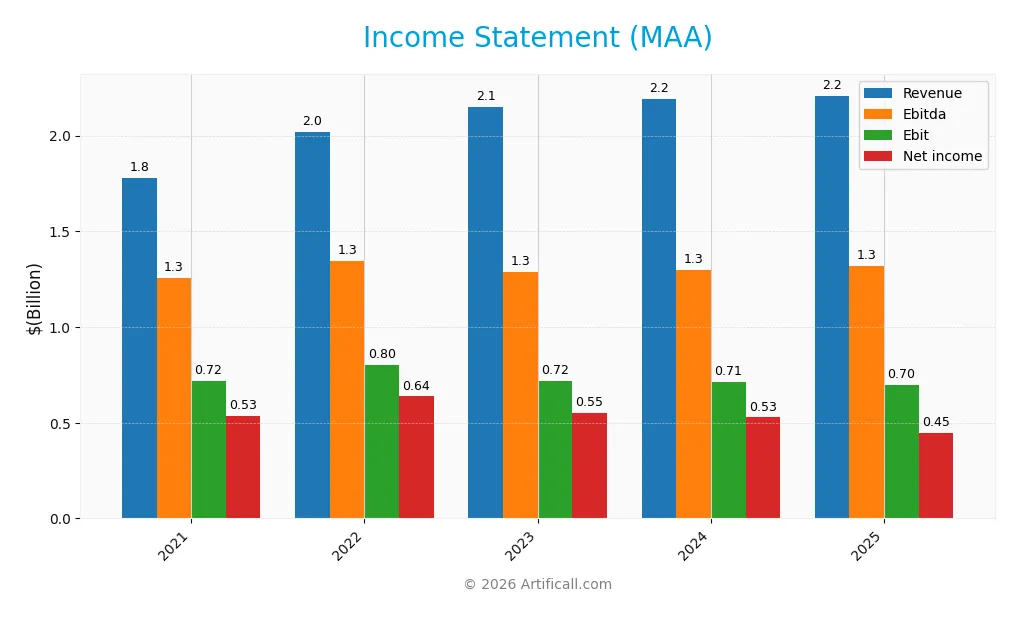
This table presents Mid-America Apartment Communities, Inc.’s key income statement figures over the past five fiscal years, highlighting revenue, profitability, and earnings per share trends.
| 2021 | 2022 | 2023 | 2024 | 2025 | |
|---|---|---|---|---|---|
| Revenue | 1.78B | 2.02B | 2.15B | 2.19B | 2.21B |
| Cost of Revenue | 1.26B | 1.33B | 1.40B | 1.48B | 1.51B |
| Operating Expenses | 53M | 59M | 59M | 57M | 84M |
| Gross Profit | 518M | 688M | 747M | 713M | 703M |
| EBITDA | 1.25B | 1.35B | 1.29B | 1.30B | 1.32B |
| EBIT | 720M | 802M | 720M | 713M | 696M |
| Interest Expense | 157M | 155M | 149M | 169M | 185M |
| Net Income | 534M | 637M | 553M | 528M | 447M |
| EPS | 4.62 | 5.49 | 4.71 | 4.49 | 3.79 |
| Filing Date | 2022-02-17 | 2023-02-14 | 2024-02-09 | 2025-02-07 | 2026-02-06 |
Income Statement Evolution
Mid-America Apartment Communities saw revenue rise 24.2% from 2021 to 2025, but growth slowed to 0.8% in the last year. Gross profit declined slightly by 1.4% in 2025, reflecting margin pressure. EBIT and net income both fell in 2025, pushing net margin down 16%, signaling deteriorating profitability despite stable revenue.
Is the Income Statement Favorable?
The 2025 income statement shows a 31.8% gross margin and 31.5% EBIT margin, both favorable by industry standards. However, net margin slipped to 20.2%, down 16% year-over-year. Interest expense remains neutral at 8.4% of revenue. Overall, profitability and EPS declined, highlighting weakening fundamentals and an unfavorable income statement trend.
Financial Ratios
The table below summarizes key financial ratios for Mid-America Apartment Communities, Inc. over the last five fiscal years:
| Ratios | 2021 | 2022 | 2023 | 2024 | 2025 |
|---|---|---|---|---|---|
| Net Margin | 30.0% | 31.6% | 25.7% | 24.1% | 20.2% |
| ROE | 8.9% | 10.6% | 9.0% | 8.8% | 7.9% |
| ROIC | 4.2% | 5.9% | 6.3% | 5.8% | 10.2% |
| P/E | 49.3 | 28.4 | 28.3 | 34.2 | 36.4 |
| P/B | 4.39 | 3.01 | 2.56 | 3.03 | 2.87 |
| Current Ratio | 0.22 | 0.11 | 0.05 | 0.08 | 0.00 |
| Quick Ratio | 0.22 | 0.11 | 0.05 | 0.08 | 0.00 |
| D/E | 0.75 | 0.74 | 0.75 | 0.84 | 0.95 |
| Debt-to-Assets | 40.0% | 39.5% | 39.8% | 42.4% | 45.1% |
| Interest Coverage | 3.0x | 4.1x | 4.6x | 3.9x | 3.3x |
| Asset Turnover | 0.16 | 0.18 | 0.19 | 0.19 | 0.18 |
| Fixed Asset Turnover | — | — | — | — | — |
| Dividend Yield | 1.8% | 3.0% | 4.2% | 3.8% | 4.4% |
Evolution of Financial Ratios
Return on Equity (ROE) declined from 10.58% in 2022 to 7.89% in 2025, signaling weakening shareholder returns. The Current Ratio fell sharply, reaching zero in 2025, indicating deteriorating liquidity. Debt-to-Equity rose to 0.95 in 2025 from 0.74 in 2023, reflecting slightly increased leverage. Profit margins showed a downward trend, with net margin dropping from 31.56% in 2022 to 20.23% in 2025.
Are the Financial Ratios Favorable?
In 2025, profitability is mixed: net margin (20.23%) and ROIC (1017.71%) are favorable, while ROE (7.89%) and asset turnover (0.18) are unfavorable. Liquidity ratios (current and quick) are zero, a significant red flag. Leverage ratios are neutral, with debt-to-equity at 0.95 and interest coverage at 3.76. Market multiples show a high P/E ratio (36.36), deemed unfavorable, while dividend yield (4.36%) is favorable. Overall, ratios lean slightly unfavorable.
Shareholder Return Policy
Mid-America Apartment Communities, Inc. pays a dividend with a payout ratio above 100%, indicating distributions exceed net income. The dividend per share has steadily increased to $6.06 in 2025, supporting a 4.36% annual yield.
The company also engages in share buybacks, but the high payout ratio signals potential risk to sustainability. Covering dividends and buybacks fully with free cash flow remains uncertain, posing caution for long-term shareholder value stability.
Score analysis
The following radar chart displays Mid-America Apartment Communities, Inc.’s key financial metric scores for 2026:
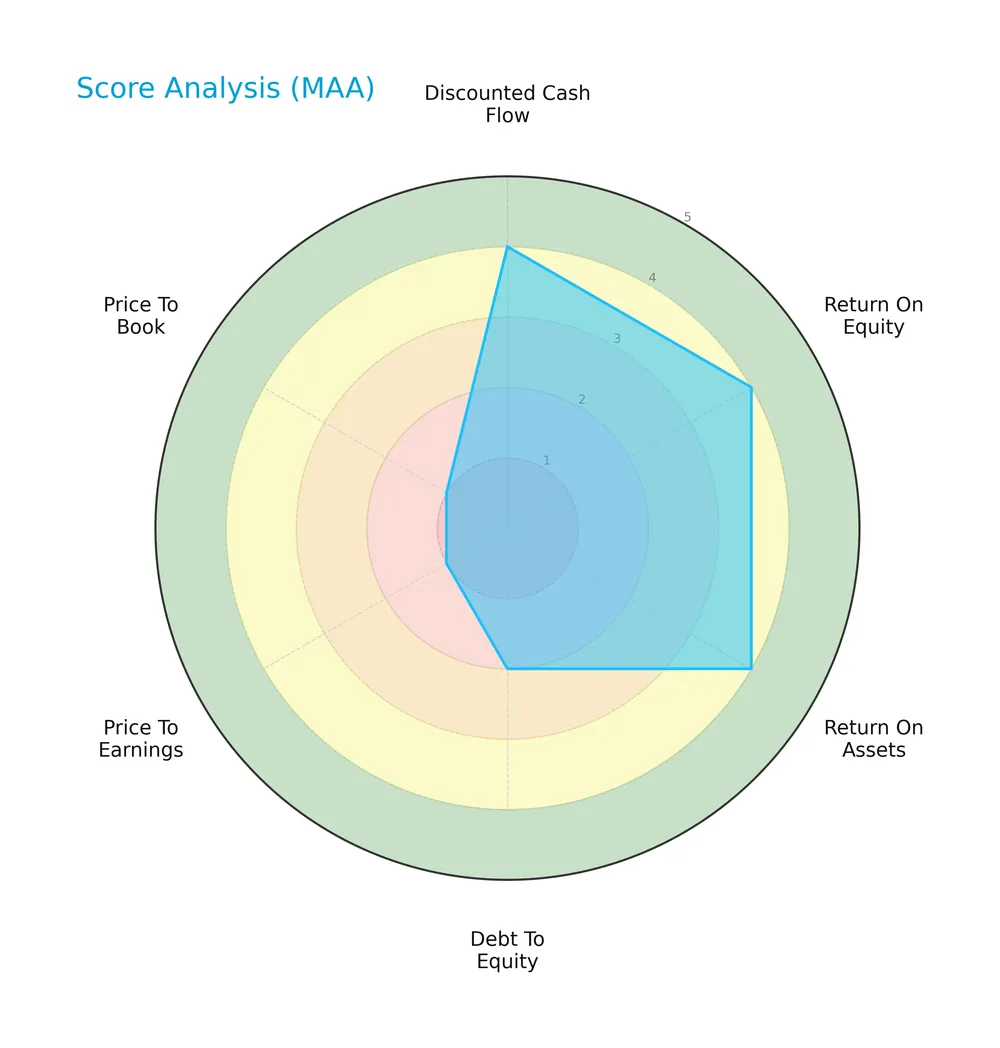
The company shows strong scores in discounted cash flow, return on equity, and return on assets, signaling solid profitability. However, debt-to-equity is weak, and valuation metrics (P/E and P/B) are very unfavorable, reflecting potential market concerns.
Analysis of the company’s bankruptcy risk
Mid-America Apartment Communities, Inc. currently resides in the distress zone according to its Altman Z-Score, indicating a higher risk of financial distress:

Is the company in good financial health?
The Piotroski Score chart highlights the company’s financial condition as of 2026:

With a Piotroski Score of 5, the company exhibits average financial health, suggesting moderate strength but room for improvement in profitability, leverage, or efficiency factors.
Competitive Landscape & Sector Positioning
This section analyzes Mid-America Apartment Communities, Inc.’s strategic positioning, revenue segments, key products, and main competitors. It explores the company’s competitive advantages within the residential REIT sector. I will assess whether MAA holds a sustainable advantage over its peers.
Strategic Positioning
Mid-America Apartment Communities, Inc. concentrates on residential REITs, owning 102,772 apartment units across 16 states and D.C. Its revenue heavily relies on same-store properties, reflecting a focused portfolio within Southeast, Southwest, and Mid-Atlantic U.S. regions.
Revenue by Segment
This pie chart illustrates Mid-America Apartment Communities, Inc.’s revenue distribution by segment for fiscal year 2024, showing contributions from Same Store and Non Same Store And Other categories.
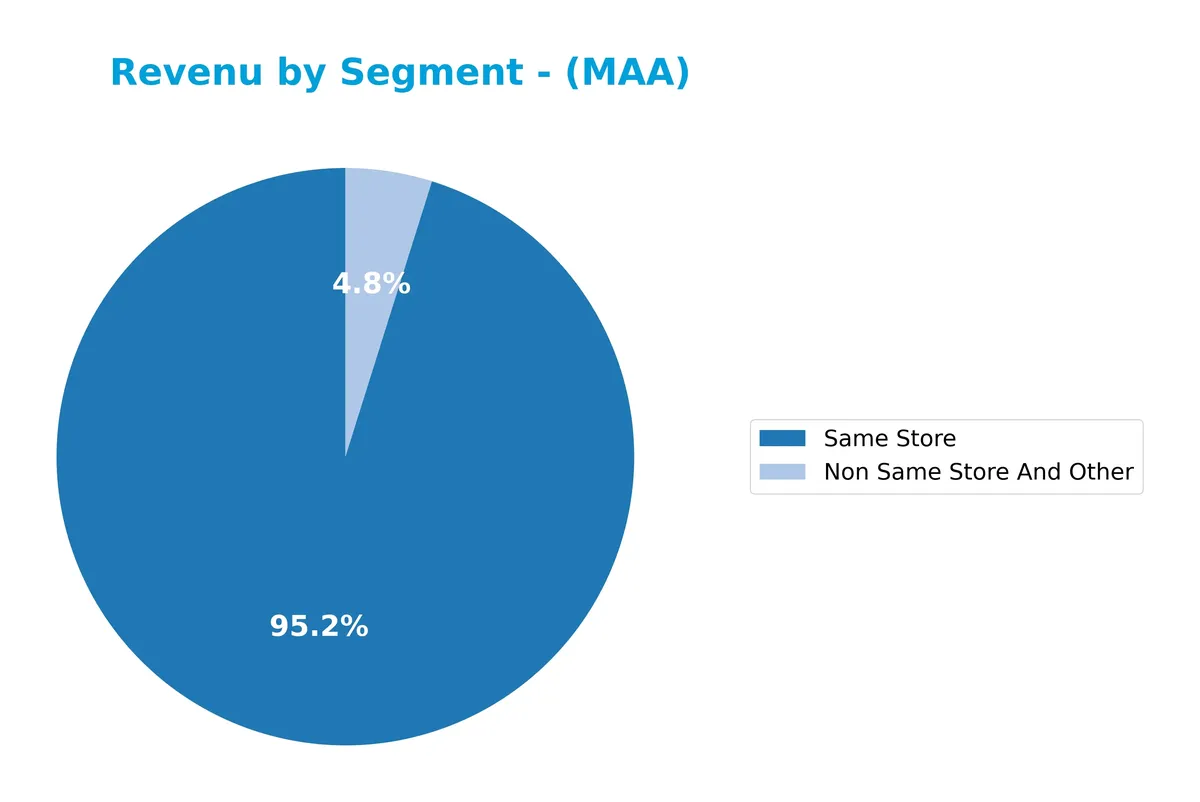
In 2024, Same Store revenue dominates at 2.08B, reflecting steady organic growth and operational consistency. Non Same Store And Other, at 106M, plays a smaller yet stable role, indicating limited contribution from newer or ancillary properties. The trend shows a clear concentration in Same Store revenue, highlighting the company’s reliance on its core portfolio’s performance without significant recent expansion impacts.
Key Products & Brands
The following table summarizes Mid-America Apartment Communities, Inc.’s principal revenue segments and their descriptions:
| Product | Description |
|---|---|
| Same Store | Revenue from apartment communities owned and operated continuously, reflecting organic growth. |
| Non Same Store And Other | Revenue from recently acquired, developed, or redeveloped properties not included in same-store. |
Mid-America Apartment Communities generates most revenue from stable, same-store apartment operations. The non-same-store segment captures growth from acquisitions and development projects, highlighting its expansion strategy across multiple U.S. regions.
Main Competitors
There are 7 competitors in the Real Estate sector, with the table showing the top 7 leaders by market capitalization:
| Competitor | Market Cap. |
|---|---|
| AvalonBay Communities, Inc. | 25.6B |
| Equity Residential | 23.6B |
| Invitation Homes Inc. | 17.0B |
| Essex Property Trust, Inc. | 16.5B |
| Mid-America Apartment Communities, Inc. | 16.3B |
| UDR, Inc. | 12.1B |
| Camden Property Trust | 11.7B |
Mid-America Apartment Communities ranks 5th among its 7 peers. Its market cap stands at 60% of the sector leader AvalonBay Communities. The company is below both the average market cap of the top 10 (17.6B) and the median sector market cap (16.5B). It holds a 6.95% gap above its nearest competitor, Essex Property Trust, indicating a modest cushion in scale.
Comparisons with competitors
Check out how we compare the company to its competitors:
Does MAA have a competitive advantage?
Mid-America Apartment Communities, Inc. presents a clear competitive advantage, supported by a very favorable moat rating. Its ROIC exceeds WACC by a wide margin, indicating efficient capital use and consistent value creation.
Looking ahead, MAA’s focus on quality apartment communities across 16 states offers growth opportunities through development and redevelopment projects. This geographic diversification supports potential expansion in key U.S. regions.
SWOT Analysis
This SWOT analysis highlights Mid-America Apartment Communities, Inc.’s core competitive position and strategic risks.
Strengths
- strong moat with ROIC well above WACC
- attractive dividend yield of 4.36%
- diversified portfolio across 16 states
Weaknesses
- declining net income and EPS over 5 years
- unfavorable revenue and margin growth recently
- weak liquidity ratios (current and quick ratio at 0)
Opportunities
- expansion in growing Southeast and Southwest markets
- potential redevelopment projects to increase asset value
- rising demand for quality apartments amid housing shortages
Threats
- rising interest rates increasing debt costs
- high valuation multiples (PE 36.36)
- economic downturn impacting rental income
Mid-America’s moat and dividend appeal underpin its strength, but deteriorating profitability and liquidity raise concerns. The company should focus on operational efficiency and cautious capital allocation to mitigate interest rate risks while capitalizing on regional growth opportunities.
Stock Price Action Analysis
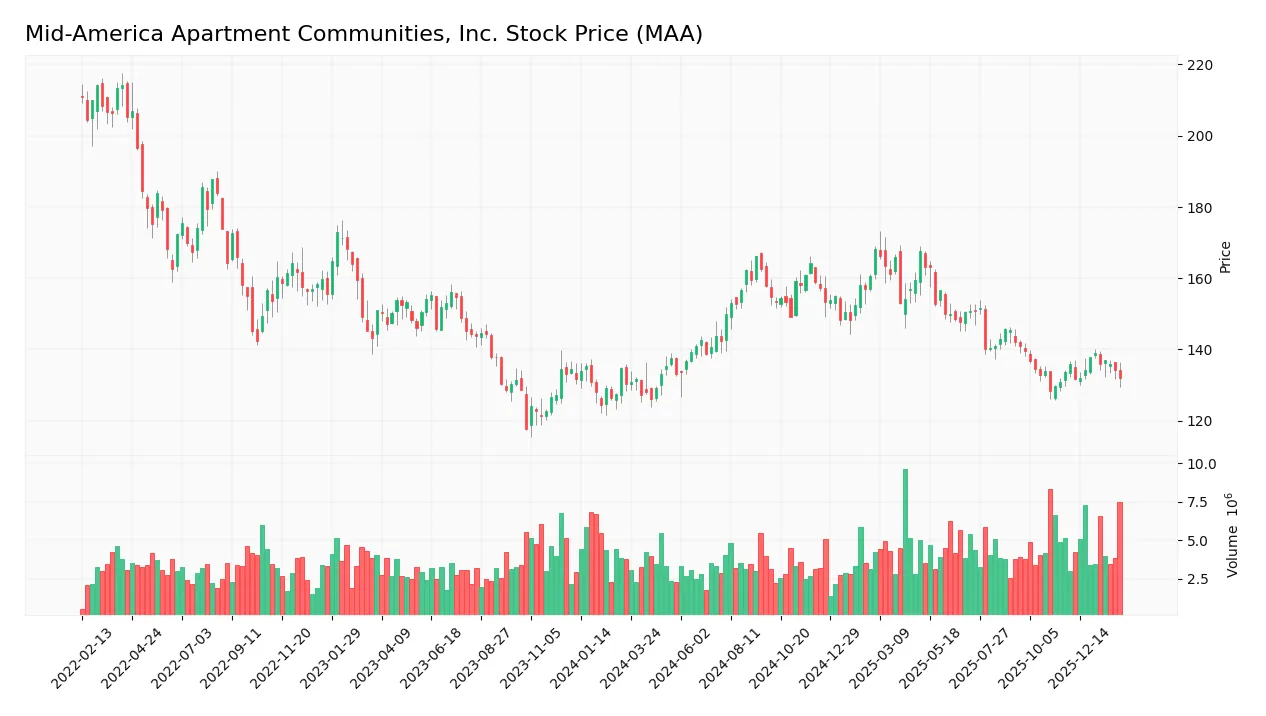
The weekly stock chart below illustrates Mid-America Apartment Communities, Inc.’s price movements over the past 12 months, highlighting key highs and lows:
Trend Analysis
Over the past 12 months, MAA’s stock price rose 1.37%, indicating a bullish trend. The price shows acceleration with a notable high of 168.12 and a low of 126.08. The standard deviation of 11.52 suggests moderate volatility. Recent months reveal a mild downward trend of -1.11%, with a low volatility standard deviation of 2.28.
Volume Analysis
Trading volume has increased recently, totaling 489M shares over the year, with buyers accounting for 53.38%. Over the last three months, buyer dominance rose to 55.03%, signaling slightly buyer-driven activity. This suggests improving investor interest and steady market participation in MAA shares.
Target Prices
Analysts set a firm target consensus for Mid-America Apartment Communities, Inc.
| Target Low | Target High | Consensus |
|---|---|---|
| 134 | 158 | 143.38 |
The target range reflects moderate upside potential, suggesting confidence in steady growth within the multifamily housing sector.

Don’t Let Luck Decide Your Entry Point
Optimize your entry points with our advanced ProRealTime indicators. You’ll get efficient buy signals with precise price targets for maximum performance. Start outperforming now!
Analyst & Consumer Opinions
I will analyze recent analyst grades and consumer feedback related to Mid-America Apartment Communities, Inc. (MAA).
Stock Grades
Here are the recent verified stock grades for Mid-America Apartment Communities, Inc. from leading analysts:
| Grading Company | Action | New Grade | Date |
|---|---|---|---|
| RBC Capital | Maintain | Sector Perform | 2026-02-06 |
| Mizuho | Maintain | Outperform | 2026-01-12 |
| BMO Capital | Upgrade | Outperform | 2026-01-09 |
| UBS | Maintain | Neutral | 2026-01-08 |
| Evercore ISI Group | Maintain | In Line | 2025-12-15 |
| BTIG | Maintain | Buy | 2025-12-05 |
| Scotiabank | Downgrade | Sector Perform | 2025-12-05 |
| Barclays | Maintain | Equal Weight | 2025-11-25 |
| Wells Fargo | Maintain | Overweight | 2025-11-25 |
| Mizuho | Maintain | Outperform | 2025-11-24 |
The grades show a stable outlook with multiple firms maintaining positive or neutral ratings. Notably, BMO Capital upgraded to Outperform, while Scotiabank downgraded, signaling mixed but generally favorable sentiment.
Consumer Opinions
Consumers express strong appreciation for Mid-America Apartment Communities, Inc., highlighting its quality living spaces and responsive management.
| Positive Reviews | Negative Reviews |
|---|---|
| Spacious, well-maintained apartments with modern amenities | Occasional delays in maintenance response |
| Friendly and professional leasing staff | Rent increases perceived as steep by some tenants |
| Convenient community locations near key services | Noise issues reported in select properties |
Overall, tenants praise MAA for high-quality apartments and attentive management. However, recurring concerns include maintenance delays and rent hikes, which may impact tenant retention if not addressed promptly.
Risk Analysis
Below is a table summarizing key risks facing Mid-America Apartment Communities, Inc., highlighting their likelihood and potential impact:
| Category | Description | Probability | Impact |
|---|---|---|---|
| Financial Health | Altman Z-Score of 1.69 places MAA in distress zone, signaling bankruptcy risk | Medium | High |
| Valuation | High P/E ratio (36.36) and low price-to-book scores suggest overvaluation | High | Medium |
| Liquidity | Zero current and quick ratios indicate weak short-term liquidity | Medium | High |
| Operational Efficiency | Low asset turnover (0.18) reflects inefficient use of assets | Medium | Medium |
| Debt Levels | Debt-to-equity near 1.0 and 45% debt-to-assets ratio signal moderate leverage | Medium | Medium |
| Market Sensitivity | Beta of 0.78 implies lower volatility but exposure to market cycles | Low | Low |
The most pressing risk is MAA’s financial distress signal from its Altman Z-Score, which demands caution despite favorable ROIC and dividend yield. Its stretched valuation metrics increase vulnerability to market corrections. Liquidity constraints further elevate short-term risk, especially in a rising interest rate environment.
Should You Buy Mid-America Apartment Communities, Inc.?
Mid-America Apartment Communities, Inc. appears to be delivering improving operational efficiency with a durable competitive moat, supported by strong value creation. Despite a challenging leverage profile and mixed valuation metrics, its overall rating suggests a very favorable investment profile.
Strength & Efficiency Pillars
Mid-America Apartment Communities, Inc. exhibits operational strength with a solid net margin of 20.23% and an impressive ROIC of 1017.71%. The weighted average cost of capital (WACC) stands at 6.46%, confirming the company as a clear value creator. Despite a modest return on equity of 7.89%, the company sustains a favorable gross margin of 31.83% and an EBIT margin of 31.5%, underscoring efficient core operations and a sustainable competitive advantage.
Weaknesses and Drawbacks
The Altman Z-Score of 1.69 places the company firmly in the distress zone, signaling a high bankruptcy risk. This solvency concern overshadows other metrics. Additionally, valuation appears stretched with a P/E ratio of 36.36, indicating a premium market price. The current ratio and quick ratio both register at 0, highlighting liquidity challenges. Asset turnover is weak at 0.18, reflecting operational inefficiencies that may pressure future cash flows.
Our Final Verdict about Mid-America Apartment Communities, Inc.
Despite strong operational margins and an extraordinary ROIC, the company’s financial distress reflected by its Altman Z-Score of 1.69 makes its profile highly speculative. The solvency risk outweighs profitability and growth factors, suggesting this stock may be too risky for conservative capital. Investors should exercise extreme caution and monitor credit health before considering exposure.
Disclaimer: This content is for informational purposes only and does not constitute financial, investment, or other professional advice. Investing in financial markets involves a significant risk of loss, and past performance is not indicative of future results.
Additional Resources
- Mid-America Apartment Communities (NYSE:MAA) Price Target Cut to $136.00 by Analysts at Royal Bank Of Canada – MarketBeat (Feb 06, 2026)
- Colliers Securities Downgrades Mid-America Apartment Communities Inc(MAA.US) to Hold Rating, Cuts Target Price to $145 – 富途牛牛 (Feb 06, 2026)
- Mid-America Apartment Communities (MAA) Surpasses Q4 FFO Estimates – Yahoo Finance (Feb 04, 2026)
- RBC Capital Lowers Price Target for MAA to $136, Maintains Secto – GuruFocus (Feb 06, 2026)
- Mid-America Apartment Communities: Fundamentals Set To Improve – Seeking Alpha (Feb 05, 2026)
For more information about Mid-America Apartment Communities, Inc., please visit the official website: maac.com