Home > Analyses > Technology > MicroVision, Inc.
MicroVision, Inc. transforms how machines perceive the world through cutting-edge lidar sensors that enhance automotive safety and enable autonomous driving. Its laser beam scanning technology powers innovative applications in augmented reality, smart home systems, and interactive displays. Renowned for its advanced micro-electrical mechanical systems, MicroVision holds a unique position in the hardware industry. The key question now is whether its current financial footing supports the ambitious growth embedded in its technological edge.

Table of contents
Business Model & Company Overview
MicroVision, Inc., founded in 1993 and headquartered in Redmond, Washington, leads in hardware, equipment & parts with a focus on lidar sensors for automotive safety and autonomous driving. Its ecosystem integrates laser beam scanning technology, micro-electrical mechanical systems, and advanced software to deliver innovative sensing and display solutions. The company also pioneers micro-display designs and interactive modules for augmented reality (AR) and smart home applications.
MicroVision generates revenue by selling its lidar and display technologies primarily to original equipment manufacturers and design firms. Its portfolio balances cutting-edge hardware with proprietary software algorithms, serving markets across the Americas, Europe, and Asia. This blend supports a robust growth trajectory. I see its competitive advantage in the proprietary PicoP scanning technology, which creates vibrant, uniform images from compact modules—strengthening its economic moat and influence in shaping the future of sensing and visualization.
Financial Performance & Fundamental Metrics
I analyze MicroVision, Inc.’s income statement, key financial ratios, and dividend payout policy to assess its profitability, efficiency, and shareholder returns.
Income Statement
The table below summarizes MicroVision, Inc.’s key income statement metrics over the past five fiscal years, highlighting revenue trends and profitability challenges.

| 2021 | 2022 | 2023 | 2024 | 2025 | |
|---|---|---|---|---|---|
| Revenue | 2.5M | 664K | 7.3M | 4.7M | 1.2M |
| Cost of Revenue | 2K | 100K | 2.8M | 7.5M | 18.5M |
| Operating Expenses | 46.4M | 54.5M | 93.4M | 82.7M | 52.0M |
| Gross Profit | 2.5M | 564K | 4.5M | -2.8M | -17.3M |
| EBITDA | -42.9M | -53.1M | -83.1M | -71.0M | -82.8M |
| EBIT | -43.9M | -53.9M | -88.3M | -75.2M | 0 |
| Interest Expense | 0 | 62K | 80K | 4.5M | 18.5M |
| Net Income | -43.2M | -53.1M | -82.8M | -96.9M | -95.0M |
| EPS | -0.27 | -0.32 | -0.45 | -0.46 | -0.35 |
| Filing Date | 2022-03-01 | 2023-03-02 | 2024-02-29 | 2025-03-26 | 2026-03-04 |
Income Statement Evolution
MicroVision’s revenue fell sharply by 74% in 2025 after an overall 52% drop since 2021. Gross profit swung from positive to a severe negative, with margins deteriorating substantially. Operating expenses remained high, eroding any potential gains and pushing net income deeper into loss territory. Margins consistently trended unfavorably, reflecting persistent operational challenges.
Is the Income Statement Favorable?
The 2025 income statement reveals deteriorating fundamentals. Revenue plunged to 1.2M USD, while cost of revenue soared to 18.5M USD, resulting in a gross loss of 17.3M USD. Operating expenses hit 52M USD, and net interest expense added 18.5M USD, culminating in a steep net loss of 95M USD. Despite slight EPS improvement, overall metrics remain unfavorable and bear significant risks.
Financial Ratios
The table below presents key financial ratios for MicroVision, Inc. from 2021 to 2025, illustrating profitability, liquidity, leverage, and efficiency metrics:
| Ratios | 2021 | 2022 | 2023 | 2024 | 2025 |
|---|---|---|---|---|---|
| Net Margin | -17.28% | -79.96% | -11.41% | -20.64% | -78.63% |
| ROE | -38.31% | -59.16% | -86.47% | -198.72% | -170.99% |
| ROIC | -36.86% | -51.11% | -79.74% | -83.73% | -86.57% |
| P/E | -18.63 | -7.35 | -5.87 | -2.83 | -2.38 |
| P/B | 7.14 | 4.35 | 5.08 | 5.63 | 4.07 |
| Current Ratio | 9.58 | 7.96 | 4.23 | 1.79 | 2.69 |
| Quick Ratio | 9.44 | 7.80 | 4.04 | 1.74 | 2.67 |
| D/E | 0.06 | 0.17 | 0.16 | 1.06 | 0.66 |
| Debt-to-Assets | 4.82% | 13.65% | 11.60% | 42.62% | 35.66% |
| Interest Coverage | 0 | -869.19 | -1110.94 | -19.19 | 4.47 |
| Asset Turnover | 0.019 | 0.006 | 0.056 | 0.039 | 0.012 |
| Fixed Asset Turnover | 0.291 | 0.031 | 0.319 | 0.197 | 0.066 |
| Dividend Yield | 0% | 0% | 0% | 0% | 0% |
Evolution of Financial Ratios
From 2021 to 2025, MicroVision’s Return on Equity (ROE) declined sharply, reaching -171% in 2025, indicating worsening profitability. The Current Ratio decreased from 9.58 in 2021 to 2.69 in 2025 but remained above 1, showing moderate liquidity stability. Debt-to-Equity increased initially before stabilizing near 0.66, reflecting cautious leverage management.
Are the Financial Ratios Favorable?
In 2025, profitability ratios, including ROE and net margin, are markedly unfavorable, signaling sustained losses. Liquidity ratios like Current Ratio (2.69) and Quick Ratio (2.67) are favorable, suggesting adequate short-term financial health. Leverage measures are neutral, but efficiency metrics such as asset turnover remain weak. Overall, the majority of key ratios indicate an unfavorable financial position.
Shareholder Return Policy
MicroVision, Inc. does not pay dividends, reflecting its negative net income and ongoing investment phase. The company prioritizes reinvestment over shareholder payouts and does not currently engage in share buybacks, consistent with a high-growth or development-stage strategy.
This approach aligns with long-term value creation if investments improve profitability and cash flow. However, sustained losses and negative free cash flow warrant monitoring, as they pose risks to future shareholder returns without clear paths to profitability.
Score analysis
The following radar chart presents MicroVision, Inc.’s key financial metric scores for a clear visual comparison:

MicroVision’s scores reveal significant weaknesses across critical metrics. Discounted cash flow, return on equity, return on assets, debt to equity, and price to earnings each scored a very unfavorable 1. Price to book is slightly better but still unfavorable at 2, signaling broad financial challenges.
Analysis of the company’s bankruptcy risk
MicroVision’s Altman Z-Score places it deep in the distress zone, indicating a very high bankruptcy risk and financial instability:

Is the company in good financial health?
The Piotroski Score diagram illustrates MicroVision’s very weak financial health status:

With a Piotroski Score of 2, the company exhibits poor fundamentals and weak financial strength, signaling elevated risk for investors focused on financial stability.
Competitive Landscape & Sector Positioning
This section examines MicroVision, Inc.’s strategic positioning within the hardware, equipment, and parts industry. We will analyze its revenue by segment, key products, and main competitors. I will assess whether MicroVision holds a competitive advantage over its peers.
Strategic Positioning
MicroVision, Inc. focuses on a concentrated product portfolio centered on lidar sensors, micro-displays, and scanning technology. Its revenue is primarily generated from license and royalty fees, with limited geographic exposure dominated by Germany and the United States, reflecting a targeted industrial and regional focus.
Revenue by Segment
This pie chart illustrates MicroVision, Inc.’s revenue breakdown by segment for the fiscal year 2025, highlighting Contract, License and Royalty, and Product Revenues.
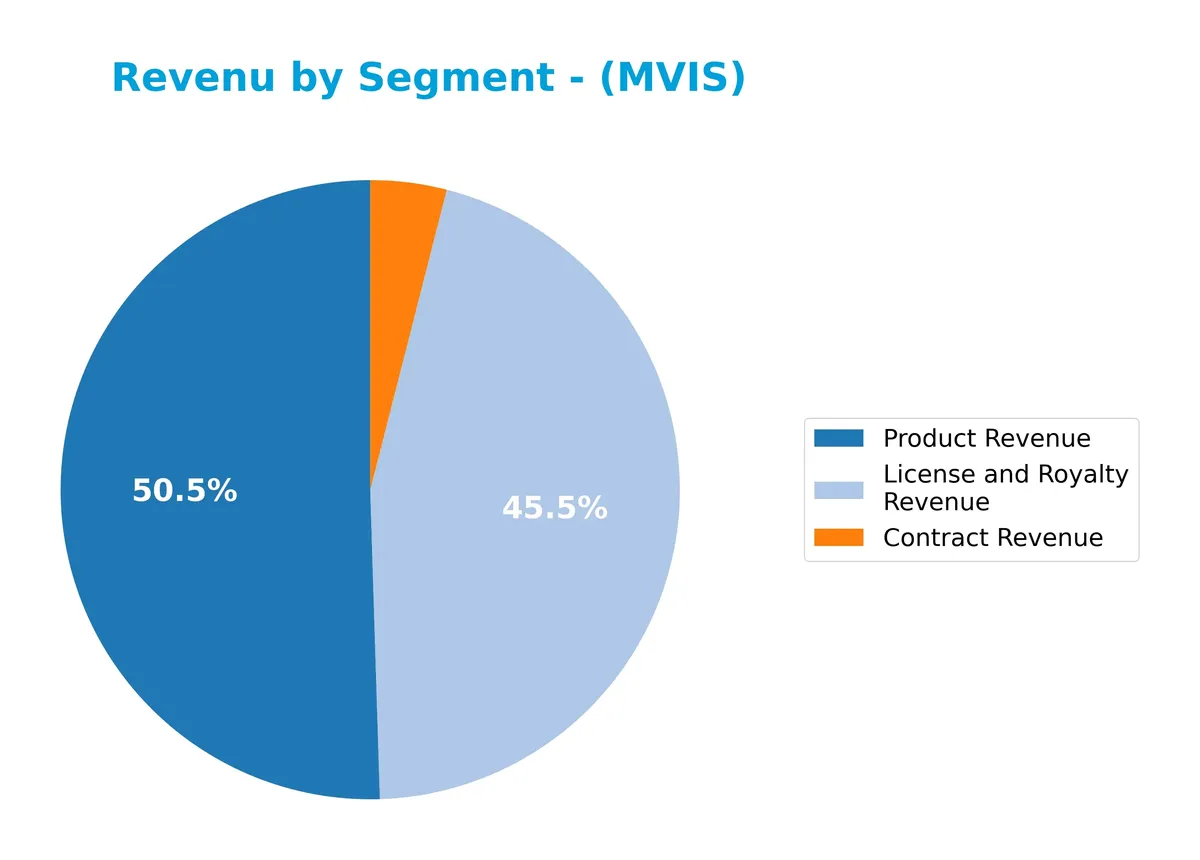
MicroVision’s 2025 revenue centers on License and Royalty at $550K and Product Revenue at $610K, with Contract Revenue trailing at $48K. This marks a shift from 2024, where Product Revenue dominated at $4.1M but sharply declined, signaling concentration risk. License and Royalty revenue shows modest growth, suggesting a more stable, recurring income base as product sales face headwinds.
Key Products & Brands
The table below summarizes MicroVision, Inc.’s key products and brands with their descriptions:
| Product | Description |
|---|---|
| Lidar Sensors | Used in automotive safety and autonomous driving, based on laser beam scanning with MEMS, laser diodes, and software. |
| Micro-Display Concepts | Designs for head-mounted augmented reality (AR) headsets, supporting high-resolution MEMS modules. |
| Interactive Display Modules | Used in smart speakers and other consumer devices to enable interactive visual experiences. |
| Consumer Lidar | Employed in smart home systems to provide sensing capabilities. |
| PicoP Scanning Technology | Creates full-color, high-contrast images from small, thin scanning modules for various display applications. |
| 1st Generation Long Range Lidar | Developed for extended distance sensing applications, enhancing autonomous system capabilities. |
MicroVision’s product portfolio centers on advanced lidar and display technologies, targeting automotive, AR, and smart device markets. Its offerings rely heavily on proprietary MEMS and laser scanning innovations.
Main Competitors
MicroVision, Inc. faces competition from 20 companies in its sector; the table lists the top 10 leaders by market capitalization:
| Competitor | Market Cap. |
|---|---|
| Amphenol Corporation | 171B |
| Corning Incorporated | 77.7B |
| TE Connectivity Ltd. | 68.6B |
| Sandisk Corporation | 40B |
| Garmin Ltd. | 39B |
| Keysight Technologies, Inc. | 35.5B |
| Celestica Inc. | 34B |
| Coherent, Inc. | 28.7B |
| Jabil Inc. | 25.7B |
| Teledyne Technologies Incorporated | 24.4B |
MicroVision ranks 20th among 20 competitors, with a market cap just 0.11% of the leader, Amphenol Corporation. It sits well below both the average market cap of the top 10 (54.4B) and the sector median (21.6B). The company is separated by a significant 140.55% gap from its nearest competitor above, underscoring its relatively small scale in this field.
Comparisons with competitors
Check out how we compare the company to its competitors:
Does MicroVision have a competitive advantage?
MicroVision does not present a competitive advantage as it is shedding value with a very unfavorable moat rating and declining profitability. Its ROIC falls significantly below its WACC, indicating inefficient capital use and value destruction.
Looking ahead, MicroVision targets growth through new lidar sensors for automotive safety and augmented reality headset modules. These product developments offer opportunities to expand its market presence despite current financial challenges.
SWOT Analysis
This SWOT analysis identifies MicroVision, Inc.’s critical internal and external factors shaping its strategic outlook.
Strengths
- advanced lidar sensor technology
- diversified product applications
- strong current and quick ratios
Weaknesses
- severe negative margins
- declining revenue and profitability
- weak asset turnover and returns
Opportunities
- growth in autonomous vehicle market
- AR headset adoption
- expanding smart home tech
Threats
- intense competition in lidar
- technological obsolescence risk
- financial distress signals
MicroVision’s advanced technology and liquidity position offer a foundation for growth. However, persistent losses and shrinking revenues demand urgent strategic realignment. The company must leverage emerging markets while managing competitive and financial risks prudently.
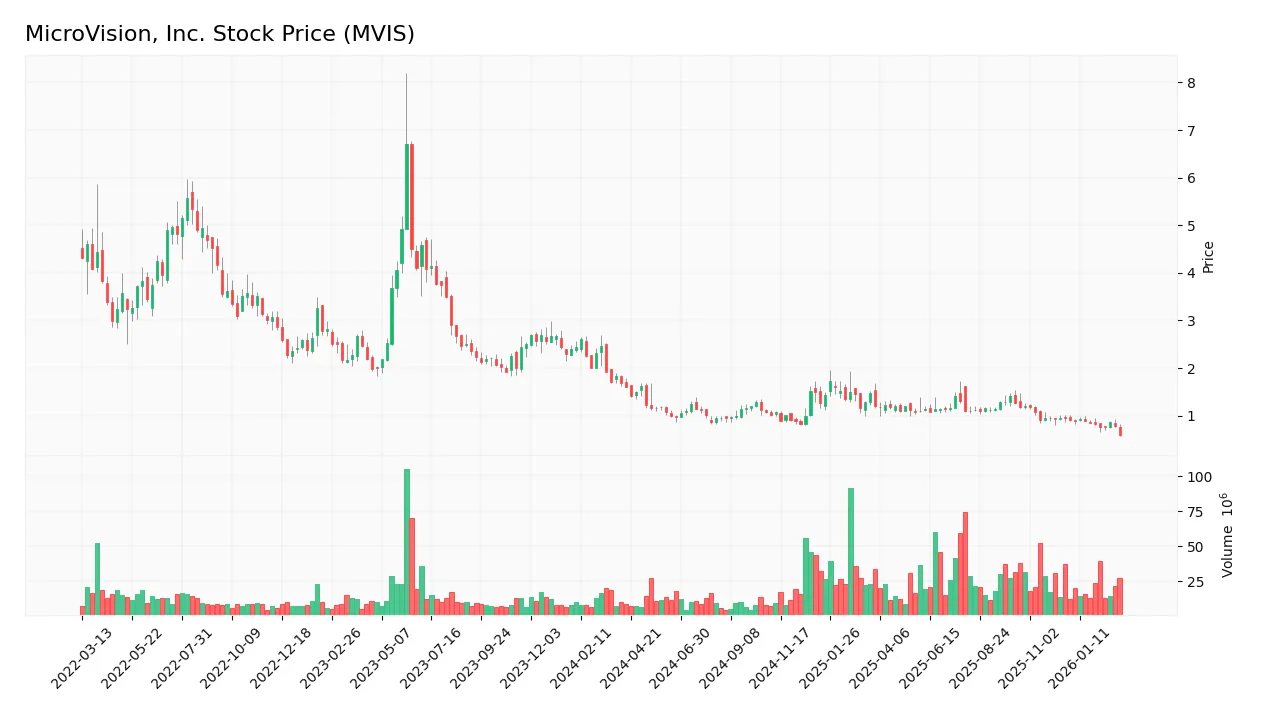
Stock Price Action Analysis
The weekly stock chart illustrates MicroVision, Inc.’s price movement over the past 12 months, highlighting key highs, lows, and volatility patterns:
Trend Analysis
Over the past 12 months, MicroVision’s stock price declined by 63.13%, indicating a clear bearish trend. The price decelerated, showing less downward momentum recently. The highest point reached 1.72, while the lowest was 0.59. Recent months confirm this trend with a 37.33% drop.
Volume Analysis
Trading volume has increased overall, with sellers dominating 58% of the activity. Recent months confirm seller dominance at 88.57%, indicating weak buyer interest. This suggests cautious or negative investor sentiment and heightened market participation from sellers.
Target Prices
Analysts set a clear and focused target consensus for MicroVision, Inc. (MVIS).
| Target Low | Target High | Consensus |
|---|---|---|
| 5 | 5 | 5 |
The uniform target price at $5 indicates a steady expectation among analysts, reflecting moderate confidence in the stock’s near-term valuation.

Don’t Let Luck Decide Your Entry Point
Optimize your entry points with our advanced ProRealTime indicators. You’ll get efficient buy signals with precise price targets for maximum performance. Start outperforming now!
Analyst & Consumer Opinions
This section examines MicroVision, Inc.’s analyst ratings alongside consumer feedback to provide a comprehensive sentiment overview.
Stock Grades
The following table presents recent stock grades for MicroVision, Inc., highlighting key rating changes and maintenance actions:
| Grading Company | Action | New Grade | Date |
|---|---|---|---|
| D. Boral Capital | Downgrade | Hold | 2026-03-05 |
| D. Boral Capital | Maintain | Buy | 2026-01-27 |
| D. Boral Capital | Maintain | Buy | 2025-12-16 |
| D. Boral Capital | Maintain | Buy | 2025-11-12 |
| WestPark Capital | Maintain | Buy | 2025-10-21 |
| WestPark Capital | Maintain | Buy | 2025-09-05 |
| D. Boral Capital | Maintain | Buy | 2025-09-02 |
| WestPark Capital | Maintain | Buy | 2025-08-27 |
| D. Boral Capital | Maintain | Buy | 2025-08-11 |
| D. Boral Capital | Maintain | Buy | 2025-05-21 |
Most recent grades show a shift from consistent Buy ratings to a Hold by D. Boral Capital in March 2026. Overall, the consensus remains positive with five Buy and two Hold ratings, indicating cautious optimism.
Consumer Opinions
Consumers express a mix of optimism and frustration about MicroVision, Inc., reflecting its innovative potential alongside execution challenges.
| Positive Reviews | Negative Reviews |
|---|---|
| “Impressed by the cutting-edge lidar technology.” | “Product delays have been disappointing.” |
| “Strong vision for future automotive applications.” | “Customer support response times are slow.” |
| “Innovative approach to AR and sensing solutions.” | “Stock volatility creates uncertainty for investors.” |
Overall, MicroVision earns praise for its pioneering tech and strategic focus. However, delays and inconsistent support dampen consumer confidence, highlighting execution risks amid promising innovation.
Risk Analysis
Below is a summary of key risks facing MicroVision, Inc., highlighting their likelihood and potential impact:
| Category | Description | Probability | Impact |
|---|---|---|---|
| Financial Health | Company is in financial distress with Altman Z-Score deeply in distress zone. | High | Severe |
| Profitability | Negative net margin (-7863%) signals ongoing losses and poor earnings quality. | High | Severe |
| Liquidity | Current ratio of 2.69 is favorable, but weak interest coverage raises concerns. | Medium | Moderate |
| Market Volatility | Beta of 1.13 implies exposure to market swings beyond the S&P 500 average. | Medium | Moderate |
| Operational Risk | Extremely low asset turnover (0.01) shows inefficiency in using assets to generate sales. | High | High |
| Debt Risk | Debt to assets at 36% is moderate but interest coverage near zero is alarming. | High | High |
| Valuation | Price-to-book at 4.07 is high relative to fundamentals, suggesting overvaluation risk. | Medium | Moderate |
The dominant risks are MicroVision’s fragile financial condition and profitability issues, with a severe bankruptcy risk indicated by its -11.9 Altman Z-Score. The company’s inability to generate sufficient returns on capital and weak operational efficiency compound this risk. Investors should approach cautiously, given these red flags and the stock’s volatile price history.
Should You Buy MicroVision, Inc.?
MicroVision, Inc. appears to be in financial distress with a very weak profitability profile and a deteriorating competitive moat, suggesting persistent value destruction. Despite a manageable debt situation, its overall rating of D+ signals significant caution for investors.
Strength & Efficiency Pillars
MicroVision, Inc. shows no operational profitability as its net margin plunges to -7862.67%, and return on invested capital (ROIC) is deeply negative at -86.57%, well below its weighted average cost of capital (WACC) of 8.01%. The company is neither efficient nor a value creator. These figures reflect severe operational challenges. However, liquidity metrics like a current ratio of 2.69 and quick ratio of 2.67 remain favorable, offering some cushion amid poor profitability.
Weaknesses and Drawbacks
MicroVision is in financial distress, with a crushing Altman Z-Score of -11.92 signaling imminent bankruptcy risk. This overrides all other considerations. The valuation is unfavorable, with a price-to-book ratio of 4.07 indicating a stretched premium despite negative earnings. The interest coverage ratio is essentially zero, underscoring difficulty servicing debt. Seller dominance at 88.57% in recent trading creates additional short-term pressure on the stock price. Overall, leverage and market sentiment pose substantial risks.
Our Final Verdict about MicroVision, Inc.
Despite any operational or liquidity strengths, MicroVision’s severe solvency risk marked by its distress-zone Z-Score makes the investment highly speculative. The company’s deteriorating fundamentals and bearish price trend suggest it remains too risky for conservative capital. Investors might approach cautiously, prioritizing risk management over potential upside at this stage.
Disclaimer: This content is for informational purposes only and does not constitute financial, investment, or other professional advice. Investing in financial markets involves a significant risk of loss, and past performance is not indicative of future results.
Additional Resources
- MicroVision Inc. (MVIS) stock falls on Q4 2025 Earnings – Quiver Quantitative (Mar 04, 2026)
- MicroVision (MVIS) Is Down 5.9% After Steep Q4 Sales Drop And New Convertible Notes Financing – Has The Bull Case Changed? – Yahoo Finance (Mar 05, 2026)
- Microvision Inc (MVIS) Q4 2025 Earnings Call Highlights: Navigat – GuruFocus (Mar 05, 2026)
- MicroVision: Q4 Earnings Snapshot – WKYC (Mar 04, 2026)
- MicroVision (MVIS) Q4 2025 Earnings Transcript – The Globe and Mail (Mar 04, 2026)
For more information about MicroVision, Inc., please visit the official website: microvision.com