Home > Analyses > Technology > Micron Technology, Inc.
Micron Technology, Inc. fundamentally powers the digital world by delivering cutting-edge memory and storage solutions that enable faster, smarter computing across countless devices. As a titan in the semiconductor industry, Micron leads with its DRAM and NAND products, driving innovation from cloud servers to mobile devices under trusted brands like Micron and Crucial. With a robust market presence and relentless focus on quality, the question remains: does Micron’s current valuation fully capture its growth potential amid evolving technology demands?
Table of contents
Business Model & Company Overview
Micron Technology, Inc., founded in 1978 and headquartered in Boise, Idaho, stands as a dominant player in the semiconductor industry. It delivers an integrated ecosystem of memory and storage products, including DRAM, NAND, and NOR semiconductor devices, serving diverse markets from cloud servers to mobile and automotive sectors. Its broad product portfolio is unified under the Micron and Crucial brands, reflecting a cohesive mission to enable high-speed data access and reliable storage solutions worldwide.
The company’s revenue engine balances hardware manufacturing with component-level solutions and recurring sales through direct and channel partners across the Americas, Europe, and Asia. By addressing enterprise, consumer, and industrial storage needs, Micron leverages a versatile global footprint. This competitive advantage strengthens its economic moat, positioning Micron as a key architect shaping the future of memory and storage technologies.
Financial Performance & Fundamental Metrics
This section analyzes Micron Technology, Inc.’s income statement, key financial ratios, and dividend payout policy to assess its overall financial health and stability.
Income Statement
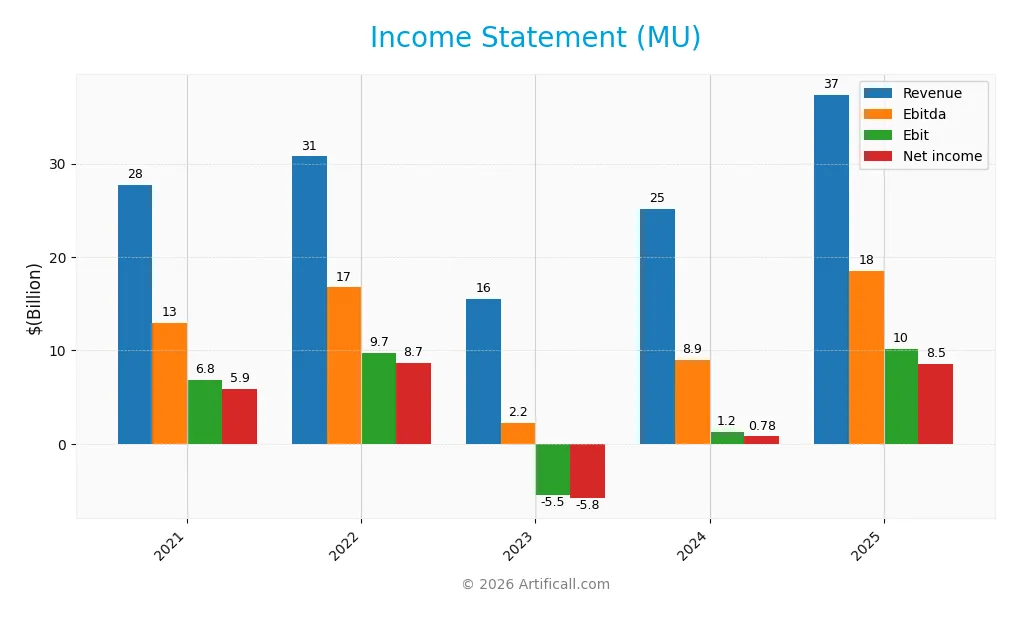
The table below presents Micron Technology, Inc.’s key income statement figures for fiscal years 2021 through 2025, reflecting revenue, expenses, profits, and earnings per share.
| 2021 | 2022 | 2023 | 2024 | 2025 | |
|---|---|---|---|---|---|
| Revenue | 27.7B | 30.8B | 15.5B | 25.1B | 37.4B |
| Cost of Revenue | 17.3B | 16.9B | 17.0B | 19.5B | 22.5B |
| Operating Expenses | 4.2B | 4.2B | 4.3B | 4.3B | 5.0B |
| Gross Profit | 10.4B | 14.0B | -1.4B | 5.6B | 14.9B |
| EBITDA | 12.9B | 16.7B | 2.2B | 8.9B | 18.5B |
| EBIT | 6.8B | 9.7B | -5.5B | 1.2B | 10.1B |
| Interest Expense | 0.2B | 0.2B | 0.4B | 0.6B | 0.5B |
| Net Income | 5.9B | 8.7B | -5.8B | 0.8B | 8.5B |
| EPS | 5.23 | 7.81 | -5.34 | 0.70 | 7.65 |
| Filing Date | 2021-10-08 | 2022-10-07 | 2023-10-06 | 2024-10-04 | 2025-10-03 |
Income Statement Evolution
Between 2021 and 2025, Micron Technology’s revenue grew by 34.9%, with a significant acceleration in the last year showing a 48.9% rise. Net income increased by 45.7% over the period, driven by a sharp 638% jump in net margin most recently. Margins improved steadily, with the gross margin reaching 39.8% and EBIT margin 27.1% in 2025, indicating enhanced profitability and operational efficiency.
Is the Income Statement Favorable?
The 2025 income statement shows strong fundamentals for Micron Technology, with a revenue of 37.4B USD and net income of 8.54B USD, reflecting robust growth and margin expansion. The net margin at 22.8% and EBIT margin at 27.1% are notably favorable. Interest expense remains low at 1.28% of revenue, supporting net profitability. Overall, all key profitability and growth metrics are assessed as favorable, indicating a healthy income statement for the year.
Financial Ratios
The following table presents key financial ratios for Micron Technology, Inc. over the fiscal years 2021 to 2025, providing insight into profitability, leverage, liquidity, and market valuation:
| Ratios | 2021 | 2022 | 2023 | 2024 | 2025 |
|---|---|---|---|---|---|
| Net Margin | 21% | 28% | -38% | 3% | 23% |
| ROE | 13% | 17% | -13% | 2% | 16% |
| ROIC | 11% | 15% | -10% | 1% | 12% |
| P/E | 14.1 | 7.3 | -13.1 | 135.7 | 15.9 |
| P/B | 1.89 | 1.28 | 1.73 | 2.34 | 2.51 |
| Current Ratio | 3.10 | 2.89 | 4.46 | 2.64 | 2.52 |
| Quick Ratio | 2.40 | 2.01 | 2.70 | 1.68 | 1.79 |
| D/E | 0.17 | 0.15 | 0.32 | 0.31 | 0.28 |
| Debt-to-Assets | 12% | 11% | 22% | 20% | 18% |
| Interest Coverage | 34.3 | 51.3 | -14.8 | 2.3 | 20.7 |
| Asset Turnover | 0.47 | 0.46 | 0.24 | 0.36 | 0.45 |
| Fixed Asset Turnover | 0.82 | 0.78 | 0.40 | 0.62 | 0.79 |
| Dividend Yield | 0.00% | 0.72% | 0.66% | 0.49% | 0.38% |
Evolution of Financial Ratios
Between 2022 and 2025, Micron Technology’s Return on Equity (ROE) fluctuated, declining sharply in 2023 before rebounding to 15.76% in 2025, indicating improved profitability. The Current Ratio remained solid, hovering around 2.5 in 2025, reflecting stable liquidity. The Debt-to-Equity ratio showed a modest decrease to 0.28 in 2025, signaling a cautious reduction in leverage over the period.
Are the Financial Ratios Favorable?
In 2025, Micron exhibits generally favorable financial ratios, with strong net margin (22.84%), ROE (15.76%), and debt metrics, including a low debt-to-assets ratio of 18.45%. Liquidity ratios, such as the current ratio (2.52) and quick ratio (1.79), also appear favorable. However, asset turnover ratios and dividend yield are less strong, rated unfavorable, while valuation ratios like P/E (15.94) and P/B (2.51) are neutral, resulting in an overall favorable financial profile.
Shareholder Return Policy
Micron Technology, Inc. has consistently paid dividends over recent years, with a payout ratio around 6% in 2025 and a modest dividend yield near 0.38%. The company’s dividend per share has shown a slight increase, supported by free cash flow coverage and moderate share buyback activities.
This balanced approach, combining dividends with share repurchases, appears aligned with sustainable long-term shareholder value creation. The relatively low payout ratio and coverage metrics mitigate risks of unsustainable distributions or excessive repurchases, supporting financial stability.
Score analysis
The radar chart below presents a comprehensive view of Micron Technology, Inc.’s key financial scores across several important metrics:
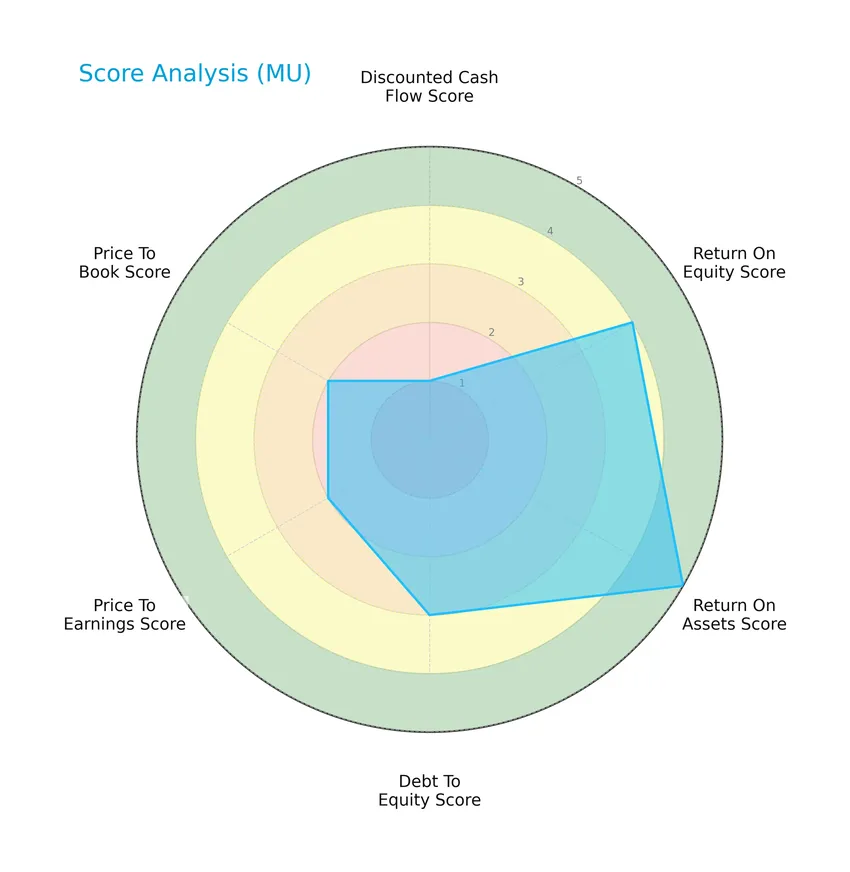
Micron shows a mixed score profile with a very unfavorable discounted cash flow score of 1, balanced by strong return on equity (4) and return on assets (5) scores. Debt to equity and valuation metrics such as price-to-earnings and price-to-book hold moderate scores around 2 to 3.
Analysis of the company’s bankruptcy risk
The Altman Z-Score reflects Micron Technology, Inc.’s low risk of bankruptcy, placing the company well within the safe zone:

Is the company in good financial health?
The Piotroski Score diagram illustrates Micron Technology, Inc.’s solid financial health based on nine fundamental criteria:

With a Piotroski Score of 7 categorized as strong, the company demonstrates good financial strength, indicating effective management of profitability, leverage, and operational efficiency.
Competitive Landscape & Sector Positioning
This sector analysis will examine Micron Technology, Inc.’s strategic positioning, revenue distribution, key products, main competitors, and competitive advantages. I will assess whether Micron holds a competitive edge over its peers in the semiconductor industry.
Strategic Positioning
Micron Technology, Inc. maintains a diversified product portfolio focusing primarily on DRAM ($28.6B) and NAND ($8.5B) memory products, spanning compute, mobile, storage, and embedded segments. Geographically, it generates significant revenue from the United States ($24.1B) and Taiwan ($5.7B), with additional exposure in China, Asia Pacific, Europe, and Japan.
Revenue by Segment
This pie chart illustrates Micron Technology, Inc.’s revenue distribution by product segment for the fiscal year 2025, highlighting the company’s primary sources of income.
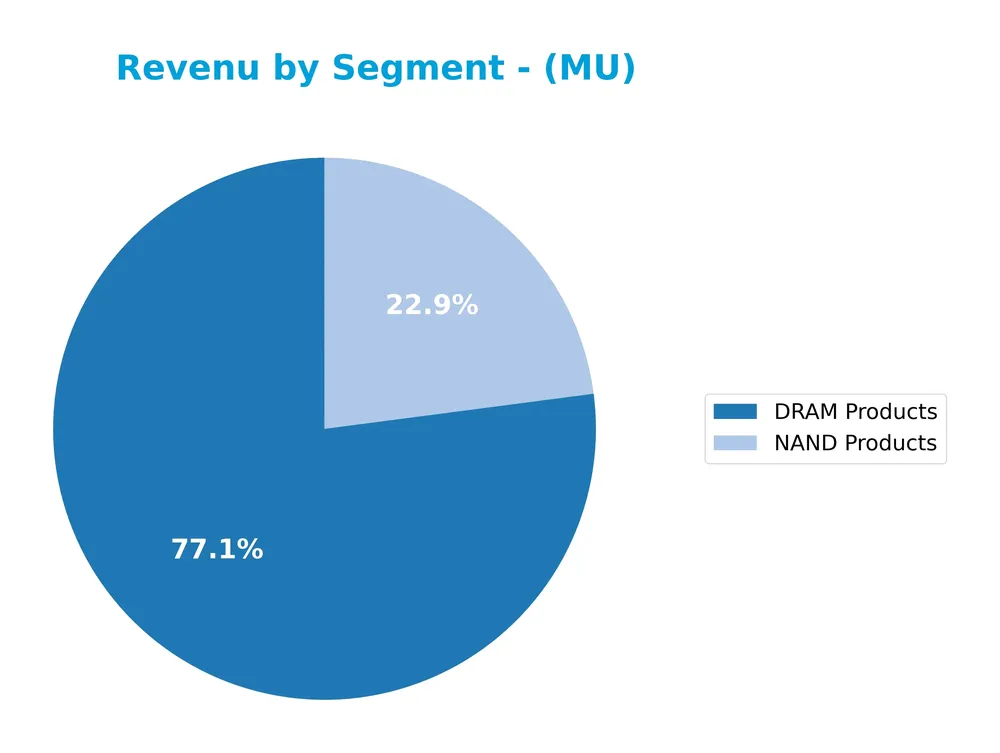
In 2025, Micron’s revenue is predominantly driven by DRAM Products, generating $28.6B, which more than triples the NAND Products segment at $8.5B. This indicates a strong reliance on memory chip sales, particularly DRAM. Compared to prior years, DRAM revenue shows significant growth, signaling an acceleration in demand or pricing power. The concentration in these two segments suggests focused exposure to semiconductor memory markets, which investors should monitor for cyclical risks.
Key Products & Brands
The table below lists Micron Technology, Inc.’s principal products and brands along with concise descriptions:
| Product | Description |
|---|---|
| DRAM Products | Dynamic random access memory semiconductor devices with low latency, providing high-speed data retrieval. |
| NAND Products | Non-volatile, re-writable semiconductor storage devices used in various memory and storage applications. |
| NOR Memory Products | Non-volatile, re-writable semiconductor memory devices offering fast read speeds, marketed under Micron and Crucial brands. |
| Micron Brand | The company’s primary brand for memory and storage products across multiple markets. |
| Crucial Brand | A consumer-focused brand offering memory and storage products. |
| Compute and Networking Business Unit (CNBU) | Segment focused on memory products for cloud servers, enterprise, client, graphics, and networking markets. |
| Mobile Business Unit (MBU) | Segment providing memory products for smartphones and other mobile devices. |
| Storage Business Unit (SBU) | Segment offering SSDs and component-level storage solutions for enterprise, cloud, client, and consumer markets. |
| Embedded Business Unit (EBU) | Segment delivering memory and storage products for automotive, industrial, and consumer markets. |
Micron Technology’s portfolio centers on DRAM and NAND semiconductor products, supplemented by NOR memory, marketed primarily under Micron and Crucial brands. Its business units target diverse markets including cloud computing, mobile devices, storage solutions, and embedded applications.
Main Competitors
There are 38 competitors in the sector, with the table below listing the top 10 leaders by market capitalization:
| Competitor | Market Cap. |
|---|---|
| NVIDIA Corporation | 4.6T |
| Broadcom Inc. | 1.6T |
| Taiwan Semiconductor Manufacturing Company Limited | 1.6T |
| ASML Holding N.V. | 415B |
| Advanced Micro Devices, Inc. | 363B |
| Micron Technology, Inc. | 353B |
| Lam Research Corporation | 232B |
| Applied Materials, Inc. | 214B |
| QUALCOMM Incorporated | 185B |
| Intel Corporation | 173B |
Micron Technology ranks 6th among its 38 competitors, with a market cap approximately 9.78% of the sector leader, NVIDIA. It is positioned below the average market cap of the top 10 competitors (974.8B) but above the median market cap in the semiconductor sector (30.7B). Micron maintains a gap of about 19.37% to the next competitor above, Advanced Micro Devices.
Comparisons with competitors
Check out how we compare the company to its competitors:
Does MU have a competitive advantage?
Micron Technology, Inc. does not currently demonstrate a strong competitive advantage, as its ROIC is below WACC, indicating the company is shedding value. However, its profitability metrics and margins remain favorable, supporting stable operations.
The future outlook appears promising with sustained revenue growth and expanding markets in cloud servers, mobile devices, and automotive sectors. Continued innovation in memory and storage technologies could provide new opportunities to enhance its competitive position.
SWOT Analysis
This SWOT analysis highlights the key internal and external factors that influence Micron Technology, Inc.’s strategic positioning in the semiconductor industry.
Strengths
- Strong revenue growth of 48.85% in 2025
- High net margin at 22.84%
- Favorable ROE of 15.76% and solid liquidity ratios
Weaknesses
- Asset turnover and fixed asset turnover are below industry averages
- Dividend yield is low at 0.38%
- WACC at 10.68% exceeds ROIC, indicating value erosion
Opportunities
- Growing demand for memory products in cloud and mobile markets
- Expansion potential in emerging Asia-Pacific regions
- Increasing ROIC trend signals improving profitability
Threats
- High beta of 1.503 reflects stock volatility
- Intense competition in semiconductors
- Geopolitical risks affecting key markets like China and Taiwan
Micron Technology exhibits robust profitability and growth, supported by strong financial health and market presence. However, challenges in asset efficiency and external risks require cautious strategic management to sustain competitive advantage and shareholder value.
Stock Price Action Analysis
The following weekly chart illustrates Micron Technology, Inc.’s stock price movements over the last 100 weeks, highlighting key highs and lows:

Trend Analysis
Over the past two years, Micron Technology’s stock price increased by 320.02%, indicating a bullish trend with price acceleration. The stock showed significant volatility, with a standard deviation of 64.33, reaching a high of 399.65 and a low of 64.72. Recent months also reflect a strong upward slope of 15.2.
Volume Analysis
Trading volume is increasing overall, with buyers accounting for 59.14% of total volume. In the recent period from November 2025 to January 2026, buyer dominance intensified to 88.98%, suggesting strong buyer-driven activity and robust investor confidence in the stock.
Target Prices
The consensus target prices for Micron Technology, Inc. reflect a cautiously optimistic outlook among analysts.
| Target High | Target Low | Consensus |
|---|---|---|
| 450 | 190 | 342 |
Analysts expect Micron’s stock to trade between $190 and $450, with a consensus target near $342, indicating moderate growth potential balanced by market risks.

Don’t Let Luck Decide Your Entry Point
Optimize your entry points with our advanced ProRealTime indicators. You’ll get efficient buy signals with precise price targets for maximum performance. Start outperforming now!
Analyst & Consumer Opinions
This section reviews recent analyst ratings and summarizes consumer feedback regarding Micron Technology, Inc. (MU).
Stock Grades
Here is the latest overview of Micron Technology, Inc. stock grades from well-established financial firms:
| Grading Company | Action | New Grade | Date |
|---|---|---|---|
| TD Cowen | Maintain | Buy | 2026-01-20 |
| Rosenblatt | Maintain | Buy | 2026-01-20 |
| Stifel | Maintain | Buy | 2026-01-20 |
| Citigroup | Maintain | Buy | 2026-01-15 |
| Wells Fargo | Maintain | Overweight | 2026-01-15 |
| Cantor Fitzgerald | Maintain | Overweight | 2026-01-14 |
| B of A Securities | Maintain | Buy | 2026-01-13 |
| Keybanc | Maintain | Overweight | 2026-01-13 |
| Lynx Global | Maintain | Buy | 2026-01-12 |
| Mizuho | Maintain | Outperform | 2026-01-09 |
The consensus among these firms remains positive, predominantly rating the stock as Buy or Overweight with consistent maintenance of these positions. This indicates sustained confidence in the company’s outlook without recent grade changes.
Consumer Opinions
Micron Technology, Inc. (MU) has garnered a mix of praise and criticism from its consumer base, reflecting diverse experiences with its products and services.
| Positive Reviews | Negative Reviews |
|---|---|
| High-performance memory products that boost system speed significantly. | Occasional delays in product availability and shipping. |
| Competitive pricing compared to other semiconductor manufacturers. | Customer service response times can be slow during peak periods. |
| Reliable and durable hardware suitable for both personal and professional use. | Some users report issues with firmware updates causing temporary malfunctions. |
Overall, consumers appreciate Micron’s powerful and cost-effective memory products, but some express concerns about customer support efficiency and product update reliability.
Risk Analysis
The following table summarizes the key risks associated with investing in Micron Technology, Inc., highlighting their likelihood and potential impact:
| Category | Description | Probability | Impact |
|---|---|---|---|
| Market Volatility | Semiconductor industry cyclicality and price fluctuations affecting revenue and margins. | High | High |
| Technological Risk | Rapid tech evolution requiring continuous innovation to avoid product obsolescence. | Medium | High |
| Supply Chain | Disruptions in raw material supply or manufacturing capacity impacting production timelines. | Medium | Medium |
| Financial Risk | Elevated weighted average cost of capital (WACC) at 10.68%, possibly increasing financing costs. | Medium | Medium |
| Competitive Risk | Intense competition from other semiconductor manufacturers pressuring market share and pricing. | High | Medium |
| Dividend Yield | Low dividend yield (0.38%) limiting income appeal to dividend-focused investors. | Low | Low |
The most significant risks are market volatility and competitive pressures, both highly probable and impactful. Despite Micron’s strong financial health and robust Altman Z-Score (11.8, safe zone), the semiconductor sector’s inherent cyclicality demands cautious position sizing and vigilant monitoring.
Should You Buy Micron Technology, Inc.?
Micron Technology, Inc. appears to be exhibiting improving profitability with strong operational efficiency and a slightly favorable competitive moat marked by growing ROIC. Despite moderate leverage, its debt profile could be seen as manageable, supporting a B overall rating suggesting a very favorable financial health.
Strength & Efficiency Pillars
Micron Technology, Inc. exhibits robust profitability with a net margin of 22.84% and a return on equity (ROE) of 15.76%, indicating efficient capital utilization. Its return on invested capital (ROIC) stands at 12.12%, comfortably exceeding the weighted average cost of capital (WACC) at 10.68%, thereby confirming Micron as a value creator. Financial health metrics are strong, with an Altman Z-score of 11.81 placing the company firmly in the safe zone, and a Piotroski score of 7, reflecting solid financial strength and operational efficiency.
Weaknesses and Drawbacks
Despite its sound fundamentals, Micron faces moderate valuation concerns, with a price-to-earnings (P/E) ratio of 15.94 and price-to-book (P/B) ratio of 2.51 suggesting a fair but cautious market pricing. The company’s asset turnover ratios are unfavorable, with 0.45 for total assets and 0.79 for fixed assets, implying potential inefficiencies in asset utilization. Additionally, the dividend yield is low at 0.38%, which may deter income-focused investors. However, leverage remains modest with a debt-to-equity ratio of 0.28, and liquidity is healthy, supported by a current ratio of 2.52.
Our Verdict about Micron Technology, Inc.
Micron Technology’s long-term fundamental profile is favorable, supported by strong profitability, value creation, and financial stability. Coupled with a bullish overall stock trend and strongly buyer-dominant recent market behavior (88.98% buyer dominance), the profile may appear attractive for long-term exposure. This blend of solid fundamentals and positive market momentum suggests the stock could offer growth potential, though investors should remain mindful of moderate valuation and asset efficiency concerns.
Disclaimer: This content is for informational purposes only and does not constitute financial, investment, or other professional advice. Investing in financial markets involves a significant risk of loss, and past performance is not indicative of future results.
Additional Resources
- Micron Technology: Structural Demand Is Replacing Cyclical Volatility (NASDAQ:MU) – Seeking Alpha (Jan 22, 2026)
- Micron: This Time Is Not Different, It’s Time To ‘Sell’ (Downgrade) (NASDAQ:MU) – Seeking Alpha (Jan 21, 2026)
- Here’s What to Expect From Micron Technology’s Next Earnings Report – Yahoo Finance (Jan 23, 2026)
- Micron: This Party Is Just Getting Started (NASDAQ:MU) – Seeking Alpha (Jan 22, 2026)
- Micron & NVIDIA: The Kings of AI Stocks – Zacks Investment Research (Jan 22, 2026)
For more information about Micron Technology, Inc., please visit the official website: micron.com