Home > Analyses > Consumer Cyclical > MGM Resorts International
MGM Resorts International transforms entertainment and hospitality, crafting experiences that define luxury and excitement worldwide. Its iconic Las Vegas Strip properties and expanding digital gaming platform set industry standards in innovation and customer engagement. The company’s diverse portfolio spans premier casinos, hotels, and convention centers, making it a powerhouse in leisure and business travel. As the gambling sector evolves, I’m keen to assess whether MGM’s fundamentals sustain its premium valuation and growth prospects in this dynamic market.
Table of contents
Business Model & Company Overview
MGM Resorts International, founded in 1986 and headquartered in Las Vegas, NV, dominates the gambling, resorts, and casinos sector. It operates an integrated ecosystem of 29 destination gaming resorts, combining casinos, hotels, entertainment, dining, and convention services. Its portfolio spans iconic Las Vegas Strip properties and regional venues, delivering a comprehensive leisure experience that attracts premium gaming and business travelers alike.
The company generates revenue through a balanced mix of casino gaming, hotel stays, and recurring services like online sports betting via BetMGM. Its strategic footprint covers key markets in the United States and Macau, blending physical resorts with digital platforms. MGM’s competitive advantage lies in its diversified revenue engine and its ability to shape the future of integrated resort entertainment globally.
Financial Performance & Fundamental Metrics
I analyze MGM Resorts International’s income statement, key financial ratios, and dividend payout policy to assess its operational efficiency and shareholder returns.
Income Statement
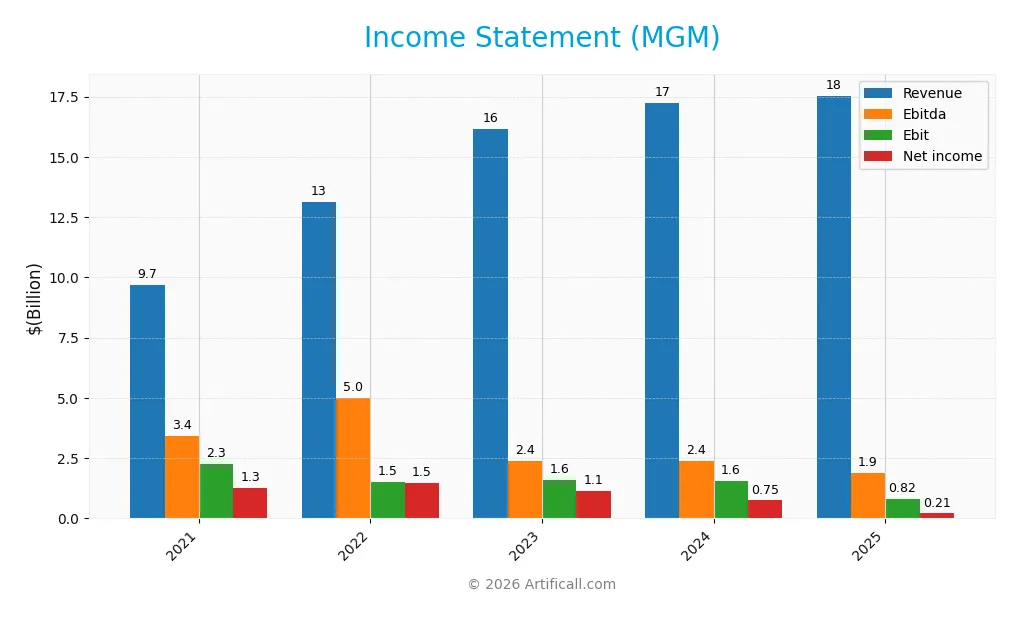
Below is MGM Resorts International’s income statement summary for fiscal years 2021 through 2025, showing core profitability and earnings metrics in USD.
| 2021 | 2022 | 2023 | 2024 | 2025 | |
|---|---|---|---|---|---|
| Revenue | 9.68B | 13.13B | 16.16B | 17.24B | 17.54B |
| Cost of Revenue | 5.03B | 6.65B | 8.55B | 9.39B | 9.75B |
| Operating Expenses | 2.37B | 5.04B | 5.72B | 6.36B | 6.79B |
| Gross Profit | 4.65B | 6.47B | 7.61B | 7.85B | 7.79B |
| EBITDA | 3.41B | 4.98B | 2.40B | 2.39B | 1.87B |
| EBIT | 2.26B | 1.50B | 1.58B | 1.56B | 0.82B |
| Interest Expense | 0.80B | 0.59B | 0.46B | 0.44B | 0.43B |
| Net Income | 1.25B | 1.47B | 1.14B | 0.75B | 0.21B |
| EPS | 2.44 | 0.51 | 3.22 | 2.42 | 0.77 |
| Filing Date | 2022-02-25 | 2023-02-24 | 2024-02-23 | 2025-02-18 | 2026-02-11 |
Income Statement Evolution
MGM’s revenue increased 81% from 2021 to 2025 but slowed to 1.75% growth in 2025 alone. Gross margin remained favorable at 44.4%, yet net margin declined sharply to 1.18%. EBIT margin stayed neutral near 4.7%, reflecting shrinking profitability. Net income fell over 83% across the period, signaling margin compression despite revenue gains.
Is the Income Statement Favorable?
In 2025, MGM reported $17.5B revenue with a $205M net income, yielding a thin 1.18% net margin. EBIT dropped 47% year-over-year to $821M, pressured by rising expenses and interest costs at 2.47% of revenue. While gross margin and interest expense are favorable, significant declines in net margin, EPS, and EBIT growth indicate weak fundamentals and elevated risks.
Financial Ratios
The following table summarizes key financial ratios for MGM Resorts International over the past five fiscal years, providing a snapshot of profitability, liquidity, leverage, and valuation metrics:
| Ratios | 2021 | 2022 | 2023 | 2024 | 2025 |
|---|---|---|---|---|---|
| Net Margin | 13% | 11% | 7% | 4% | 1% |
| ROE | 21% | 30% | 30% | 25% | 8% |
| ROIC | 5% | 1% | 4% | 4% | 3% |
| P/E | 17.2 | 9.3 | 13.9 | 14.3 | 46.9 |
| P/B | 3.56 | 2.84 | 4.16 | 3.52 | 3.98 |
| Current Ratio | 1.86 | 1.81 | 1.57 | 1.30 | 1.23 |
| Quick Ratio | 1.84 | 1.78 | 1.53 | 1.26 | 1.20 |
| D/E | 4.07 | 7.04 | 8.30 | 10.54 | 23.11 |
| Debt-to-Assets | 60% | 74% | 75% | 75% | 136% |
| Interest Coverage | 2.85 | 2.42 | 4.11 | 3.36 | 2.31 |
| Asset Turnover | 0.24 | 0.29 | 0.38 | 0.41 | 0.42 |
| Fixed Asset Turnover | 0.37 | 0.44 | 0.55 | 0.58 | 0.60 |
| Dividend Yield | 0.02% | 0.03% | 0.00% | 0.00% | 0.00% |
Note: Ratios are rounded for clarity. Debt-to-Assets exceeding 100% in 2025 signals a potential accounting anomaly or heavy leverage. Dividend yield is negligible across all years.
Evolution of Financial Ratios
From 2021 to 2025, MGM’s Return on Equity (ROE) declined sharply from 20.7% to 8.5%, reflecting weakening profitability. The Current Ratio steadily decreased from 1.86 to 1.23, signaling reduced short-term liquidity. Meanwhile, the Debt-to-Equity Ratio surged dramatically from 4.07 to 23.11, indicating a sharp rise in leverage and financial risk over the period.
Are the Financial Ratios Fovorable?
In 2025, MGM’s profitability ratios, including net margin (1.18%) and ROE (8.5%), remain unfavorable compared to sector benchmarks. Liquidity is mixed, with a neutral current ratio (1.23) but a favorable quick ratio (1.2). High leverage ratios, such as debt-to-equity at 23.11 and debt-to-assets exceeding 135%, raise concerns. Valuation multiples like P/E (46.9) and P/B (3.98) also appear stretched, resulting in a very unfavorable overall ratio assessment.
Shareholder Return Policy
MGM Resorts International does not pay dividends, reflecting a reinvestment strategy likely prioritizing growth or debt management. The company has not reported share buybacks recently, indicating a focus on capital preservation amid significant leverage.
This approach aligns with sustaining long-term value by avoiding unsustainable payouts while managing heavy debt loads. However, absence of direct returns may concern income-focused investors, making cash flow discipline essential for future shareholder rewards.
Score analysis
The following radar chart presents a comprehensive view of MGM Resorts International’s key financial scores:
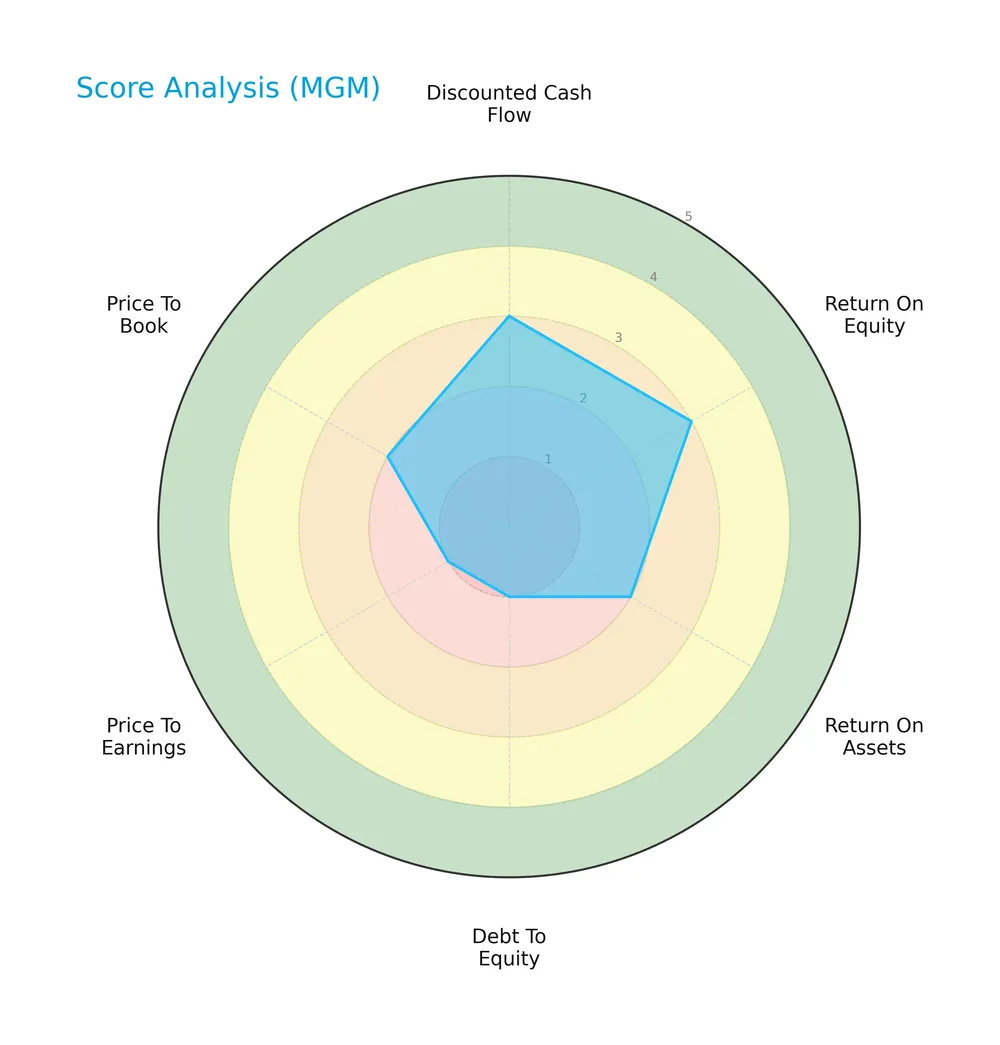
The discounted cash flow and return on equity scores show moderate strength at 3 each. Return on assets and price-to-book scores are unfavorable at 2. Debt-to-equity and price-to-earnings scores are very unfavorable at 1, dragging the overall score to an unfavorable 2.
Analysis of the company’s bankruptcy risk
MGM’s Altman Z-Score places it firmly in the distress zone, signaling a high risk of bankruptcy:

Is the company in good financial health?
The Piotroski Score diagram highlights MGM’s financial health status as average:

With a score of 6, MGM shows moderate financial strength but lacks the robustness associated with strong or very strong health, warranting cautious interpretation.
Competitive Landscape & Sector Positioning
This section analyzes MGM Resorts International’s strategic positioning, revenue segments, and key products within the gambling and resort industry. I will evaluate MGM’s main competitors and assess whether it holds a competitive advantage in this sector.
Strategic Positioning
MGM Resorts International diversifies across casino gaming, hospitality, entertainment, and online sports betting. Its geographic exposure spans the US and Macau, with revenue from Las Vegas Strip, regional operations, and MGM China segments, reflecting a balanced portfolio of physical and digital assets.
Revenue by Segment
This pie chart displays MGM Resorts International’s revenue breakdown by segment for the fiscal year 2024, illustrating key business drivers and their relative scale.
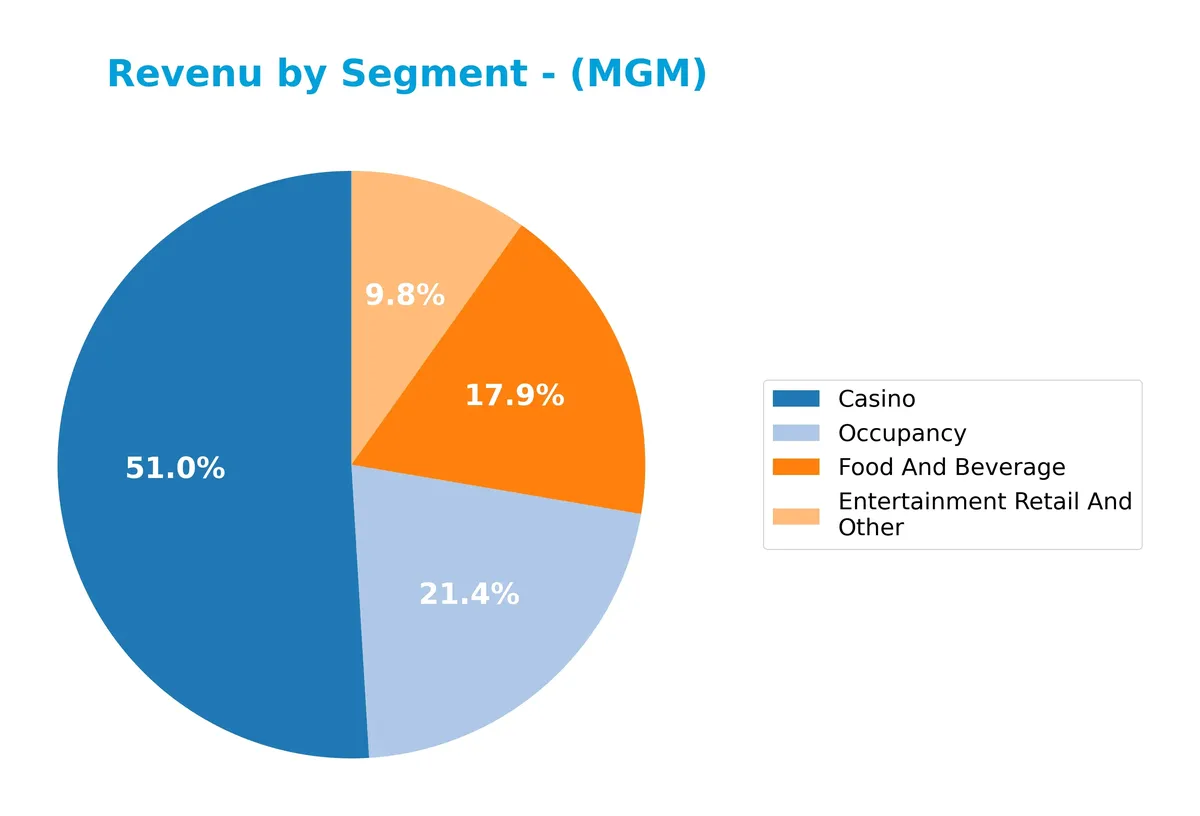
Casino leads revenue with $8.8B, showing steady growth from prior years and dominating the portfolio. Occupancy and Food and Beverage contribute $3.7B and $3.1B respectively, reflecting solid ancillary demand. Entertainment Retail and Other remains the smallest at $1.7B but stable. The 2024 data confirms MGM’s reliance on Casino revenue, highlighting concentration risk amid market cyclicality.
Key Products & Brands
The table below summarizes MGM Resorts International’s key products and brands with brief descriptions:
| Product | Description |
|---|---|
| Casino | Gaming operations including slots, table games, online sports betting, and iGaming via BetMGM. |
| Entertainment Retail And Other | Revenue from entertainment shows, retail outlets, and miscellaneous resort services. |
| Food And Beverage | Dining services across casino resorts, including restaurants, bars, and catering. |
| Occupancy | Hotel room rentals and related lodging services within MGM’s resorts and properties. |
MGM’s portfolio centers on integrated casino resorts, combining gambling, hospitality, dining, and entertainment. The company leverages a diversified revenue base to capture premium and leisure customers at multiple touchpoints.
Main Competitors
There are 3 competitors in the Gambling, Resorts & Casinos industry; here are the top 3 leaders by market capitalization:
| Competitor | Market Cap. |
|---|---|
| Las Vegas Sands Corp. | 44B |
| Wynn Resorts, Limited | 12.7B |
| MGM Resorts International | 10B |
MGM Resorts International ranks 3rd among its competitors. Its market cap is 22.55% of the leader, Las Vegas Sands Corp. MGM sits below both the average market cap of the top 10 (22.3B) and the sector median (12.7B). It trails Wynn Resorts by 28.15%, showing a notable gap with its nearest rival.
Comparisons with competitors
Check out how we compare the company to its competitors:
Does MGM have a competitive advantage?
MGM Resorts International does not present a competitive advantage as it is currently destroying value, with a ROIC significantly below its WACC and a steeply declining profitability trend. The company’s income statement shows an unfavorable overall performance, marked by decreasing net margins and earnings per share over recent years.
Looking ahead, MGM operates a diversified portfolio of casino and resort assets across key markets like Las Vegas and Macau, including online gaming through BetMGM. These assets offer opportunities for growth through expanding entertainment offerings and digital betting platforms, though profitability challenges remain significant.
SWOT Analysis
This SWOT analysis highlights MGM Resorts International’s core internal capabilities and external market factors affecting its strategic position.
Strengths
- strong brand in gaming and resorts
- diversified segment exposure (Las Vegas, regional, China)
- stable gross margin at 44%
Weaknesses
- declining ROIC below WACC, destroying value
- weak profitability metrics (net margin 1.18%)
- high leverage and debt-to-assets over 130%
Opportunities
- growth in online sports betting and iGaming
- expanding premium customer base
- potential Macau market recovery post-pandemic
Threats
- intense competition in gaming sector
- regulatory risks in US and China
- economic downturns impacting leisure spending
MGM faces serious profitability and financial health challenges despite its strong brand and diversified footprint. Strategic focus must prioritize deleveraging and operational efficiency to stabilize returns and capitalize on digital gaming growth.
Stock Price Action Analysis
The weekly stock chart for MGM Resorts International over the past 12 months shows notable fluctuations and a general direction in price movement:
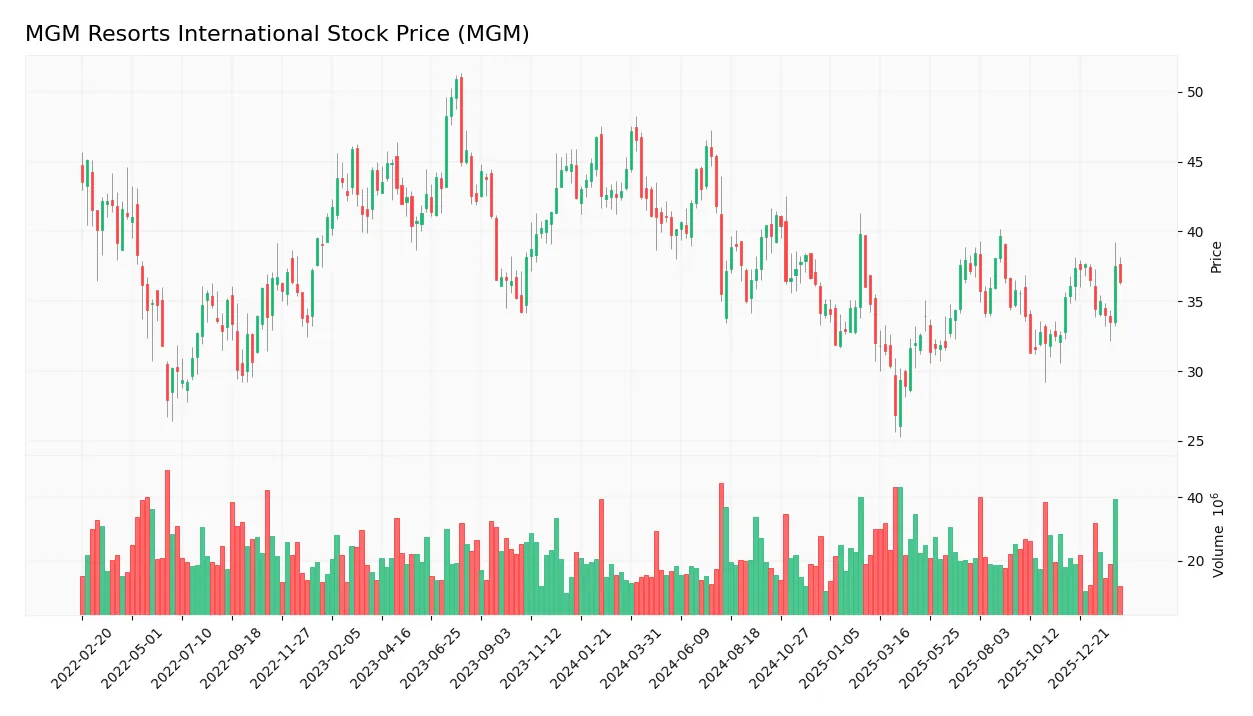
Trend Analysis
Over the past 12 months, MGM’s stock price declined by 18.24%, indicating a clear bearish trend. The trend decelerated despite volatility with a standard deviation of 4.09. The stock hit a high of 47.21 and a low of 26.86, reflecting significant price swings.
Volume Analysis
Trading volume over the last three months is increasing, with buyers slightly dominating at 53.91%. This buyer-driven activity suggests cautious optimism, although buyer dominance remains modest, indicating balanced market participation.
Target Prices
Analysts set a clear target consensus for MGM Resorts International, signaling moderate upside potential.
| Target Low | Target High | Consensus |
|---|---|---|
| 33 | 62 | 41.86 |
The target range spans from $33 to $62, with a consensus near $42, reflecting cautious optimism about the company’s recovery and growth prospects.

Don’t Let Luck Decide Your Entry Point
Optimize your entry points with our advanced ProRealTime indicators. You’ll get efficient buy signals with precise price targets for maximum performance. Start outperforming now!
Analyst & Consumer Opinions
This section examines MGM Resorts International’s analyst ratings alongside consumer feedback to provide a balanced performance overview.
Stock Grades
Here are the latest verified grades for MGM Resorts International from established financial institutions:
| Grading Company | Action | New Grade | Date |
|---|---|---|---|
| Citigroup | Maintain | Neutral | 2026-02-09 |
| Truist Securities | Maintain | Hold | 2026-02-06 |
| Macquarie | Maintain | Outperform | 2026-02-06 |
| JP Morgan | Maintain | Neutral | 2026-02-06 |
| Stifel | Maintain | Buy | 2026-02-06 |
| Morgan Stanley | Downgrade | Underweight | 2026-01-16 |
| Truist Securities | Downgrade | Hold | 2026-01-13 |
| Truist Securities | Maintain | Buy | 2026-01-02 |
| Barclays | Downgrade | Equal Weight | 2025-12-17 |
| Citigroup | Downgrade | Neutral | 2025-11-21 |
Grades reveal a cautious stance with multiple downgrades early in 2026. Most firms maintain neutral to hold ratings, while buy recommendations persist but are less frequent.
Consumer Opinions
Consumers express mixed feelings about MGM Resorts International, balancing excitement for its offerings with concerns about service consistency.
| Positive Reviews | Negative Reviews |
|---|---|
| “The casino experience is thrilling and well-maintained.” | “Long wait times at check-in dampen the luxury feel.” |
| “The variety of entertainment options keeps every visit fresh.” | “Some hotel rooms show signs of wear and need upgrades.” |
| “Staff are generally friendly and helpful during peak hours.” | “Food prices are high compared to similar resorts.” |
Overall, guests praise MGM’s dynamic entertainment and atmosphere but repeatedly cite service delays and aging facilities as areas needing improvement. These issues could impact repeat visitation if unaddressed.
Risk Analysis
Below is a detailed table summarizing key risks facing MGM Resorts International:
| Category | Description | Probability | Impact |
|---|---|---|---|
| Financial Health | Altman Z-Score in distress zone signals high bankruptcy risk | High | Severe |
| Leverage | Debt-to-assets at 135.7% indicates excessive financial risk | High | Severe |
| Profitability | Low net margin (1.18%) and ROIC (2.65%) below WACC (3.97%) | High | Moderate |
| Market Valuation | Elevated P/E (46.9) and P/B (3.98) ratios suggest overvaluation | Medium | Moderate |
| Liquidity | Current ratio (1.23) is adequate but not robust | Medium | Moderate |
| Operational Risk | High beta (1.4) shows sensitivity to market volatility | Medium | Moderate |
| Dividend Policy | No dividend yield limits income appeal | Medium | Low |
MGM’s most pressing risks involve its financial distress signals and heavy leverage. The Altman Z-Score well below 1.8 highlights bankruptcy risk, unusual for a sector peer. Excessive debt burdens interest coverage and capital flexibility. Profitability fails to cover cost of capital, undermining value creation. Market volatility and valuation premiums add pressure. Investors must weigh these structural weaknesses against MGM’s operational scale and market position.
Should You Buy MGM Resorts International?
MGM Resorts International appears to be grappling with declining operational efficiency and a very unfavorable moat, as it sheds value amid weakening returns. Despite manageable liquidity, its substantial leverage and a C+ rating suggest a cautious analytical interpretation of its financial health.
Strength & Efficiency Pillars
MGM Resorts International posts a modest net margin of 1.18% and a return on equity of 8.49%, reflecting limited profitability. The return on invested capital (ROIC) stands at 2.65%, trailing its weighted average cost of capital (WACC) of 3.97%, signaling the company is not creating value. Operational efficiency is moderate, with a gross margin of 44.42% and interest expenses contained at 2.47%. However, these figures do not offset its underlying value destruction and eroding return metrics.
Weaknesses and Drawbacks
The company is in financial distress, with an Altman Z-Score of 0.74, well below the 1.8 threshold, indicating a high bankruptcy risk. MGM’s valuation is stretched, with a price-to-earnings ratio of 46.86 and a price-to-book ratio of 3.98, reflecting premium pricing despite weak fundamentals. Its debt-to-equity ratio of 23.11 and debt-to-assets ratio exceeding 135% highlight significant leverage concerns. Interest coverage of 1.9 signals limited capacity to service debt, compounding solvency risks.
Our Final Verdict about MGM Resorts International
Despite some operational resilience, MGM’s financial distress zone status and deteriorating profitability render its investment profile highly speculative. The company faces severe solvency challenges that overshadow any favorable margin or liquidity signals. Investors seeking stability should approach with caution, as the risk of bankruptcy is material and value destruction persists.
Disclaimer: This content is for informational purposes only and does not constitute financial, investment, or other professional advice. Investing in financial markets involves a significant risk of loss, and past performance is not indicative of future results.
Additional Resources
- MGM Resorts International Earns Five-Star Recognition with 2026 Forbes Travel Guide Awards – PR Newswire (Feb 11, 2026)
- MGM Resorts International Updates Earnings Release Date – MGM Resorts Investor Relations (Feb 04, 2026)
- Chris Davis Increases Stake in MGM Resorts International – GuruFocus (Feb 11, 2026)
- Earnings Beat: MGM Resorts International Just Beat Analyst Forecasts, And Analysts Have Been Updating Their Models – Yahoo Finance (Feb 07, 2026)
- Discover Unrivalled Luxury at MGM Resorts with 13 Five-Star Awards in Las Vegas and Macau – Travel And Tour World (Feb 11, 2026)
For more information about MGM Resorts International, please visit the official website: mgmresorts.com