Home > Analyses > Technology > Meta Platforms, Inc.
Meta Platforms transforms how billions connect daily through its flagship apps—Facebook, Instagram, WhatsApp, and Messenger—shaping social interaction worldwide. It leads the internet content industry with relentless innovation in augmented and virtual reality via Reality Labs. Meta’s blend of social media dominance and cutting-edge tech defines its market power. As investors eye its hefty valuation, the key question remains: do Meta’s fundamentals justify its ambitious growth trajectory?

Table of contents
Business Model & Company Overview
Meta Platforms, Inc., founded in 2004 and headquartered in Menlo Park, California, commands a dominant position in the Internet Content & Information sector. Its ecosystem centers on connecting people globally through mobile devices, PCs, virtual reality headsets, and wearables. Meta’s core mission integrates social interaction and immersive experiences via its Family of Apps and Reality Labs segments, fostering seamless communication and engagement across multiple platforms.
Meta’s revenue engine balances high-margin advertising from its Family of Apps—Facebook, Instagram, Messenger, and WhatsApp—with growing investments in augmented and virtual reality hardware and software from Reality Labs. This diversified model fuels growth across the Americas, Europe, and Asia. Meta’s deep integration of social networks and immersive technologies forms a formidable economic moat, positioning it as a key architect of the digital future.
Financial Performance & Fundamental Metrics
I will analyze Meta Platforms, Inc.’s income statement, key financial ratios, and dividend payout policy to assess its underlying financial health and shareholder value approach.
Income Statement
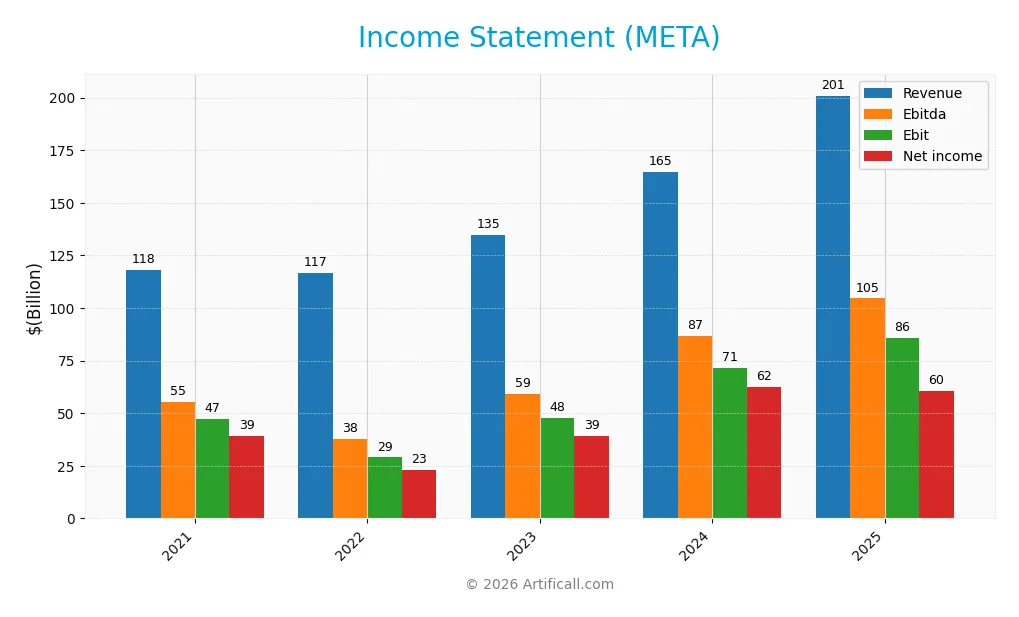
This table presents Meta Platforms, Inc.’s key income statement metrics from 2021 through 2025, highlighting revenue growth and profitability trends.
| 2021 | 2022 | 2023 | 2024 | 2025 | |
|---|---|---|---|---|---|
| Revenue | 118B | 117B | 135B | 165B | 201B |
| Cost of Revenue | 23B | 25B | 26B | 30B | 36B |
| Operating Expenses | 49B | 62B | 62B | 65B | 82B |
| Gross Profit | 95B | 91B | 109B | 134B | 165B |
| EBITDA | 55B | 38B | 59B | 87B | 105B |
| EBIT | 47B | 29B | 48B | 71B | 86B |
| Interest Expense | 23M | 185M | 446M | 715M | 0 |
| Net Income | 39B | 23B | 39B | 62B | 60B |
| EPS | 13.99 | 8.63 | 15.19 | 24.61 | 23.98 |
| Filing Date | 2022-02-03 | 2023-02-02 | 2024-02-01 | 2025-01-30 | 2026-01-29 |
Income Statement Evolution
Meta’s revenue rose sharply by 22.17% from 2024 to 2025, continuing a five-year growth trend of 70.41%. Net income increased by 53.56% over the period but declined 3% year-over-year. Margins remain strong with a stable gross margin of 82% and a favorable EBIT margin near 43%, though net margin contracted slightly in the last year.
Is the Income Statement Favorable?
In 2025, Meta posted $201B revenue and $60.5B net income, reflecting solid fundamentals. Operating expenses grew in line with revenue, pressuring net margin down 20.6% year-over-year to 30.1%. Absence of interest expense supports profitability. Overall, 71% of key income metrics are favorable, indicating a generally healthy income statement with some margin compression risk.
Financial Ratios
The table below presents key financial ratios for Meta Platforms, Inc. over the last five fiscal years, offering a snapshot of profitability, liquidity, leverage, and valuation metrics:
| Ratios | 2021 | 2022 | 2023 | 2024 | 2025 |
|---|---|---|---|---|---|
| Net Margin | 33% | 20% | 29% | 38% | 30% |
| ROE | 32% | 18% | 26% | 34% | 28% |
| ROIC | 27% | 15% | 19% | 25% | 18% |
| P/E | 24.0 | 13.9 | 23.3 | 23.8 | 27.5 |
| P/B | 7.58 | 2.57 | 5.95 | 8.12 | 7.66 |
| Current Ratio | 3.15 | 2.20 | 2.67 | 2.98 | 2.60 |
| Quick Ratio | 3.15 | 2.20 | 2.67 | 2.98 | 2.60 |
| D/E | 0.11 | 0.21 | 0.24 | 0.27 | 0.39 |
| Debt-to-Assets | 8% | 14% | 16% | 18% | 23% |
| Interest Coverage | 2033 | 156 | 104 | 97 | 0 |
| Asset Turnover | 0.71 | 0.63 | 0.59 | 0.60 | 0.55 |
| Fixed Asset Turnover | 1.69 | 1.26 | 1.23 | 1.21 | 1.02 |
| Dividend Yield | 0% | 0% | 0% | 0.34% | 0.32% |
Evolution of Financial Ratios
Meta Platforms’ Return on Equity (ROE) rose from 18.45% in 2022 to 34.14% in 2024 before settling at 27.83% in 2025, showing strong profitability with some moderation. The Current Ratio remained robust, consistently above 2.2, indicating solid liquidity. The Debt-to-Equity Ratio increased from 0.21 in 2022 to 0.39 in 2025, reflecting a moderate rise in leverage.
Are the Financial Ratios Fovorable?
In 2025, Meta’s profitability ratios like net margin (30.08%) and ROE (27.83%) are favorable, outperforming many peers. Liquidity is strong with a current and quick ratio at 2.6. Leverage remains conservative, with a debt-to-equity of 0.39 and debt-to-assets at 22.9%. However, valuation metrics like P/E (27.52) and P/B (7.66) are unfavorable, suggesting the stock trades at a premium. Overall, the ratios lean favorable but warrant caution on valuation and dividend yield.
Shareholder Return Policy
Meta Platforms, Inc. pays a modest dividend, with a payout ratio near 8-9% and a dividend yield around 0.32%. Dividend per share has increased steadily to about $2.11 in 2025, supported by strong free cash flow and conservative capital allocation. The firm’s dividend and capital expenditures remain well covered by operating cash flow, indicating financial prudence.
Additionally, Meta engages in share buybacks, complementing its shareholder returns strategy. This balanced approach—modest dividends plus buybacks—supports sustainable long-term value creation. The low payout ratio and solid cash flow coverage reduce risks of over-distribution or excessive repurchases, aligning with prudent capital management.
Score analysis
The following radar chart illustrates Meta Platforms, Inc.’s key financial scores across valuation, profitability, and leverage metrics:
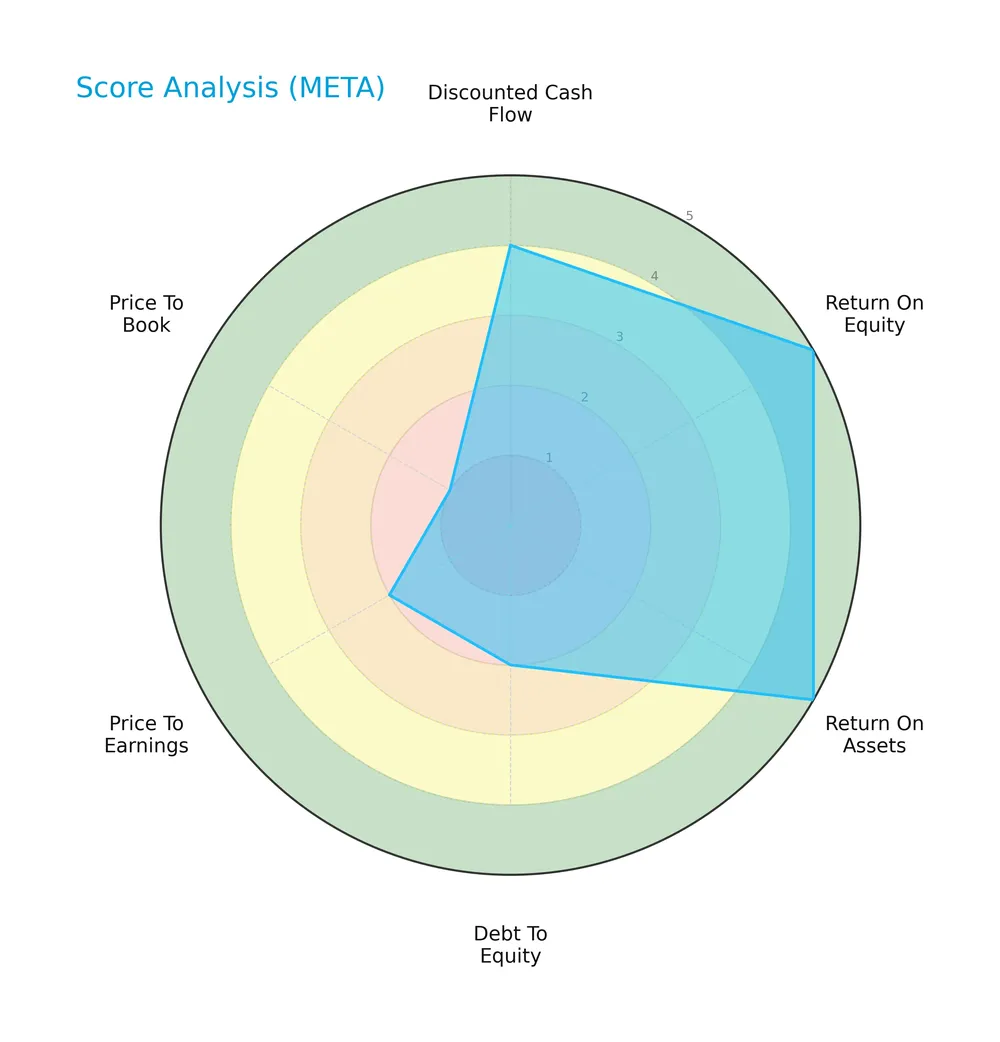
Meta delivers very favorable returns on equity and assets, supported by a favorable discounted cash flow score. However, its debt-to-equity and price-to-earnings scores are moderate, while the price-to-book metric rates very unfavorable, highlighting valuation concerns.
Analysis of the company’s bankruptcy risk
Meta’s Altman Z-Score places it comfortably in the safe zone, indicating a very low risk of bankruptcy:

Is the company in good financial health?
The Piotroski Score diagram summarizes the company’s financial strength and operational efficiency:

With an average Piotroski Score of 6, Meta shows moderate financial health. This score suggests reasonable profitability and stability, but it does not yet reach the threshold for strong financial robustness.
Competitive Landscape & Sector Positioning
This analysis explores Meta Platforms, Inc.’s strategic positioning within the Internet Content & Information industry. We will examine revenue by segment, key products, main competitors, and competitive advantages. I will assess whether Meta holds a durable competitive edge over its industry peers.
Strategic Positioning
Meta Platforms concentrates revenue in its Family of Apps segment, generating $199B in 2025, dwarfing $2.2B from Reality Labs. Geographically, it diversifies across US & Canada ($79B), Asia Pacific ($54B), and Europe ($47B), balancing mature and growth markets globally.
Revenue by Segment
The pie chart displays Meta Platforms’ revenue breakdown by segment for fiscal year 2025, highlighting the contribution of each business area to total sales.

Meta’s revenue is overwhelmingly driven by the Family of Apps segment, which surged to $199B in 2025 from $114B in 2022. Reality Labs remains a small but steady contributor, generating $2.2B in 2025 with modest growth. The data reveals increasing concentration risk as the business depends heavily on its core apps, reflecting a strategic moat but also a vulnerability to shifts in digital advertising trends.
Key Products & Brands
The table below outlines Meta Platforms, Inc.’s key products and brands along with their descriptions:
| Product | Description |
|---|---|
| A social network enabling users to share, discuss, discover, and connect with interests globally via mobile and desktop. | |
| A photo- and video-sharing platform featuring feeds, stories, reels, live videos, private messaging, and e-commerce shops. | |
| Messenger | A cross-platform messaging app supporting text, audio, and video calls for personal and business communication. |
| A private messaging application used by individuals and businesses for communication and transactions worldwide. | |
| Reality Labs | Provides augmented and virtual reality hardware, software, and content to create immersive, connected experiences anytime. |
Meta’s portfolio centers on social connectivity through its Family of Apps segment, driving the bulk of revenue. Reality Labs supports future growth with AR/VR innovations, though it remains a smaller revenue contributor.
Main Competitors
There are 6 competitors in total within the sector, with the table listing the top 6 leaders by market capitalization:
| Competitor | Market Cap. |
|---|---|
| Alphabet Inc. | 3.8T |
| Meta Platforms, Inc. | 1.6T |
| DoorDash, Inc. | 95B |
| Baidu, Inc. | 44B |
| Twilio Inc. | 22B |
| Snap Inc. | 14B |
Meta Platforms ranks 2nd among its competitors. Its market cap is 44% of the leader, Alphabet Inc. Meta stands above both the average market cap of the top 10 competitors (936B) and the median market cap in its sector (70B). The company leads its nearest competitor by a significant 125% margin, highlighting a strong position in the market.
Comparisons with competitors
Check out how we compare the company to its competitors:
Does META have a competitive advantage?
Meta Platforms, Inc. demonstrates a competitive advantage by creating value with an ROIC 8.46% above its WACC. However, its profitability shows a declining trend, signaling caution in sustaining its moat.
Future opportunities lie in expanding its Family of Apps and Reality Labs segments. Continued innovation in virtual reality and global market penetration could support growth despite recent margin pressures.
SWOT Analysis
This analysis identifies key internal and external factors shaping Meta Platforms, Inc.’s strategic positioning.
Strengths
- dominant position in social media
- strong cash flow and profitability
- global user base with diversified revenue streams
Weaknesses
- declining ROIC trend
- high price-to-book ratio
- net margin growth recently negative
Opportunities
- expansion in augmented and virtual reality
- growing international markets, especially Asia Pacific
- monetization of messaging platforms
Threats
- regulatory scrutiny and privacy concerns
- intense competition in digital advertising
- rapid technology changes risking obsolescence
Meta’s core strengths in user engagement and profitability create significant value. However, declining profitability metrics and valuation multiples warrant caution. Strategic focus on innovation and geographic expansion is critical to offset competitive and regulatory risks.
Stock Price Action Analysis
The weekly stock chart below illustrates Meta Platforms, Inc.’s price movements over the past 12 months:

Trend Analysis
Over the past 12 months, META’s stock price increased by 38.44%, indicating a bullish trend with clear acceleration. The stock ranged from a low of 443.29 to a high of 785.23, with high volatility reflected in a 90.93 standard deviation. Recent three-month trend shows a 12.78% gain and steady upward slope.
Volume Analysis
Trading volume over the last three months shows buyer dominance at 62.12%, with buyer volume at 587M compared to seller volume at 358M. Despite a decreasing overall volume trend, active buyer participation suggests sustained investor interest and positive market sentiment toward META.
Target Prices
Analysts set a clear target consensus for Meta Platforms, Inc., reflecting cautious optimism.
| Target Low | Target High | Consensus |
|---|---|---|
| 700 | 1117 | 853 |
The target prices indicate a wide range, but the consensus near 850 suggests moderate upside potential balanced by market uncertainties.

Don’t Let Luck Decide Your Entry Point
Optimize your entry points with our advanced ProRealTime indicators. You’ll get efficient buy signals with precise price targets for maximum performance. Start outperforming now!
Analyst & Consumer Opinions
This section examines analyst ratings and consumer feedback to provide a balanced view of Meta Platforms, Inc.’s market perception.
Stock Grades
Here are the latest verified analyst grades for Meta Platforms, Inc., reflecting recent consensus on the stock’s outlook:
| Grading Company | Action | New Grade | Date |
|---|---|---|---|
| Cantor Fitzgerald | Maintain | Overweight | 2024-09-30 |
| Monness, Crespi, Hardt | Maintain | Buy | 2024-09-30 |
| Rosenblatt | Maintain | Buy | 2024-09-26 |
| Wedbush | Maintain | Outperform | 2024-09-26 |
| JP Morgan | Maintain | Overweight | 2024-09-26 |
| B of A Securities | Maintain | Buy | 2024-09-26 |
| Baird | Maintain | Outperform | 2024-09-26 |
| JMP Securities | Maintain | Market Outperform | 2024-09-26 |
| Citigroup | Maintain | Buy | 2024-09-23 |
| Cantor Fitzgerald | Maintain | Overweight | 2024-09-23 |
The grades consistently reflect a strong buy or outperform stance with no downgrades. This alignment signals steady confidence from major firms, emphasizing Meta’s favorable analyst sentiment.
Consumer Opinions
Meta Platforms, Inc. evokes strong reactions from its user base, reflecting both admiration for innovation and concern over privacy.
| Positive Reviews | Negative Reviews |
|---|---|
| “Meta’s interface is intuitive and user-friendly.” | “Privacy policies feel invasive and unclear.” |
| “Innovative features keep me engaged daily.” | “Frequent algorithm changes disrupt content flow.” |
| “Excellent integration across devices and apps.” | “Customer service response times are slow.” |
Overall, consumers praise Meta’s seamless user experience and continuous innovation. However, privacy concerns and inconsistent support remain persistent issues.
Risk Analysis
Below is a summary table outlining Meta Platforms, Inc.’s key risks and their likelihood and potential impact:
| Category | Description | Probability | Impact |
|---|---|---|---|
| Valuation Risk | Elevated P/E (27.5) and high P/B (7.66) suggest overpricing. | High | High |
| Market Volatility | Beta of 1.28 indicates above-average share price swings. | Medium | Medium |
| Regulatory Risk | Ongoing scrutiny of data privacy and antitrust regulations. | Medium | High |
| Competitive Risk | Intense competition in social media and AR/VR markets. | Medium | Medium |
| Innovation Risk | Heavy Reality Labs investment may face uncertain returns. | Medium | High |
Meta’s valuation metrics stand out as the most pressing risk, reflecting a premium above tech sector averages. Regulatory challenges and Reality Labs’ capital intensity pose serious impact threats, despite Meta’s strong profitability and liquidity. I advise cautious monitoring of these areas.
Should You Buy Meta Platforms, Inc.?
Meta Platforms appears to be a robust value creator with a slightly favorable moat, reflecting declining but positive profitability. Despite a manageable leverage profile, valuation metrics suggest caution. The company holds a B+ rating, indicating a very favorable but nuanced financial health profile.
Strength & Efficiency Pillars
Meta Platforms, Inc. exhibits robust profitability with a net margin of 30.08% and a return on equity of 27.83%. Its return on invested capital (ROIC) stands at 17.95%, significantly above the weighted average cost of capital (WACC) of 9.49%, confirming Meta as a clear value creator. Financial stability is strong, supported by an Altman Z-Score of 8.82, placing the company firmly in the safe zone. The Piotroski score of 6 indicates average but solid financial health, reinforcing Meta’s capacity to generate shareholder value efficiently.
Weaknesses and Drawbacks
Despite strengths, Meta faces valuation concerns with a high price-to-book ratio of 7.66, flagged as very unfavorable, indicating a premium that may pressure future returns. The price-to-earnings ratio at 27.52 is moderately unfavorable, suggesting the stock trades at a lofty valuation compared to earnings. While leverage metrics are favorable, the dividend yield at 0.32% is weak, pointing to limited income for yield-focused investors. These factors introduce caution amid the company’s otherwise strong fundamentals.
Our Verdict about Meta Platforms, Inc.
Meta’s long-term fundamental profile appears favorable given its profitability, value creation, and financial health. Coupled with a bullish overall stock trend and recent buyer dominance, the profile may appear attractive for long-term exposure. The premium valuation ratios warrant prudence, but the company’s solid earnings power and balance sheet strength suggest it could reward patient investors seeking growth.
Disclaimer: This content is for informational purposes only and does not constitute financial, investment, or other professional advice. Investing in financial markets involves a significant risk of loss, and past performance is not indicative of future results.
Additional Resources
- Meta’s Valuation Needs A Reality Check (NASDAQ:META) – Seeking Alpha (Feb 02, 2026)
- Meta Platforms, Inc. $META Shares Bought by Straight Path Wealth Management – MarketBeat (Feb 05, 2026)
- Why Needham Warns That Meta Platforms Stock Could Be Headed for 10%-15% Downside – Barchart.com (Feb 03, 2026)
- Jim Cramer on Meta: “AI Is Changing the Company’s Fortunes in a Way That Is Just Extraordinary” – Yahoo Finance (Feb 02, 2026)
- Mixed options sentiment in Meta Platforms Inc with shares down 0.49% – TipRanks (Feb 02, 2026)
For more information about Meta Platforms, Inc., please visit the official website: investor.fb.com