Home > Analyses > Technology > Mesa Laboratories, Inc.
Mesa Laboratories, Inc. transforms healthcare and scientific research through precision tools that ensure safety, quality, and innovation across multiple industries. Renowned for its advanced sterilization indicators, biopharmaceutical systems, calibration solutions, and clinical genomics platforms, Mesa leads with cutting-edge technology and reliability. As it navigates evolving markets and technological demands, the key question remains: do Mesa’s solid fundamentals and innovation pipeline still justify its current market valuation and long-term growth prospects?

Table of contents
Business Model & Company Overview
Mesa Laboratories, Inc., founded in 1982 and headquartered in Lakewood, Colorado, stands as a key player in the hardware, equipment, and parts industry. With a workforce of 736 employees, it provides an integrated ecosystem of life sciences tools and quality control products that serve healthcare, pharmaceutical, and research sectors worldwide. Its core mission revolves around advancing sterilization, biopharmaceutical development, calibration, and clinical genomics through innovative technologies.
The company’s revenue engine balances hardware sales with recurring consumables and testing services across the Americas, Europe, and Asia Pacific. Its diversified segments include sterilization indicators, automated protein analysis systems, calibration products, and genetic testing tools, all crucial to safety and accuracy in medical and laboratory environments. Mesa’s competitive advantage lies in its broad global footprint and specialized product lines that create high barriers to entry, shaping the future of quality control and clinical diagnostics.
Financial Performance & Fundamental Metrics
This section analyzes Mesa Laboratories, Inc.’s income statement, key financial ratios, and dividend payout policy to assess its overall financial health and investment potential.
Income Statement
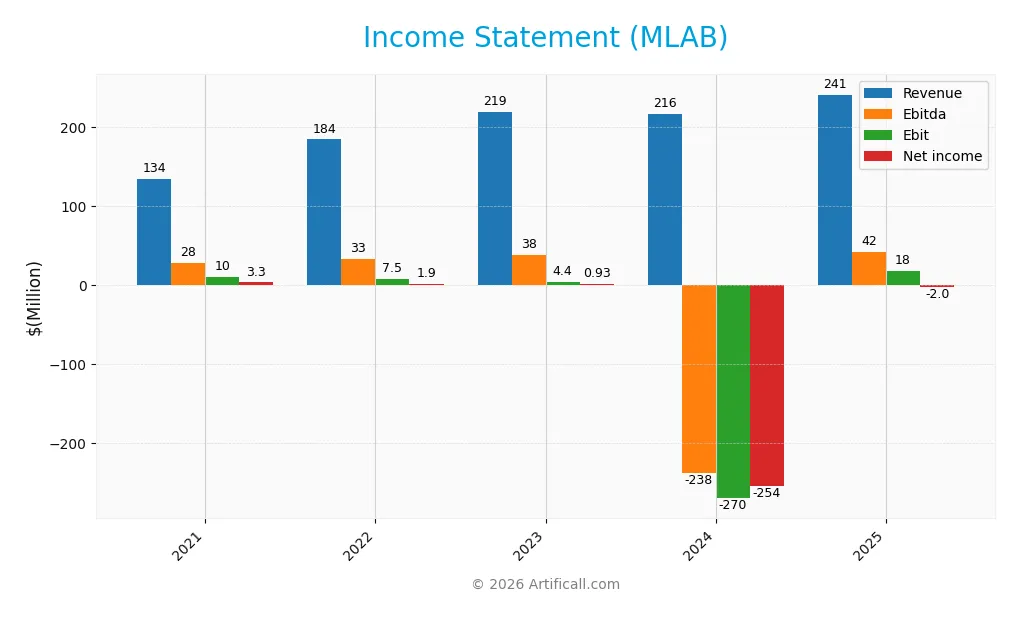
The table below summarizes Mesa Laboratories, Inc.’s key income statement figures for fiscal years 2021 through 2025, reported in USD.
| 2021 | 2022 | 2023 | 2024 | 2025 | |
|---|---|---|---|---|---|
| Revenue | 134M | 184M | 219M | 216M | 241M |
| Cost of Revenue | 47M | 75M | 85M | 83M | 90M |
| Operating Expenses | 75M | 104M | 130M | 405M | 135M |
| Gross Profit | 87M | 109M | 134M | 133M | 151M |
| EBITDA | 28M | 33M | 38M | -238M | 42M |
| EBIT | 10M | 7M | 4M | -270M | 18M |
| Interest Expense | 8M | 4M | 5M | 6M | 12M |
| Net Income | 3M | 2M | 1M | -254M | -2M |
| EPS | 0.66 | 0.36 | 0.17 | -47.2 | -0.36 |
| Filing Date | 2021-06-01 | 2022-05-31 | 2023-05-30 | 2024-06-28 | 2025-05-28 |
Income Statement Evolution
From 2021 to 2025, Mesa Laboratories, Inc. exhibited a favorable revenue growth of 79.92%, with a notable 11.47% increase from 2024 to 2025. Gross profit rose accordingly, maintaining a favorable gross margin of 62.61%. EBIT showed strong improvement, doubling in growth over the last year, while net income trends were unfavorable overall, with a negative net margin of -0.82%, reflecting some instability in profitability.
Is the Income Statement Favorable?
In 2025, Mesa Laboratories reported $241M in revenue with a $15.1M gross profit increase, yielding a solid gross margin. EBIT margin remained neutral at 7.39%, while interest expenses were favorably controlled at 4.92% of revenue. However, net income was negative at -$2M, reflecting an unfavorable net margin despite improvements in EPS and net margin growth. Overall, the fundamentals appear generally favorable, supported by strong revenue and operational efficiency.
Financial Ratios
The table below presents key financial ratios for Mesa Laboratories, Inc. (MLAB) over the fiscal years 2021 to 2025, illustrating profitability, valuation, liquidity, leverage, efficiency, and dividend metrics:
| Ratios | 2021 | 2022 | 2023 | 2024 | 2025 |
|---|---|---|---|---|---|
| Net Margin | 2.44% | 1.01% | 0.42% | -117.60% | -0.82% |
| ROE | 0.81% | 0.48% | 0.24% | -174.87% | -1.24% |
| ROIC | 2.17% | 0.37% | -1.28% | -61.89% | -1.45% |
| P/E | 370 | 710 | 1000 | -2.37 | -326 |
| P/B | 2.98 | 3.37 | 2.36 | 4.15 | 4.03 |
| Current Ratio | 9.32 | 2.59 | 2.74 | 2.47 | 0.63 |
| Quick Ratio | 8.98 | 2.07 | 1.94 | 1.73 | 0.47 |
| D/E | 0.36 | 0.56 | 0.47 | 1.59 | 1.14 |
| Debt-to-Assets | 24.39% | 31.26% | 28.12% | 51.77% | 41.88% |
| Interest Coverage | 1.54 | 1.21 | 0.70 | -47.76 | 1.38 |
| Asset Turnover | 0.22 | 0.26 | 0.33 | 0.48 | 0.56 |
| Fixed Asset Turnover | 6.09 | 6.44 | 7.78 | 5.22 | 7.45 |
| Dividend Yield | 0.26% | 0.25% | 0.37% | 0.57% | 0.54% |
Evolution of Financial Ratios
From 2021 to 2025, Mesa Laboratories, Inc. experienced a decline in Return on Equity (ROE), turning negative in 2025 at -1.24%, indicating reduced profitability. The Current Ratio sharply decreased from 9.32 in 2021 to 0.63 in 2025, reflecting weakened liquidity. The Debt-to-Equity Ratio increased to 1.14 in 2025, signaling rising financial leverage. Overall, profitability deteriorated notably.
Are the Financial Ratios Favorable?
In 2025, key profitability ratios such as net margin (-0.82%) and ROE (-1.24%) were unfavorable, as was the Price-to-Book ratio (4.03) and liquidity ratios including Current (0.63) and Quick (0.47) ratios. Debt-to-assets (41.88%) and asset turnover (0.56) were neutral, while fixed asset turnover (7.45) and weighted average cost of capital (6.64%) were favorable. The overall assessment of financial ratios for 2025 is unfavorable.
Shareholder Return Policy
Mesa Laboratories, Inc. maintains a consistent dividend payment with a yield around 0.5%, despite reporting negative net income in recent fiscal years. The dividend payout ratio is negative, reflecting losses, but dividends are supported by strong free cash flow, which covers distributions and capital expenditures.
The company does not currently engage in share buybacks. While the dividend policy provides some income, the sustainability of distributions amid net losses poses risks. This approach suggests a cautious balance between shareholder return and preserving resources for operational needs.
Score analysis
The following radar chart provides an overview of Mesa Laboratories, Inc.’s key financial scores for investors to consider:
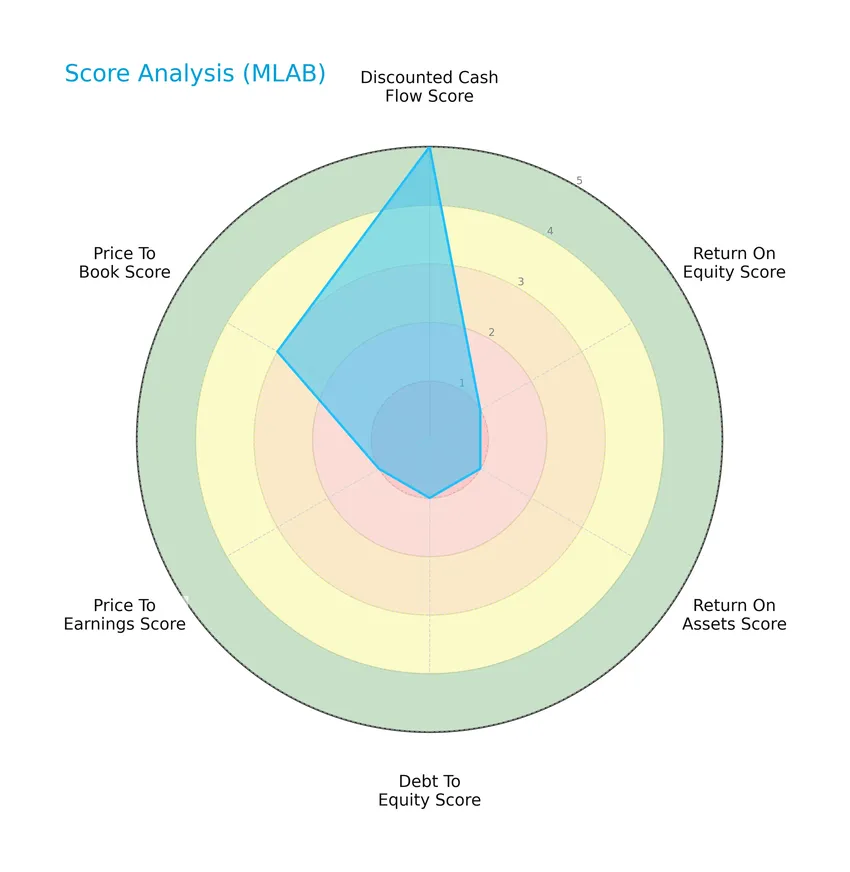
Mesa Laboratories shows a very favorable discounted cash flow score of 5, while profitability and leverage metrics such as return on equity, return on assets, debt to equity, and price to earnings each score very unfavorably at 1. The price to book ratio scores moderately at 3, indicating mixed financial performance.
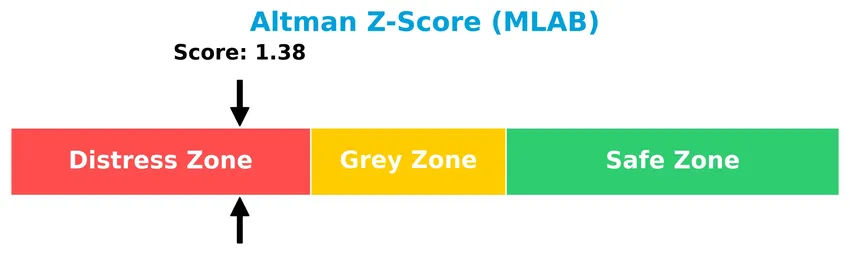
Analysis of the company’s bankruptcy risk
Mesa Laboratories’ Altman Z-Score places it in the distress zone, indicating a high risk of financial distress and potential bankruptcy:
Is the company in good financial health?
This Piotroski diagram illustrates Mesa Laboratories’ financial strength using its Piotroski Score:

With a Piotroski Score of 5, Mesa Laboratories exhibits average financial health, reflecting moderate strength but room for improvement in key financial metrics.
Competitive Landscape & Sector Positioning
This sector analysis will examine Mesa Laboratories, Inc.’s strategic positioning, revenue by segment, key products, main competitors, competitive advantages, and SWOT analysis. I will assess whether Mesa Laboratories holds a competitive advantage over its peers in the hardware, equipment, and parts industry.
Strategic Positioning
Mesa Laboratories, Inc. maintains a diversified product portfolio across Sterilization Control, Biopharmaceutical Development, Calibration Solutions, and Clinical Genomics, generating $198M in product revenue in 2025. Geographically, it balances exposure between the US ($117M) and international markets, including China ($25M) and others ($99M).
Revenue by Segment
The pie chart illustrates Mesa Laboratories, Inc.’s revenue distribution by segment for the fiscal year 2025, highlighting the relative contributions of product and service lines.
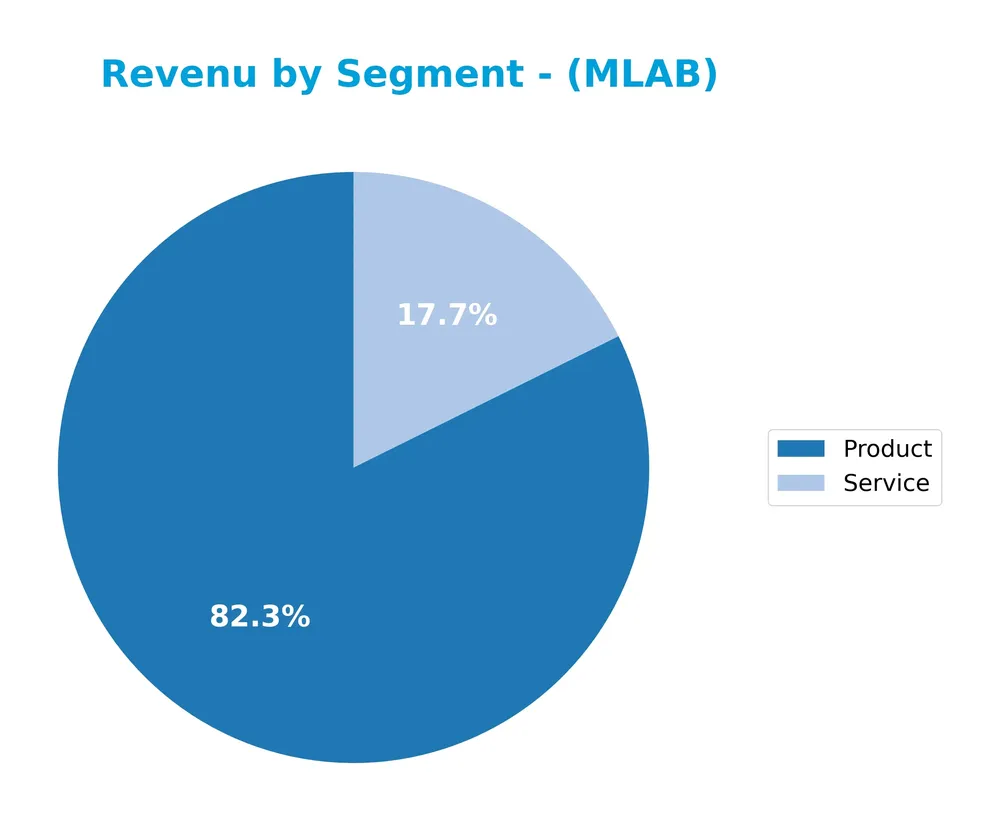
In FY 2025, Mesa Laboratories’ revenue was primarily driven by the Product segment, generating $198M, complemented by Services at $43M. This marks a continuation of strong product sales growth compared to prior years, where product revenue increased from $180M in 2023 and $149M in 2022. The service segment, while smaller, maintains a steady contribution, indicating diversification. Overall, the business shows concentration in product sales with a stable but smaller service revenue, suggesting cautious monitoring of segment dependence is prudent.
Key Products & Brands
The following table outlines Mesa Laboratories, Inc.’s main products and brand categories with their descriptions:
| Product | Description |
|---|---|
| Sterilization and Disinfection Control | Biological, cleaning, and chemical indicators assessing sterilization and disinfection effectiveness in healthcare sectors. |
| Biopharmaceutical Development | Automated systems for protein analysis (immunoassays) and peptide synthesis used in therapies, biomaterials, cosmetics, and research. |
| Calibration Solutions | Quality control and calibration products measuring temperature, pressure, pH, humidity, and other parameters for healthcare environments. |
| Clinical Genomics | Genetic analysis tools including MassARRAY system and consumables for genomic clinical testing in newborn screening, pharmacogenetics, oncology. |
| Product | General category including various life sciences tools and quality control products sold globally. |
| Service | Testing and laboratory services provided mainly to the dental industry. |
Mesa Laboratories’ portfolio spans from quality control indicators and calibration tools to advanced biopharmaceutical and genomic analysis systems, serving broad healthcare and scientific markets globally.
Main Competitors
There are 20 competitors in the sector; below is a table of the top 10 leaders by market capitalization:
| Competitor | Market Cap. |
|---|---|
| Amphenol Corporation | 171B |
| Corning Incorporated | 77.7B |
| TE Connectivity Ltd. | 68.6B |
| Sandisk Corporation | 40.0B |
| Garmin Ltd. | 38.9B |
| Keysight Technologies, Inc. | 35.5B |
| Celestica Inc. | 34.0B |
| Coherent, Inc. | 28.7B |
| Jabil Inc. | 25.7B |
| Teledyne Technologies Incorporated | 24.4B |
Mesa Laboratories, Inc. ranks 19th among 20 competitors with a market cap just 0.27% the size of the leader, Amphenol Corporation. It is positioned below both the average market cap of the top 10 (54.4B) and the sector median (21.6B). The company is notably distant from its next closest competitor above, with a gap of +184.46%, indicating a significant scale difference within the sector.
Comparisons with competitors
Check out how we compare the company to its competitors:
Does MLAB have a competitive advantage?
Mesa Laboratories, Inc. does not currently present a competitive advantage, as it is shedding value with a ROIC significantly below its WACC and a declining profitability trend since 2021. This very unfavorable moat status indicates that the company is destroying value and facing challenges in efficiently using its invested capital.
Looking ahead, MLAB operates across diverse segments including sterilization control, biopharmaceutical development, calibration solutions, and clinical genomics, with revenues growing in the U.S., China, and other international markets. The company’s portfolio of automated protein analysis systems, genetic testing tools, and calibration products may offer opportunities for future growth in life sciences and healthcare industries.
SWOT Analysis
This SWOT analysis highlights Mesa Laboratories, Inc.’s key strategic factors to help investors evaluate its market position and growth potential.
Strengths
- diverse product portfolio across life sciences and calibration
- strong revenue growth of 11.47% in 2025
- favorable gross margin at 62.61%
Weaknesses
- negative net margin at -0.82%
- unfavorable liquidity ratios (current ratio 0.63, quick ratio 0.47)
- declining ROIC indicating value destruction
Opportunities
- expanding biopharmaceutical and clinical genomics markets
- growth potential in international markets, especially China
- innovation in automated protein analysis and peptide synthesis
Threats
- intense competition in medical and calibration equipment
- regulatory risks in healthcare sectors
- financial distress risk indicated by low Altman Z-score
Mesa Laboratories shows solid revenue growth and strong gross margins, but profitability challenges and financial distress risks require cautious monitoring. Strategic focus on innovation and international expansion could improve its outlook, while addressing liquidity and operational efficiency remains critical.
Stock Price Action Analysis
The weekly stock chart for Mesa Laboratories, Inc. (MLAB) highlights price movements and volume dynamics over the past 12 months:
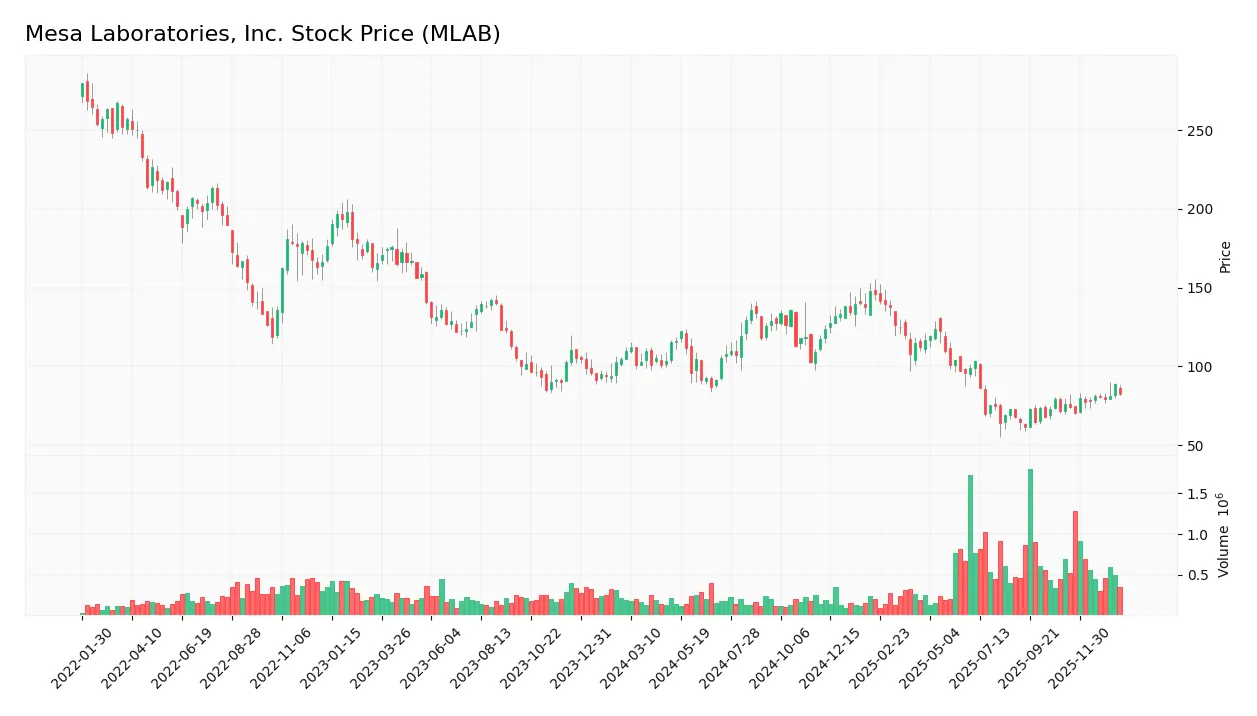
Trend Analysis
Over the past 12 months, MLAB’s stock price declined by 24.46%, indicating a bearish trend with accelerating downward momentum. The stock showed high volatility, with a standard deviation of 23.34, hitting a high of 147.79 and a low of 61.66. However, a recent 8.75% increase since November 2025 suggests a short-term recovery phase.
Volume Analysis
Trading volume over the last three months has been increasing, with a nearly balanced buyer-seller split (buyers 50.76%). This neutral buyer behavior and rising volume imply steady market participation without clear directional conviction among investors.
Target Prices
The consensus target price for Mesa Laboratories, Inc. (MLAB) reflects a clear analyst outlook.
| Target High | Target Low | Consensus |
|---|---|---|
| 83 | 83 | 83 |
Analysts uniformly project a target price of $83, indicating a strong and focused expectation for the stock’s future valuation.

Don’t Let Luck Decide Your Entry Point
Optimize your entry points with our advanced ProRealTime indicators. You’ll get efficient buy signals with precise price targets for maximum performance. Start outperforming now!
Analyst & Consumer Opinions
This section examines recent analyst ratings and consumer feedback regarding Mesa Laboratories, Inc. (MLAB).
Stock Grades
Here is a summary of the recent verified stock grades from recognized analysts for Mesa Laboratories, Inc.:
| Grading Company | Action | New Grade | Date |
|---|---|---|---|
| Wells Fargo | Upgrade | Equal Weight | 2025-08-08 |
| Wells Fargo | Maintain | Equal Weight | 2025-12-15 |
| Wells Fargo | Maintain | Underweight | 2025-05-30 |
| Evercore ISI Group | Maintain | Outperform | 2024-10-01 |
| Evercore ISI Group | Maintain | Outperform | 2024-08-06 |
| Evercore ISI Group | Maintain | Outperform | 2024-07-02 |
| Evercore ISI Group | Maintain | Outperform | 2024-04-04 |
| Evercore ISI Group | Upgrade | Outperform | 2024-01-04 |
| Evercore ISI Group | Downgrade | In Line | 2021-01-04 |
| Evercore ISI Group | Downgrade | In Line | 2021-01-03 |
The grades reveal a generally positive trend from Evercore ISI Group, maintaining an Outperform rating since early 2024 after an upgrade. Wells Fargo’s ratings have shifted from Underweight to Equal Weight in 2025, indicating a more neutral stance. The consensus from multiple analysts currently stands at Hold.
Consumer Opinions
Consumer sentiment around Mesa Laboratories, Inc. (MLAB) reflects a mix of appreciation for product quality and concerns about customer service.
| Positive Reviews | Negative Reviews |
|---|---|
| “Reliable and precise lab equipment, great for our research needs.” | “Customer support is slow to respond and often unhelpful.” |
| “Durable products that last, excellent value for the price.” | “Shipping delays have caused project setbacks.” |
| “Innovative solutions that keep up with industry standards.” | “Limited product range compared to competitors.” |
Overall, consumers praise Mesa Laboratories for its dependable and innovative products but frequently highlight issues with customer service responsiveness and logistics.
Risk Analysis
Below is a table summarizing the main risks facing Mesa Laboratories, Inc., their likelihood, and potential impact on the company’s financial health and operations:
| Category | Description | Probability | Impact |
|---|---|---|---|
| Financial Performance | Negative profitability and returns, with net margin at -0.82% and ROE at -1.24%. | High | High |
| Liquidity Risk | Low current ratio (0.63) and quick ratio (0.47) indicate potential short-term cash shortages. | High | Medium |
| Debt and Solvency Risk | Debt-to-equity ratio of 1.14 and Altman Z-Score of 1.38 place the company in distress zone. | High | High |
| Market Volatility | Beta of 0.889 suggests moderate sensitivity to market fluctuations. | Medium | Medium |
| Competitive Pressure | Operating in tech and healthcare sectors with rapid innovation; risk of losing market share. | Medium | Medium |
| Dividend Yield | Low dividend yield of 0.54% may affect investor appeal. | Medium | Low |
The most critical risks are the financial distress signals, notably the negative profitability metrics and low liquidity, coupled with the Altman Z-Score indicating a high bankruptcy risk. Investors should closely monitor cash flow and debt management while considering the company’s moderate market sensitivity and competitive environment.
Should You Buy Mesa Laboratories, Inc.?
Mesa Laboratories, Inc. appears to be facing significant challenges with declining profitability and a deteriorating competitive moat, suggesting value destruction. Despite a manageable leverage profile, the company’s overall C+ rating and distress zone Altman Z-score indicate a cautious investment profile.
Strength & Efficiency Pillars
Mesa Laboratories, Inc. displays mixed efficiency signals with a favorable weighted average cost of capital (WACC) at 6.64%, reflecting relatively low capital costs. The company’s gross margin stands robust at 62.61%, underscoring solid operational control. However, key profitability metrics such as net margin (-0.82%), return on equity (-1.24%), and return on invested capital (-1.45%) are negative, indicating operational struggles. The Altman Z-Score of 1.38 places the firm in the distress zone, signaling financial vulnerability. Piotroski’s score is average (5), suggesting moderate financial health but no strong value creation, consistent with the company’s inability to generate returns above its cost of capital.
Weaknesses and Drawbacks
Several critical red flags emerge in Mesa Laboratories’ financial profile. The price-to-book ratio at 4.03 signals an expensive valuation relative to net asset value, while the negative P/E ratio (–326.35) reflects losses, complicating traditional valuation assessments. Leverage metrics are concerning: debt-to-equity at 1.14 and interest coverage of 1.5 show elevated financial risk and constrained ability to service debt. Liquidity is tight, with a current ratio of 0.63 and quick ratio of 0.47, both well below the standard safety threshold of 1. Seller dominance is minimal but the overall stock trend is bearish with a 24.46% price decline, highlighting ongoing market pressure.
Our Verdict about Mesa Laboratories, Inc.
Mesa Laboratories presents an unfavorable long-term fundamental profile characterized by negative profitability, financial distress signals, and high leverage. Although recent trading shows neutral buyer dominance and a modest price recovery of 8.75% in the last quarter, the broader bearish trend suggests caution. Despite pockets of operational strength such as a solid gross margin and manageable capital costs, the overall financial and market signals suggest that investors might consider a wait-and-see approach until stability and profitability improve.
Disclaimer: This content is for informational purposes only and does not constitute financial, investment, or other professional advice. Investing in financial markets involves a significant risk of loss, and past performance is not indicative of future results.
Additional Resources
- Mesa Laboratories’ (NASDAQ:MLAB) Dividend Will Be $0.16 – Yahoo Finance (Jan 11, 2026)
- Mesa Laboratories (NASDAQ:MLAB) Has Affirmed Its Dividend Of $0.16 – simplywall.st (Jan 11, 2026)
- MESA LABS DECLARES QUARTERLY DIVIDEND – GlobeNewswire (Jan 07, 2026)
- Mesa Laboratories: Appealing Territory Has Been Reached (NASDAQ:MLAB) – Seeking Alpha (Nov 25, 2025)
- Mesa Laboratories (NASDAQ: MLAB) to join Jefferies chat; live webcast Nov 20, 12:00 GMT – Stock Titan (Nov 12, 2025)
For more information about Mesa Laboratories, Inc., please visit the official website: mesalabs.com