Home > Analyses > Healthcare > Merck & Co., Inc.
Merck & Co., Inc. transforms lives daily by delivering breakthrough medicines and vaccines that combat some of the world’s most challenging diseases. As a stalwart in pharmaceuticals and animal health, Merck commands respect for its innovative pipeline and robust collaborations with global biotech leaders. Its leadership in oncology and immunology fuels steady growth amid evolving healthcare demands. Yet, as competition intensifies, I ask: do Merck’s fundamentals still support its premium valuation and growth prospects going forward?

Table of contents
Business Model & Company Overview
Merck & Co., Inc., founded in 1891 and based in Kenilworth, New Jersey, stands as a global leader in healthcare. It operates a diversified ecosystem spanning human pharmaceuticals and animal health. Its core mission integrates cutting-edge therapies in oncology, immunology, vaccines, and veterinary solutions, serving hospitals, healthcare providers, and animal producers worldwide.
Merck’s revenue engine balances innovative pharmaceutical products with a growing portfolio of animal health services, including digitally connected monitoring tools. Its strategic footprint spans the Americas, Europe, and Asia, driving consistent global demand. This competitive advantage secures Merck’s economic moat, underpinning its role in shaping the future of medicine and animal health.
Financial Performance & Fundamental Metrics
I analyze Merck & Co., Inc.’s income statement, key financial ratios, and dividend payout policy to assess its core financial health and shareholder value.
Income Statement
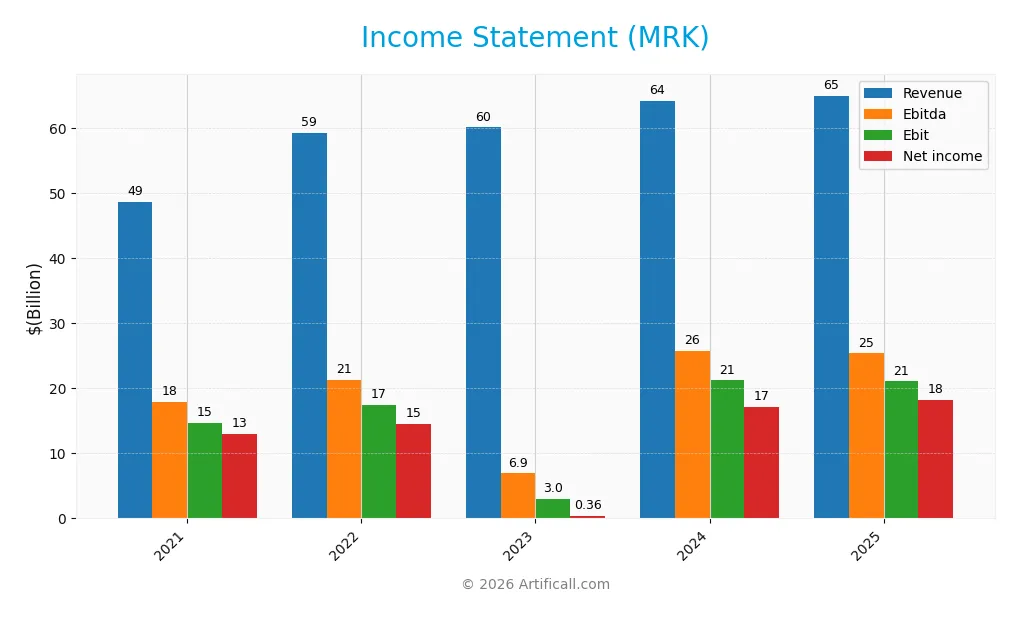
The table below summarizes Merck & Co., Inc.’s key income statement figures for the fiscal years 2021 to 2025, reflecting revenue, expenses, profits, and earnings per share.
| 2021 | 2022 | 2023 | 2024 | 2025 | |
|---|---|---|---|---|---|
| Revenue | 48.7B | 59.3B | 60.1B | 64.2B | 65.0B |
| Cost of Revenue | 13.6B | 17.4B | 16.1B | 15.2B | 12.0B |
| Operating Expenses | 21.9B | 23.6B | 41.0B | 28.8B | 26.2B |
| Gross Profit | 35.1B | 41.9B | 43.9B | 49.0B | 52.9B |
| EBITDA | 17.9B | 21.3B | 6.9B | 25.7B | 25.4B |
| EBIT | 14.7B | 17.4B | 3.0B | 21.2B | 21.1B |
| Interest Expense | 0.81B | 0.96B | 1.15B | 1.27B | 0.00B |
| Net Income | 13.0B | 14.5B | 0.37B | 17.1B | 18.3B |
| EPS | 5.16 | 5.73 | 0.14 | 6.76 | 7.28 |
| Filing Date | 2022-02-25 | 2023-02-24 | 2024-02-26 | 2025-02-25 | 2026-02-24 |
Income Statement Evolution
Merck’s revenue grew steadily, rising 33.5% from 2021 to 2025, though growth slowed to 1.3% in the latest year. Net income expanded nearly 40% overall, with a 5.3% margin improvement over the period. Gross and net margins remain strong, reflecting disciplined cost management and stable profitability despite modest EBIT contraction last year.
Is the Income Statement Favorable?
In 2025, Merck posted $65B revenue and $18.3B net income, delivering an 81.5% gross margin and 28.1% net margin, both favorable by industry standards. EBIT declined slightly by 0.7%, but EPS rose 8%, signaling efficient capital allocation. Interest expense is zero, supporting bottom-line strength. Overall, fundamentals show robust profitability with minor near-term challenges.
Financial Ratios
The following table presents key financial ratios for Merck & Co., Inc. from 2021 through 2025, illustrating profitability, valuation, liquidity, leverage, efficiency, and dividend metrics:
| Ratios | 2021 | 2022 | 2023 | 2024 | 2025 |
|---|---|---|---|---|---|
| Net Margin | 26.8% | 24.5% | 0.6% | 26.7% | 28.1% |
| ROE | 34.2% | 31.6% | 1.0% | 37.0% | 35.2% |
| ROIC | 13.9% | 18.5% | 0.7% | 18.9% | 34.7% |
| P/E | 14.9 | 19.3 | 779.0 | 14.7 | 14.5 |
| P/B | 5.08 | 6.11 | 7.56 | 5.44 | 5.08 |
| Current Ratio | 1.27 | 1.47 | 1.25 | 1.36 | 1.54 |
| Quick Ratio | 1.02 | 1.23 | 1.00 | 1.15 | 1.54 |
| D/E | 0.91 | 0.70 | 0.97 | 0.83 | 0.95 |
| Debt-to-Assets | 32.8% | 29.3% | 34.0% | 32.7% | 53.2% |
| Interest Coverage | 16.4 | 19.0 | 2.6 | 15.9 | 0 |
| Asset Turnover | 0.46 | 0.54 | 0.56 | 0.55 | 0.70 |
| Fixed Asset Turnover | 2.53 | 2.77 | 2.61 | 2.70 | 0 |
| Dividend Yield | 3.41% | 2.50% | 2.62% | 3.11% | 3.12% |
Evolution of Financial Ratios
Merck’s Return on Equity (ROE) shows a strong and improving trend, reaching 35.17% in 2025. The Current Ratio steadily increased to 1.54, indicating enhanced liquidity. Debt-to-Equity Ratio remained fairly stable near 0.95, signaling consistent leverage management. Profitability improved significantly, with net margins rising to 28.08% in 2025.
Are the Financial Ratios Favorable?
In 2025, Merck exhibits favorable profitability and liquidity metrics, including a robust net margin and solid current and quick ratios. Leverage is neutral with a debt-to-equity of 0.95 but an unfavorable debt-to-assets ratio above 50%. Market valuation ratios show mixed signals: a reasonable PE of 14.46 but an elevated price-to-book at 5.08. Overall, 64% of key ratios rate favorable.
Shareholder Return Policy
Merck & Co., Inc. maintains a dividend payout ratio near 45%, with a stable dividend per share rising from $2.61 in 2021 to $3.28 in 2025. The annual dividend yield hovers around 3.1%, supported by consistent free cash flow coverage, indicating prudent capital allocation.
The company also pursues share buybacks, complementing dividends in returning capital to shareholders. This balanced approach suggests a sustainable distribution policy aligned with long-term value creation, though investors should monitor leverage and cash flow trends for emerging risks.
Score analysis
The following radar chart displays Merck & Co., Inc.’s key financial scores across valuation, profitability, and leverage metrics:
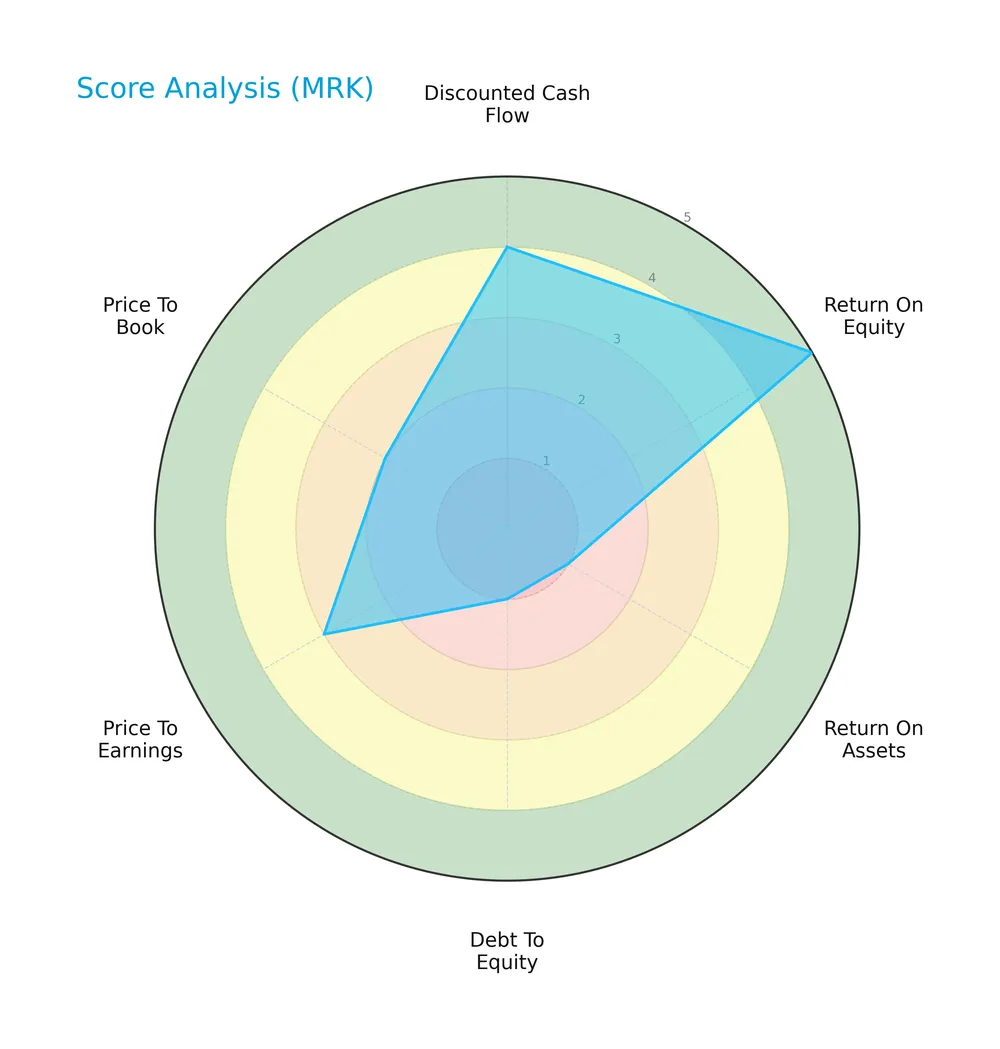
Merck scores very favorably on return on equity and discounted cash flow, indicating strong profitability and valuation appeal. However, very unfavorable debt-to-equity and return on assets scores signal financial leverage and asset efficiency concerns. Price multiples show mixed moderate to unfavorable readings.
Analysis of the company’s bankruptcy risk
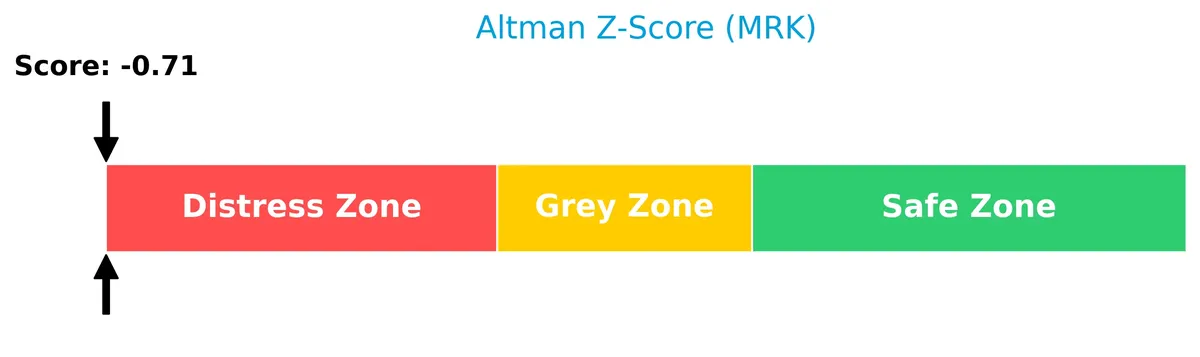
Merck’s Altman Z-Score places it firmly in the distress zone, signaling a high risk of bankruptcy and financial distress:
Is the company in good financial health?
The Piotroski Score diagram illustrates Merck’s strong overall financial condition based on profitability, leverage, and operational efficiency:

With a Piotroski Score of 7, Merck demonstrates solid financial health, reflecting efficient capital allocation and profitability despite some balance sheet risks.
Competitive Landscape & Sector Positioning
This analysis explores Merck & Co., Inc.’s strategic positioning, revenue segments, products, and competitors in healthcare. I will assess whether Merck holds a sustainable competitive advantage over its main rivals.
Strategic Positioning
Merck concentrates on pharmaceuticals, generating $58B out of $64B total in 2025, with a growing animal health segment at $6.35B. Its geographic footprint is diverse but U.S.-centric, contributing $36.5B or 57% of revenue, supported by substantial EMEA and Asia Pacific sales.
Revenue by Segment
This pie chart displays Merck & Co., Inc.’s revenue distribution by business segment for the fiscal year 2025, illustrating the contribution of Pharmaceuticals, Animal Health, and Other Segments.
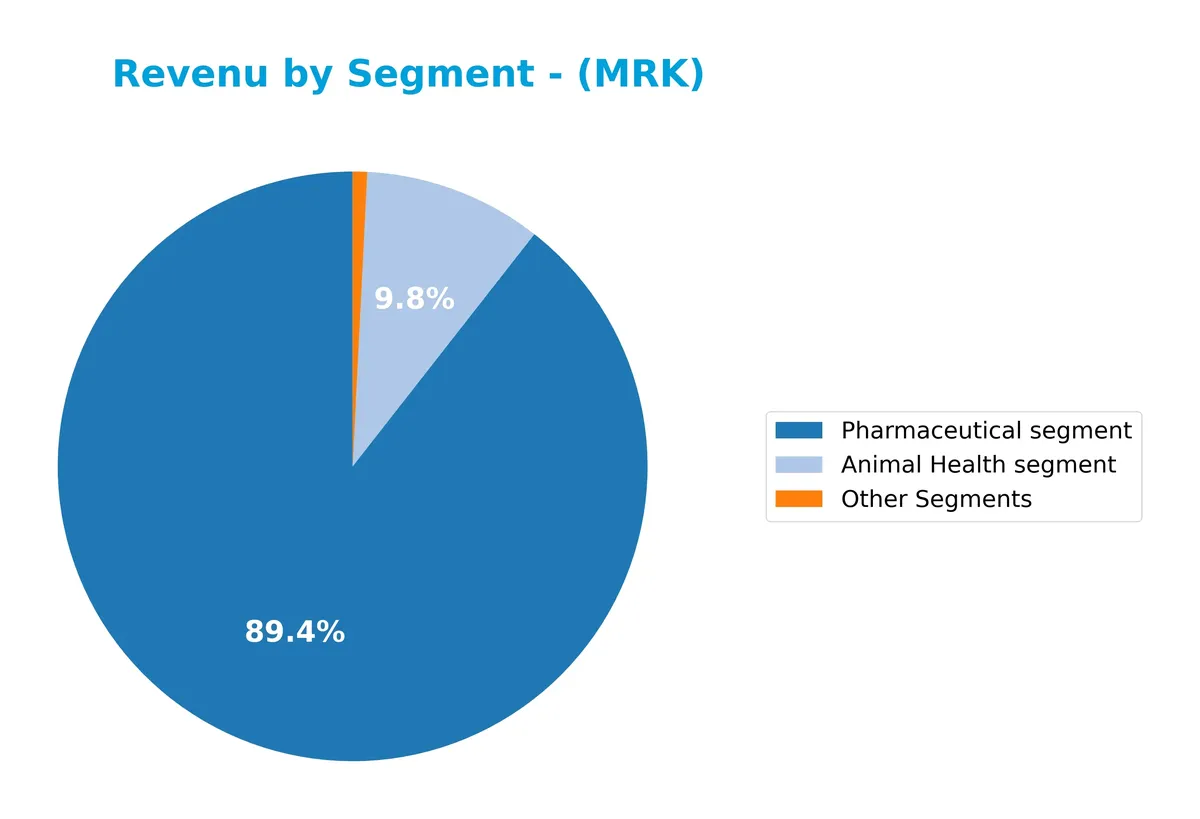
Pharmaceuticals dominate Merck’s revenue at $58.1B in 2025, showing steady growth from $53.6B in 2023. Animal Health gained traction, rising to $6.4B, reflecting expansion in this niche. Other Segments remain small at $515M, down from prior years, signaling a concentration risk toward Pharmaceuticals and Animal Health. The company’s focus on core segments suggests disciplined capital allocation aligned with its moat in drug innovation.
Key Products & Brands
Merck & Co., Inc. generates revenue primarily through these key products and brands across its main segments:
| Product | Description |
|---|---|
| Pharmaceutical segment | Human health products in oncology, immunology, neuroscience, virology, cardiovascular, diabetes, and vaccines. |
| Animal Health segment | Veterinary pharmaceuticals, vaccines, health management solutions, and digital monitoring products. |
| Other Segments | Miscellaneous healthcare-related products and services outside the main pharmaceutical and animal health lines. |
Merck’s core strength lies in its pharmaceutical segment, contributing over $58B in 2025. The animal health segment and other businesses complement its broad healthcare portfolio.
Main Competitors
Merck & Co., Inc. faces 10 main competitors in the Drug Manufacturers – General industry. The table below lists the top 10 leaders by market capitalization:
| Competitor | Market Cap. |
|---|---|
| Eli Lilly and Company | 970B |
| Johnson & Johnson | 500B |
| AbbVie Inc. | 405B |
| AstraZeneca PLC | 285B |
| Merck & Co., Inc. | 268B |
| Amgen Inc. | 176B |
| Gilead Sciences, Inc. | 151B |
| Pfizer Inc. | 143B |
| Bristol-Myers Squibb Co. | 109B |
| Biogen Inc. | 26B |
Merck ranks 5th among its peers, holding about 32% of Eli Lilly’s market cap, the sector leader. It stands above both the top 10 average (303B) and median sector capitalization (222B). The 7.92% gap to AstraZeneca highlights a narrow margin to its nearest competitor above.
Comparisons with competitors
Check out how we compare the company to its competitors:
Does MRK have a competitive advantage?
Merck & Co., Inc. shows a clear competitive advantage with a very favorable moat, evidenced by a ROIC nearly 30% above its cost of capital and a strong upward ROIC trend. This indicates efficient capital use and sustained value creation amid the healthcare sector’s challenges.
Looking ahead, Merck’s diverse pharmaceutical and animal health segments, plus collaborations on long-acting HIV treatments, position it well to expand product lines and markets. These opportunities support continued growth and profitability in a competitive industry.
SWOT Analysis
This analysis highlights Merck’s key internal strengths and weaknesses alongside external opportunities and threats shaping its strategic outlook.
Strengths
- strong gross margin at 81.5%
- robust ROIC at 34.65% well above WACC
- diversified revenue with global footprint
Weaknesses
- elevated debt-to-assets ratio at 53.21%
- unfavorable price-to-book ratio at 5.08
- Altman Z-score in distress zone signals financial risk
Opportunities
- expanding US market revenue growth
- strategic collaborations in HIV treatments
- growth in vaccine and animal health segments
Threats
- intense pharmaceutical industry competition
- pricing and regulatory pressures
- geopolitical risks affecting international sales
Merck’s solid profitability and competitive moat fuel sustainable value creation. However, its high leverage and financial distress signals warrant caution. The company must leverage growth opportunities while managing debt and regulatory risks.
Stock Price Action Analysis
The weekly stock chart reflects Merck & Co., Inc.’s price movement over the past 12 months, highlighting key highs and lows alongside volatility trends:
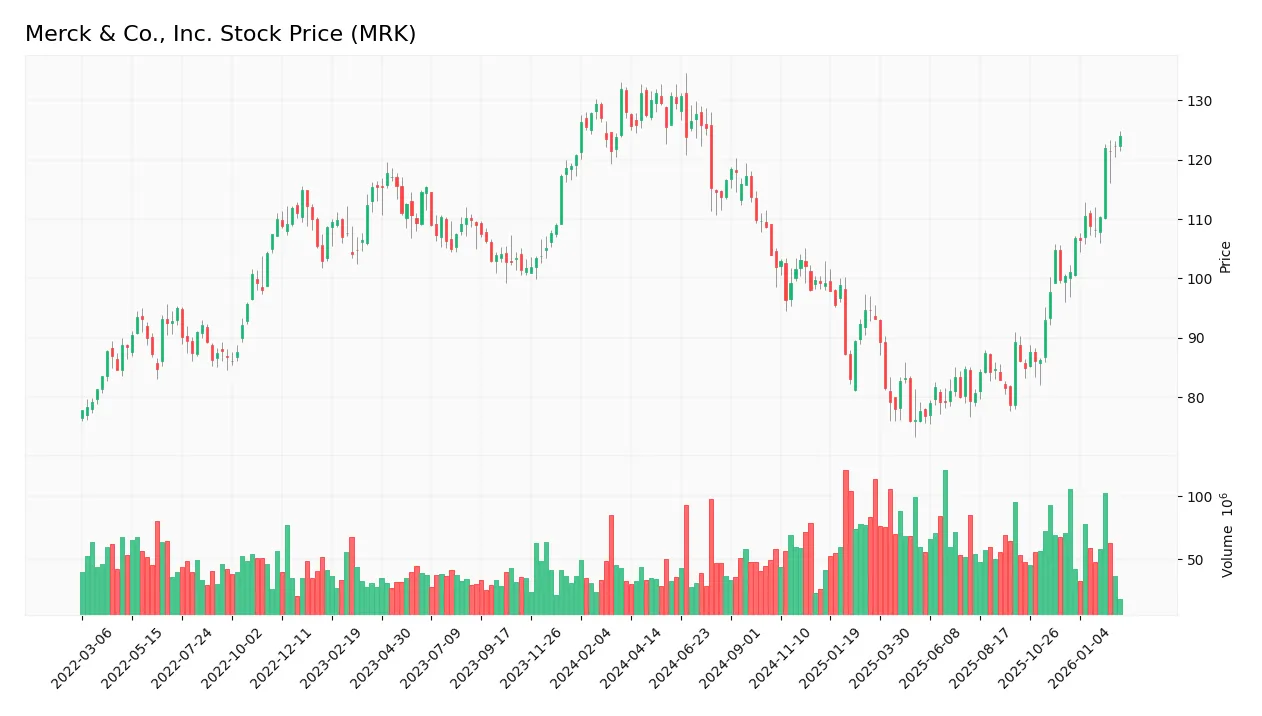
Trend Analysis
Over the past 12 months, Merck’s stock declined by 3.17%, indicating a bearish trend. The price showed acceleration in its downward movement. Notable volatility is evident with a 17.33 standard deviation, and the stock ranged between 75.97 and 131.2.
Volume Analysis
In the last three months, trading volumes increased with a strong buyer dominance of 71.8%. This buyer-driven activity suggests heightened investor interest and growing market participation during this period.
Target Prices
Analysts show a confident target consensus for Merck & Co., Inc. based on current evaluations.
| Target Low | Target High | Consensus |
|---|---|---|
| 90 | 150 | 123.92 |
The target range from 90 to 150 with a consensus near 124 suggests moderate upside potential. Analysts expect steady growth but maintain cautious optimism.

Don’t Let Luck Decide Your Entry Point
Optimize your entry points with our advanced ProRealTime indicators. You’ll get efficient buy signals with precise price targets for maximum performance. Start outperforming now!
Analyst & Consumer Opinions
This section examines Merck & Co., Inc.’s recent analyst grades alongside consumer feedback to gauge market sentiment.
Stock Grades
Here is a summary of recent verified stock grades from leading financial institutions for Merck & Co., Inc.:
| Grading Company | Action | New Grade | Date |
|---|---|---|---|
| Guggenheim | Maintain | Buy | 2026-02-06 |
| Citigroup | Maintain | Neutral | 2026-02-04 |
| Wells Fargo | Maintain | Overweight | 2026-02-04 |
| Cantor Fitzgerald | Maintain | Neutral | 2026-02-04 |
| Citigroup | Maintain | Neutral | 2026-01-27 |
| TD Cowen | Maintain | Hold | 2026-01-20 |
| Wolfe Research | Upgrade | Outperform | 2026-01-08 |
| Citigroup | Maintain | Neutral | 2026-01-07 |
| UBS | Maintain | Buy | 2026-01-07 |
| BMO Capital | Upgrade | Outperform | 2025-12-18 |
The overall grading trend for Merck shows a stable outlook with multiple institutions maintaining Buy or Neutral ratings. Notably, Wolfe Research and BMO Capital upgraded their grades to Outperform, indicating growing confidence in the stock’s prospects.
Consumer Opinions
Consumers express a mix of admiration and concern about Merck & Co., Inc.’s products and services.
| Positive Reviews | Negative Reviews |
|---|---|
| Effective medications with noticeable results | High prices limit accessibility for some users |
| Strong commitment to research and innovation | Customer service response times can be slow |
| Reliable supply chain with consistent availability | Side effects reported in certain drug categories |
Overall, consumers appreciate Merck’s innovation and product efficacy. However, pricing and occasional service delays remain persistent issues affecting user satisfaction.
Risk Analysis
Below is a summary table outlining key risks facing Merck & Co., Inc., categorized by likelihood and potential impact:
| Category | Description | Probability | Impact |
|---|---|---|---|
| Financial Health | Altman Z-Score indicates distress zone, signaling bankruptcy risk | Medium | High |
| Leverage | High debt-to-assets ratio at 53.2%, increases financial risk | High | Medium |
| Valuation | Unfavorable price-to-book ratio suggests possible overvaluation | Medium | Medium |
| Operational | Zero fixed asset turnover highlights inefficiency concerns | Low | Medium |
| Market Volatility | Low beta (0.296) reduces stock price sensitivity to market swings | Low | Low |
The most pressing risk is Merck’s Altman Z-Score placing it in the distress zone, raising caution about financial stability despite strong profitability metrics. High leverage also amplifies vulnerability to interest rate shifts. Investors should weigh these risks against Merck’s robust ROIC and favorable dividend yield.
Should You Buy Merck & Co., Inc.?
Merck appears to be generating strong value creation with a durable competitive moat supported by growing ROIC well above WACC. Despite a challenging leverage profile and mixed liquidity signals, its overall rating of B suggests a very favorable but cautious investment interpretation.
Strength & Efficiency Pillars
Merck & Co., Inc. presents robust profitability with a net margin of 28.08% and a return on equity of 35.17%. Its return on invested capital stands at 34.65%, comfortably exceeding the weighted average cost of capital at 4.69%, confirming Merck as a clear value creator. The company’s strong moat is reflected in growing ROIC and sustained competitive advantage. Operational margins remain solid despite financial headwinds.
Weaknesses and Drawbacks
Merck is currently in financial distress, evidenced by a deeply negative Altman Z-Score of -0.71, signaling high bankruptcy risk. This solvency issue overshadows other metrics. Additional concerns include an unfavorable price-to-book ratio of 5.08 and elevated debt-to-assets at 53.21%, which amplify leverage risk. While the current ratio of 1.54 is healthy, the distress warning demands caution regardless of favorable earnings and cash flow metrics.
Our Final Verdict about Merck & Co., Inc.
Despite Merck’s operational strengths and strong profitability, the negative Altman Z-Score places it squarely in the distress zone. This solvency risk renders the investment profile highly speculative and too risky for conservative capital. Investors might consider waiting for signs of financial stabilization before committing to long-term exposure, as current financial health raises significant red flags.
Disclaimer: This content is for informational purposes only and does not constitute financial, investment, or other professional advice. Investing in financial markets involves a significant risk of loss, and past performance is not indicative of future results.
Additional Resources
- Merck to create separate cancer division as Keytruda patent loss looms – CNBC (Feb 23, 2026)
- Has Merck (MRK) Run Too Far After Its 41% Discount To Estimated Fair Value? – Yahoo Finance (Feb 25, 2026)
- Final Trades: Amazon, Horizon Kinetics Inflation, Merck and PG&E – CNBC (Feb 23, 2026)
- Merck: This Cancer‑Drug Powerhouse Could Be a Core Dividend Holding for Decades – The Motley Fool (Feb 22, 2026)
- Merck’s Keytruda Likely Has a Few Extra Years of Dominance, With Billions on the Line – BioSpace (Feb 24, 2026)
For more information about Merck & Co., Inc., please visit the official website: merck.com