Home > Analyses > Healthcare > Medtronic plc
Medtronic plc transforms healthcare by developing life-saving medical devices that millions depend on daily. As a global powerhouse in medical technology, Medtronic leads with innovative cardiovascular implants, surgical robotics, and diabetes management systems known for their quality and impact. With a diverse portfolio addressing critical health needs, the company continues to push boundaries in patient care. The key question for investors now is whether Medtronic’s strong fundamentals still support its attractive valuation and growth prospects in a competitive healthcare landscape.

Table of contents
Business Model & Company Overview
Medtronic plc, founded in 1949 and headquartered in Dublin, Ireland, stands as a global leader in the medical devices industry. Its extensive portfolio creates a cohesive ecosystem of device-based medical therapies spanning cardiovascular, surgical, neuroscience, and diabetes care. Serving healthcare systems, clinicians, and patients worldwide, Medtronic integrates advanced technology and patient-centered solutions to address diverse medical needs.
The company’s revenue engine is driven by a balanced mix of implantable devices, surgical instruments, and advanced software solutions, including remote monitoring and robotic-assisted surgery systems. Medtronic leverages its strategic presence across the Americas, Europe, and Asia, enabling robust market penetration and diversified growth. Its strong economic moat lies in its innovation pipeline and comprehensive product ecosystem that shapes the future of medical technology.
Financial Performance & Fundamental Metrics
I will analyze Medtronic plc’s income statement, key financial ratios, and dividend payout policy to provide a clear view of its fundamental strength.
Income Statement
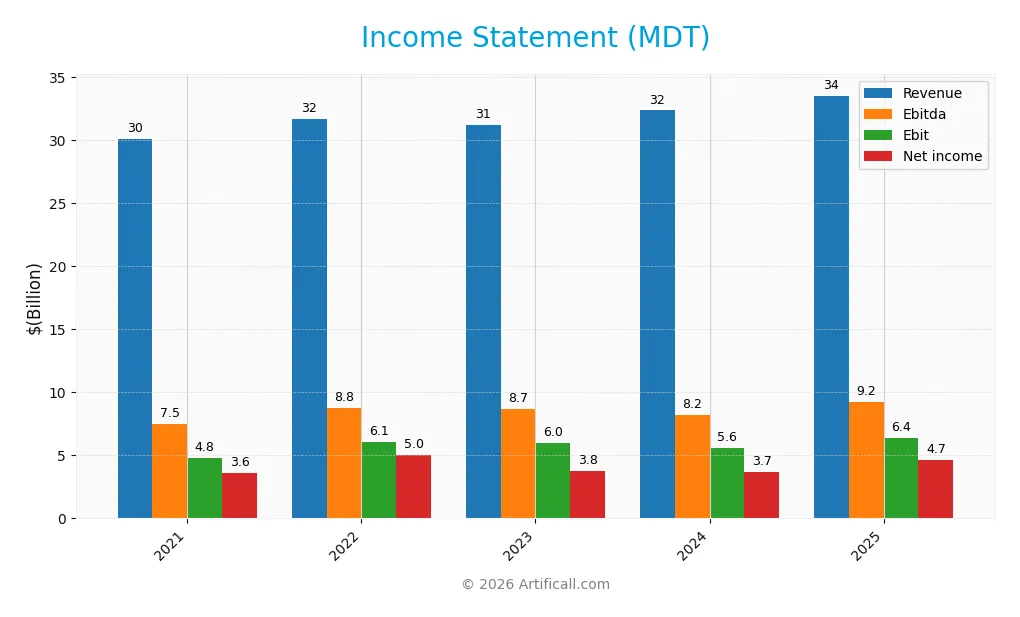
The table below summarizes Medtronic plc’s key income statement figures over the last five fiscal years, reported in USD.
| 2021 | 2022 | 2023 | 2024 | 2025 | |
|---|---|---|---|---|---|
| Revenue | 30.1B | 31.7B | 31.2B | 32.4B | 33.5B |
| Cost of Revenue | 10.5B | 10.1B | 10.7B | 11.2B | 11.6B |
| Operating Expenses | 15.2B | 15.8B | 15.0B | 16.0B | 15.9B |
| Gross Profit | 19.6B | 21.5B | 20.5B | 21.1B | 21.9B |
| EBITDA | 7.5B | 8.8B | 8.7B | 8.2B | 9.2B |
| EBIT | 4.8B | 6.1B | 6.0B | 5.6B | 6.4B |
| Interest Expense | 925M | 553M | 636M | 719M | 729M |
| Net Income | 3.6B | 5.0B | 3.8B | 3.7B | 4.7B |
| EPS | 2.68 | 3.75 | 2.83 | 2.77 | 3.63 |
| Filing Date | 2021-06-25 | 2022-06-23 | 2023-06-22 | 2024-06-20 | 2025-06-20 |
Income Statement Evolution
Medtronic plc’s revenue has shown steady growth from $30.1B in 2021 to $33.5B in 2025, marking an 11.36% increase over the period. Net income rose from $3.6B to $4.7B, a 29.28% growth, with net margins improving to 13.9%. Margins overall have been favorable, with gross margin stable around 65%, reflecting consistent profitability.
Is the Income Statement Favorable?
In 2025, Medtronic’s fundamentals remain strong, with revenue growth of 3.62% and a significant 14.42% increase in EBIT. Operating expenses grew favorably relative to revenue, supporting margin expansion. Net income and EPS increased by 22.39% and 30.8%, respectively. Interest expense is well-managed at 2.17% of revenue, contributing to a global positive evaluation of the income statement.
Financial Ratios
The following table presents key financial ratios for Medtronic plc (MDT) over the fiscal years 2021 to 2025, offering a snapshot of the company’s profitability, leverage, liquidity, and market valuation metrics:
| Ratios | 2021 | 2022 | 2023 | 2024 | 2025 |
|---|---|---|---|---|---|
| Net Margin | 12% | 16% | 12% | 11% | 14% |
| ROE | 7.0% | 9.6% | 7.3% | 7.3% | 9.7% |
| ROIC | 4.9% | 6.4% | 4.7% | 4.9% | 6.1% |
| P/E | 48.8 | 27.8 | 32.1 | 29.0 | 23.4 |
| P/B | 3.4 | 2.7 | 2.3 | 2.1 | 2.3 |
| Current Ratio | 2.65 | 1.86 | 2.39 | 2.03 | 1.85 |
| Quick Ratio | 2.14 | 1.49 | 1.81 | 1.55 | 1.42 |
| D/E | 0.51 | 0.46 | 0.47 | 0.50 | 0.59 |
| Debt-to-Assets | 28% | 27% | 27% | 28% | 31% |
| Interest Coverage | 4.8 | 10.4 | 8.6 | 7.2 | 8.2 |
| Asset Turnover | 0.32 | 0.35 | 0.34 | 0.36 | 0.37 |
| Fixed Asset Turnover | 5.8 | 5.9 | 5.6 | 5.3 | 4.9 |
| Dividend Yield | 1.8% | 2.4% | 3.0% | 3.4% | 3.3% |
Evolution of Financial Ratios
Over the period leading to fiscal 2025, Medtronic’s Return on Equity (ROE) showed fluctuations with a recent decline to 9.71%, indicating a slowdown in profitability improvement. The Current Ratio decreased from 2.65 in 2021 to 1.85 in 2025, reflecting reduced but still solid liquidity. Debt-to-Equity Ratio rose slightly to 0.59, suggesting moderate leverage with some increase in financial risk.
Are the Financial Ratios Favorable?
In 2025, Medtronic’s profitability exhibits mixed signals: net margin is favorable at 13.9%, while ROE is unfavorable at 9.71%, and return on invested capital is neutral at 6.08%. Liquidity ratios, including current (1.85) and quick (1.42), are favorable, supporting short-term financial strength. Leverage metrics like debt-to-equity (0.59) and debt-to-assets (31.1%) are neutral, reflecting balanced risk. Market valuation ratios such as P/E (23.37) and P/B (2.27) are neutral. Overall, the ratio profile appears slightly favorable with half of the key ratios positive.
Shareholder Return Policy
Medtronic plc maintains a consistent dividend payout, with a recent payout ratio near 77% and a dividend yield around 3.3%. Dividend payments are supported by solid free cash flow coverage, while share buybacks also contribute to shareholder returns.
This balanced approach of dividends and buybacks appears sustainable, reflecting prudent cash flow management that supports long-term shareholder value without risking excessive distributions or overleveraging.
Score analysis
The radar chart below summarizes key financial performance scores for a comprehensive company evaluation:
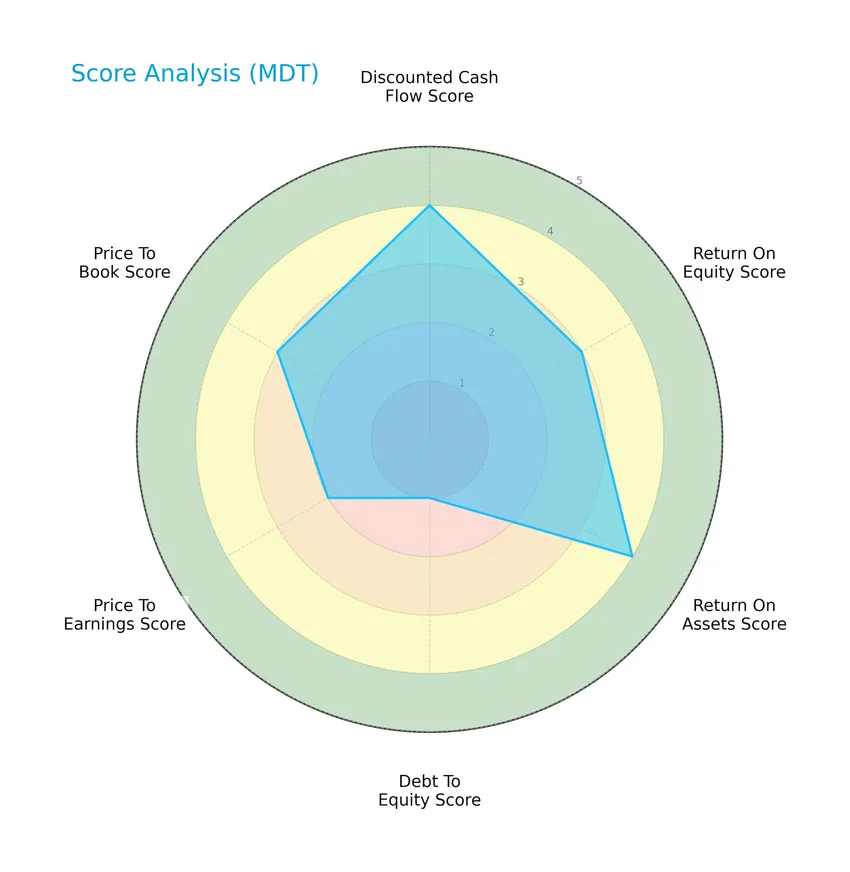
Medtronic plc shows favorable scores in discounted cash flow (4) and return on assets (4), moderate scores for return on equity (3), price-to-earnings (2), and price-to-book (3), but a very unfavorable debt-to-equity score (1), indicating mixed financial metrics.
Analysis of the company’s bankruptcy risk
The Altman Z-Score places Medtronic plc in the safe zone, suggesting a low risk of bankruptcy based on its financial ratios:

Is the company in good financial health?
The Piotroski diagram below illustrates the company’s financial strength based on key accounting criteria:

With a Piotroski Score of 7 classified as strong, Medtronic plc demonstrates solid financial health, reflecting good profitability, leverage, liquidity, and operating efficiency.
Competitive Landscape & Sector Positioning
This sector analysis will examine Medtronic plc’s strategic positioning, revenue segments, key products, and main competitors. I will assess whether Medtronic holds a competitive advantage within the medical devices industry.
Strategic Positioning
Medtronic plc maintains a diversified product portfolio across four main segments—Cardiac and Vascular (12.5B), Neuroscience (9.8B), Medical Surgical (8.4B), and Diabetes (2.8B) as of FY 2025. Geographically, it balances revenue between the United States (17.2B) and other international markets (16.3B), reflecting broad global exposure.
Revenue by Segment
The pie chart illustrates Medtronic plc’s revenue distribution across four main segments for the fiscal year 2025, highlighting their respective contributions in USD.
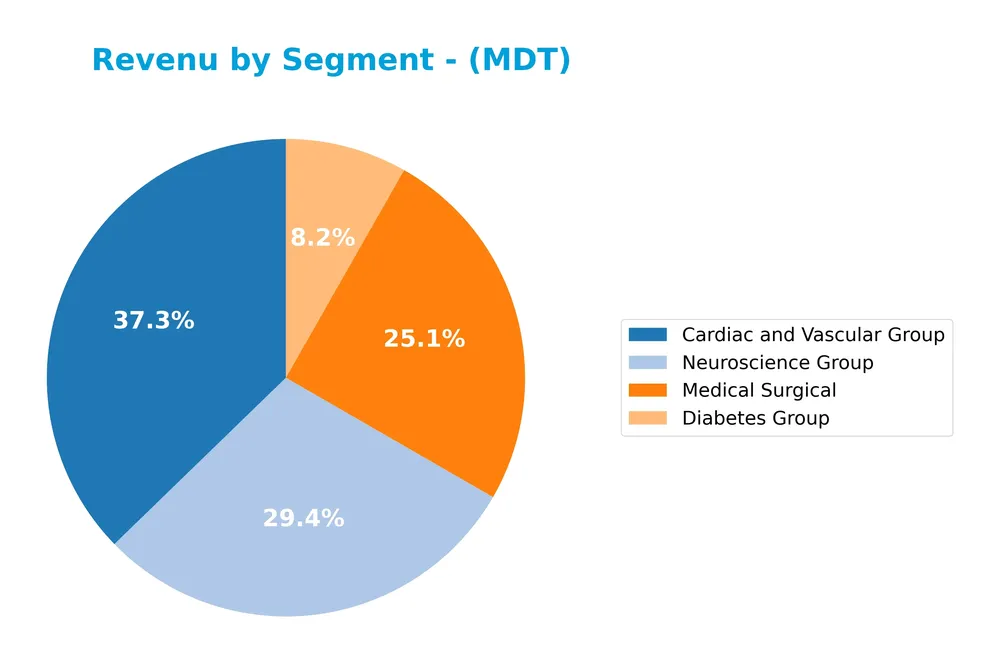
In 2025, the Cardiac and Vascular Group remains the largest revenue driver at $12.5B, showing steady growth from previous years. Neuroscience follows closely with $9.8B, also exhibiting consistent expansion. Medical Surgical generated $8.4B, stable year-over-year, while the Diabetes Group brought in $2.8B, indicating gradual growth. The company demonstrates diversified revenue streams with moderate acceleration in its leading segments, though Diabetes remains a smaller share, suggesting some concentration risk in cardiovascular and neuroscience markets.
Key Products & Brands
The following table outlines Medtronic plc’s primary products and brands by portfolio segment:
| Product | Description |
|---|---|
| Cardiac and Vascular Group | Implantable cardiac pacemakers, cardioverter defibrillators, cardiac resynchronization therapy devices, cardiac ablation products, insertable cardiac monitors, TYRX products, remote monitoring software, aortic valves, stent grafts, and percutaneous coronary intervention devices. |
| Medical Surgical Portfolio | Surgical stapling devices, vessel sealing instruments, wound closure products, electrosurgery products, surgical AI and robotic-assisted surgery devices, hernia mechanical devices, mesh implants, gynecology and lung products, minimally invasive GI and hepatologic diagnostics and therapies, patient monitoring, airway management, ventilation therapies, and renal disease products. |
| Neuroscience Group | Devices for spinal and neurosurgery, pain management, anesthesiology, orthopedics, urology, ENT specialists; energy surgical instruments; image-guided and intra-operative imaging systems; robotic guidance for spine procedures; therapies for brain vasculature. |
| Diabetes Group | Insulin pumps and consumables, continuous glucose monitoring systems, smart insulin pen systems, and related supplies. |
Medtronic’s diverse portfolio spans cardiovascular, surgical, neuroscience, and diabetes care, offering advanced medical devices and therapies to a broad range of healthcare professionals and patients worldwide.
Main Competitors
Medtronic plc faces competition from 10 key players in the Healthcare sector, specifically in Medical Devices, with the top 10 leaders by market capitalization as follows:
| Competitor | Market Cap. |
|---|---|
| Abbott Laboratories | 216B |
| Boston Scientific Corporation | 140B |
| Stryker Corporation | 133B |
| Medtronic plc | 123B |
| Edwards Lifesciences Corporation | 50B |
| DexCom, Inc. | 26B |
| STERIS plc | 25B |
| Insulet Corporation | 20B |
| Zimmer Biomet Holdings, Inc. | 18B |
| Align Technology, Inc. | 11B |
Medtronic plc ranks 4th among its top 10 competitors with a market cap at 59.86% of the leader, Abbott Laboratories. It stands above both the average market cap of 76B and the median of 38B in its sector. The company maintains a modest 2.9% gap from the next competitor above, indicating a competitive but stable position in the market.
Comparisons with competitors
Check out how we compare the company to its competitors:
Does MDT have a competitive advantage?
Medtronic plc currently does not present a clear competitive advantage as it is shedding value with a negative spread between ROIC and WACC, indicating it is not generating excess returns above its cost of capital. However, the company’s ROIC trend is growing, suggesting improving profitability despite its overall slightly unfavorable moat status.
Looking ahead, Medtronic’s diverse portfolio across cardiovascular, medical surgical, neuroscience, and diabetes segments positions it to capitalize on evolving healthcare needs. Continued innovation in device-based medical therapies and expansion in global markets offer potential opportunities for future growth and value creation.
SWOT Analysis
This SWOT analysis highlights the key internal and external factors affecting Medtronic plc to guide investors in assessing its strategic position.
Strengths
- Strong global medical device portfolio
- Favorable profit margins with 13.9% net margin
- Consistent revenue and EPS growth
Weaknesses
- Moderate return on equity at 9.7%
- Asset turnover below industry average
- Debt to equity concerns with low debt score
Opportunities
- Expansion in emerging markets and new therapies
- Growth in diabetes and robotic surgery segments
- Increasing demand for minimally invasive devices
Threats
- Intense competition in medical devices
- Regulatory and reimbursement risks
- Potential supply chain disruptions
Overall, Medtronic demonstrates solid profitability and growth potential supported by a diversified product range. However, investors should monitor efficiency and leverage metrics while considering market and regulatory challenges in the healthcare sector.
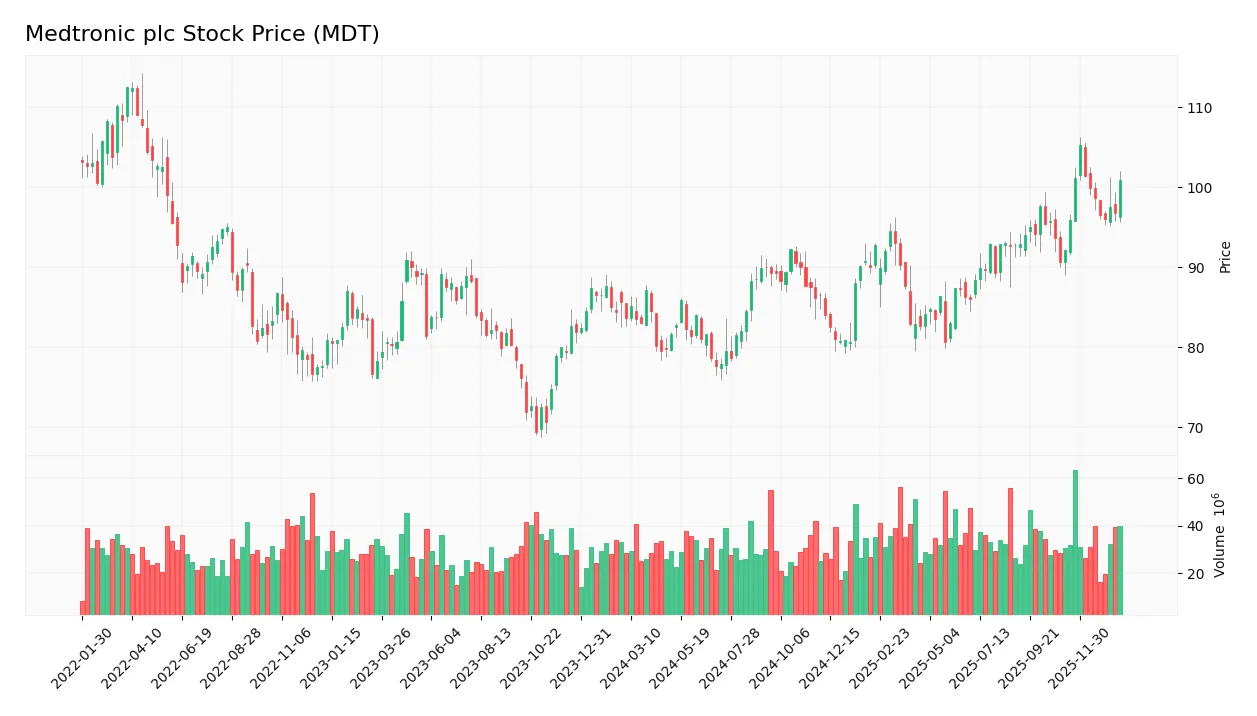
Stock Price Action Analysis
The following weekly stock chart illustrates Medtronic plc’s price movements over the past 12 months, highlighting key fluctuations and trend developments:
Trend Analysis
Over the past 12 months, MDT’s stock price increased by 20.67%, indicating a bullish trend. Price volatility, measured by a standard deviation of 6.09, reflects moderate fluctuations. The highest price reached 105.33 and the lowest was 77.61. The trend shows deceleration, suggesting a slowing momentum despite overall gains.
Volume Analysis
Trading volume for MDT has been increasing, with a total of 3.94B shares exchanged and buyer volume slightly exceeding seller volume at 50.67%. In the recent period from November 2025 to January 2026, buyer dominance grew to 57.07%, signaling slightly buyer-driven activity and increased market participation.
Target Prices
Analysts show a positive outlook for Medtronic plc with a clear consensus on target prices.
| Target High | Target Low | Consensus |
|---|---|---|
| 120 | 103 | 111.67 |
The target prices suggest moderate upside potential, reflecting confidence in Medtronic’s growth prospects while acknowledging some valuation risks.

Don’t Let Luck Decide Your Entry Point
Optimize your entry points with our advanced ProRealTime indicators. You’ll get efficient buy signals with precise price targets for maximum performance. Start outperforming now!
Analyst & Consumer Opinions
This section examines recent analyst ratings and consumer feedback regarding Medtronic plc (MDT) to provide balanced insights.
Stock Grades
The following table presents recent verifiable grades from recognized financial institutions for Medtronic plc (MDT):
| Grading Company | Action | New Grade | Date |
|---|---|---|---|
| Bernstein | Maintain | Outperform | 2026-01-09 |
| Barclays | Maintain | Overweight | 2026-01-08 |
| William Blair | Upgrade | Outperform | 2026-01-06 |
| Truist Securities | Maintain | Hold | 2025-12-18 |
| Truist Securities | Maintain | Hold | 2025-11-20 |
| Barclays | Maintain | Overweight | 2025-11-20 |
| Goldman Sachs | Upgrade | Neutral | 2025-11-19 |
| UBS | Maintain | Neutral | 2025-11-19 |
| Wells Fargo | Maintain | Overweight | 2025-11-19 |
| Morgan Stanley | Maintain | Overweight | 2025-11-19 |
Overall, the consensus grades for MDT indicate a predominantly positive outlook with multiple “Outperform” and “Overweight” ratings sustained or upgraded recently, while neutral and hold ratings remain steady without downward revisions.
Consumer Opinions
Consumers generally express confidence in Medtronic plc’s innovation and product reliability, though some concerns remain regarding customer service responsiveness.
| Positive Reviews | Negative Reviews |
|---|---|
| “Medtronic’s medical devices have significantly improved my quality of life.” | “Customer support can be slow when dealing with technical issues.” |
| “High-quality products that are reliable and durable.” | “Pricing is sometimes higher compared to competitors.” |
| “Innovative solutions in healthcare technology that meet patient needs.” | “Occasional delays in product delivery have been frustrating.” |
Overall, consumers praise Medtronic’s advanced and dependable medical technologies, while commonly pointing out the need for improved customer service and more competitive pricing.
Risk Analysis
The following table summarizes key risk categories for Medtronic plc, highlighting their likelihood and potential impact on the company’s performance:
| Category | Description | Probability | Impact |
|---|---|---|---|
| Regulatory Risk | Changes in healthcare regulations or device approvals could delay product launches or sales. | Medium | High |
| Competitive Risk | Intense competition in medical devices may pressure margins and market share. | High | Medium |
| Technological Risk | Rapid innovation demands continuous R&D investment; failure could lead to obsolescence. | Medium | High |
| Financial Risk | Moderate debt-to-equity ratio with some concerns on leverage may affect financial flexibility. | Medium | Medium |
| Market Volatility | Stock price sensitive to healthcare sector shifts and macroeconomic factors. | Medium | Medium |
| Supply Chain Risk | Disruptions can impact manufacturing and delivery of critical medical devices. | Medium | High |
The most significant risks arise from regulatory changes and technological advancements, both carrying high impact if unmanaged. Medtronic’s safe Altman Z-Score (3.1) and strong Piotroski score (7) suggest good financial health, but competitive pressures and supply chain vulnerabilities require close monitoring.
Should You Buy Medtronic plc?
Medtronic plc appears to be a company with improving operational efficiency and a slightly unfavorable moat due to value destruction despite rising profitability. Its leverage profile could be seen as substantial, while the overall rating suggests a very favorable investment case with moderate financial strength.
Strength & Efficiency Pillars
Medtronic plc exhibits robust profitability with a net margin of 13.9% and an EBIT margin of 18.96%, underscoring operational efficiency. The Altman Z-Score of 3.10 places the company securely in the safe zone, reflecting solid financial health and low bankruptcy risk. Additionally, a strong Piotroski Score of 7 indicates sound fundamentals. While the ROIC at 6.08% slightly trails the WACC of 6.54%, signaling value erosion, the company’s improving ROIC trend by 23.03% suggests growing profitability and operational improvements.
Weaknesses and Drawbacks
Despite a stable debt-to-equity ratio of 0.59 and favorable liquidity ratios (current ratio 1.85, quick ratio 1.42), leverage remains a moderate concern given a very unfavorable debt-to-equity score in the evaluation. Valuation metrics are moderate, with a P/E of 23.37 and P/B of 2.27, indicating neither a deep value nor an overly stretched premium. The return on equity of 9.71% is below expectations, flagging potential inefficiencies in equity utilization. Additionally, an unfavorable asset turnover of 0.37 points to less efficient asset use, which may pressure future growth.
Our Verdict about Medtronic plc
Medtronic’s long-term fundamental profile might appear favorable due to strong profitability, financial stability, and improving operational efficiency, despite slight value destruction indicated by ROIC below WACC. The bullish overall stock trend, coupled with recent slightly buyer-dominant behavior and increasing volume, suggests the profile could be attractive for long-term exposure. Investors might consider a cautious approach, balancing solid fundamentals against moderate valuation and leverage concerns.
Disclaimer: This content is for informational purposes only and does not constitute financial, investment, or other professional advice. Investing in financial markets involves a significant risk of loss, and past performance is not indicative of future results.
Additional Resources
- Medtronic: Don’t Miss Out On This Dividend Aristocrat Now (NYSE:MDT) – Seeking Alpha (Jan 21, 2026)
- Blackhawk Capital Partners LLC Makes New Investment in Medtronic PLC $MDT – MarketBeat (Jan 24, 2026)
- Assessing Medtronic (MDT) Valuation As Shares Trade Near Analyst Narrative Of Modest Undervaluation – Sahm (Jan 24, 2026)
- Medtronic (MDT) Outpaces Stock Market Gains: What You Should Know – Yahoo Finance (Jan 22, 2026)
- Envestnet Portfolio Solutions Inc. Has $13.60 Million Stock Holdings in Medtronic PLC $MDT – MarketBeat (Jan 24, 2026)
For more information about Medtronic plc, please visit the official website: medtronic.com