Home > Analyses > Healthcare > McKesson Corporation
McKesson Corporation plays a vital role in delivering essential healthcare products and services that impact millions of lives daily. As a key player in pharmaceutical distribution and medical-surgical solutions, McKesson stands out for its innovation and comprehensive technology offerings connecting pharmacies, providers, and biopharma partners. With a strong market presence and diversified operations, the question remains: does McKesson’s current valuation reflect its growth potential and ability to navigate evolving healthcare demands?

Table of contents
Business Model & Company Overview
McKesson Corporation, founded in 1833 and headquartered in Irving, Texas, stands as a dominant player in the medical distribution sector. Its integrated ecosystem spans U.S. Pharmaceutical distribution, international services across 13 European countries and Canada, medical-surgical supply logistics, and advanced prescription technology solutions. This cohesive mission supports healthcare providers and patients by streamlining access to medicines and medical products globally.
The company’s revenue engine balances robust pharmaceutical distribution with innovative technology and service offerings. McKesson generates value through a blend of product sales and recurring solutions that connect pharmacies, providers, payers, and biopharma firms, sustaining its presence in the Americas, Europe, and Asia. This strategic diversification creates a formidable economic moat, securing McKesson’s role as a key architect in the evolving healthcare landscape.
Financial Performance & Fundamental Metrics
I will analyze McKesson Corporation’s income statement, key financial ratios, and dividend payout policy to provide a clear view of its fundamental health.
Income Statement
The table below provides McKesson Corporation’s key income statement figures for the fiscal years 2021 through 2025, expressed in USD.
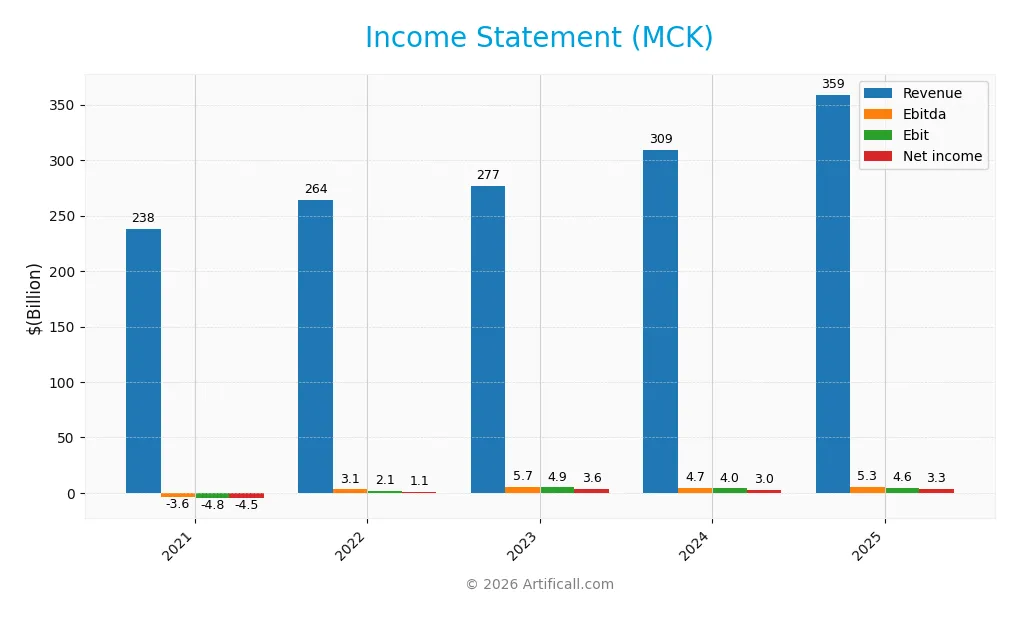
| 2021 | 2022 | 2023 | 2024 | 2025 | |
|---|---|---|---|---|---|
| Revenue | 238.2B | 264.0B | 276.7B | 309.0B | 359.1B |
| Cost of Revenue | 226.6B | 251.3B | 264.8B | 296.7B | 346.6B |
| Operating Expenses | 8.1B | 9.9B | 7.4B | 8.3B | 8.1B |
| Gross Profit | 11.6B | 12.6B | 11.9B | 12.2B | 12.5B |
| EBITDA | -3.6B | 3.1B | 5.7B | 4.7B | 5.3B |
| EBIT | -4.8B | 2.1B | 4.9B | 4.0B | 4.6B |
| Interest Expense | 217M | 178M | 248M | 243M | 256M |
| Net Income | -4.5B | 1.1B | 3.6B | 3.0B | 3.3B |
| EPS | -27.02 | 7.31 | 25.23 | 22.54 | 25.86 |
| Filing Date | 2021-05-12 | 2022-05-09 | 2023-05-09 | 2024-05-08 | 2025-05-09 |
Income Statement Evolution
From 2021 to 2025, McKesson Corporation’s revenue grew significantly by 50.72%, reaching $359B in 2025. Net income surged even more sharply by 172.59% over the same period, hitting $3.3B in 2025. Margins displayed mixed trends: gross margin remained neutral at 3.48%, EBIT margin at 1.29% was stable, while the net margin of 0.92% showed slight improvement overall despite a 5.56% decline in the last year.
Is the Income Statement Favorable?
The 2025 income statement reflects generally favorable fundamentals, supported by a 16.22% revenue increase and 14.46% EBIT growth year-over-year. Operating expenses grew proportionally with revenue, maintaining margin stability. However, the slight net margin contraction last year tempers optimism. Interest expense remains low and favorable at 0.07% of revenue, supporting earnings quality. Overall, the income statement presents positive momentum with manageable risks.
Financial Ratios
The table below presents key financial ratios for McKesson Corporation (MCK) over the last five fiscal years, illustrating profitability, valuation, liquidity, leverage, and efficiency metrics:
| Ratios | 2021 | 2022 | 2023 | 2024 | 2025 |
|---|---|---|---|---|---|
| Net Margin | -1.91% | 0.42% | 1.29% | 0.97% | 0.92% |
| ROE | 216.14% | -0.49% | -1.92% | -1.52% | -1.59% |
| ROIC | 13.72% | 11.46% | 22.92% | 21.22% | 23.30% |
| P/E | -6.90 | 41.85 | 14.11 | 23.80 | 26.02 |
| P/B | -1491.6 | -20.52 | -27.05 | -36.26 | -41.34 |
| Current Ratio | 1.03 | 0.95 | 0.92 | 0.92 | 0.90 |
| Quick Ratio | 0.59 | 0.57 | 0.51 | 0.51 | 0.53 |
| D/E | -447.86 | -3.32 | -3.93 | -3.75 | -3.56 |
| Debt-to-Assets | 14.47% | 11.92% | 11.71% | 10.96% | 9.83% |
| Interest Coverage | 16.18 | 15.30 | 17.96 | 16.16 | 17.08 |
| Asset Turnover | 3.66 | 4.17 | 4.44 | 4.58 | 4.78 |
| Fixed Asset Turnover | 50.89 | 72.52 | 72.59 | 76.38 | 83.81 |
| Dividend Yield | 0.88% | 0.59% | 0.58% | 0.44% | 0.40% |
Evolution of Financial Ratios
From 2021 to 2025, McKesson Corporation experienced a decline in Return on Equity (ROE), reaching -159% in 2025, signaling deteriorating profitability. The Current Ratio steadily decreased from above 1.0 in 2021 to 0.9 in 2025, indicating declining short-term liquidity. Meanwhile, the Debt-to-Equity Ratio remained negative, reflecting an unusual capital structure but with some stability in leverage levels over the period.
Are the Financial Ratios Fovorable?
In 2025, McKesson’s profitability ratios such as net margin (0.92%) and ROE (-159%) were unfavorable, while return on invested capital (23.3%) was favorable. Liquidity ratios, including a current ratio of 0.9 and quick ratio of 0.53, indicated weak short-term financial health. Leverage ratios like debt-to-equity (-3.56) and debt-to-assets (9.83%) were favorable, as were efficiency metrics like asset turnover (4.78) and fixed asset turnover (83.81). The overall ratio assessment was favorable, with 57% of key ratios positive.
Shareholder Return Policy
McKesson Corporation maintains a consistent dividend payout ratio around 10%, with dividends per share rising from $1.72 in 2021 to $2.71 in 2025, yielding roughly 0.4%. Dividend payments are well covered by free cash flow, indicating prudent distribution policies. The company also engages in share buybacks, complementing shareholder returns.
This balanced approach, combining moderate dividends and buybacks while ensuring coverage by operating cash flow, suggests a sustainable return policy. It supports long-term shareholder value without risking excessive distributions or compromising financial flexibility.
Score analysis
The following radar chart presents a comprehensive overview of McKesson Corporation’s key financial scores:
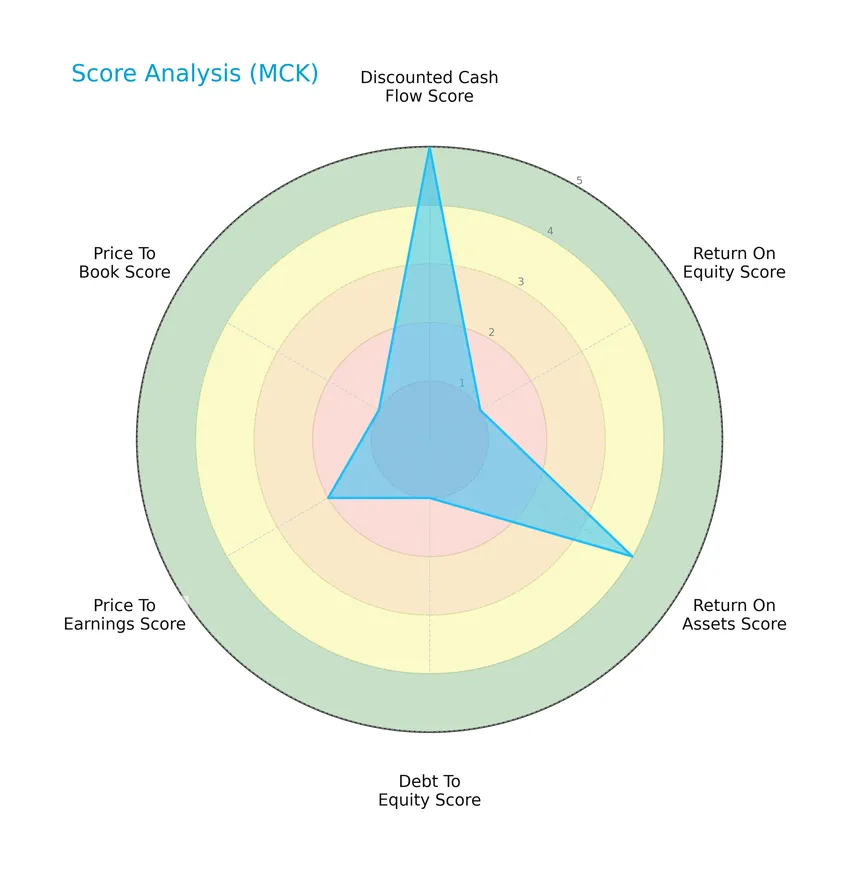
McKesson’s discounted cash flow score is very favorable at 5, while return on assets is favorable at 4. However, return on equity, debt to equity, and price to book scores are very unfavorable, indicating some financial challenges. The price to earnings score is moderate.
Analysis of the company’s bankruptcy risk
McKesson Corporation’s Altman Z-Score places it comfortably in the safe zone, indicating a low risk of bankruptcy:

Is the company in good financial health?
Here is the Piotroski Score diagram illustrating McKesson Corporation’s financial health assessment:

With a Piotroski Score of 7, McKesson demonstrates strong financial health, suggesting solid fundamentals and operational efficiency relative to investment criteria.
Competitive Landscape & Sector Positioning
This sector analysis will explore McKesson Corporation’s strategic positioning, revenue by segment, key products, main competitors, and competitive advantages. I will also evaluate whether McKesson holds a competitive advantage over its industry peers.
Strategic Positioning
McKesson Corporation maintains a diversified product portfolio across four segments: U.S. Pharmaceutical, International, Medical-Surgical Solutions, and Prescription Technology Solutions, with dominant revenue from U.S. pharmaceuticals at $328B in 2025. Geographically, it operates mainly in the U.S. and 13 European countries plus Canada.
Revenue by Segment
The pie chart illustrates McKesson Corporation’s revenue distribution by segment for the fiscal year 2025, highlighting the key business areas and their contributions.
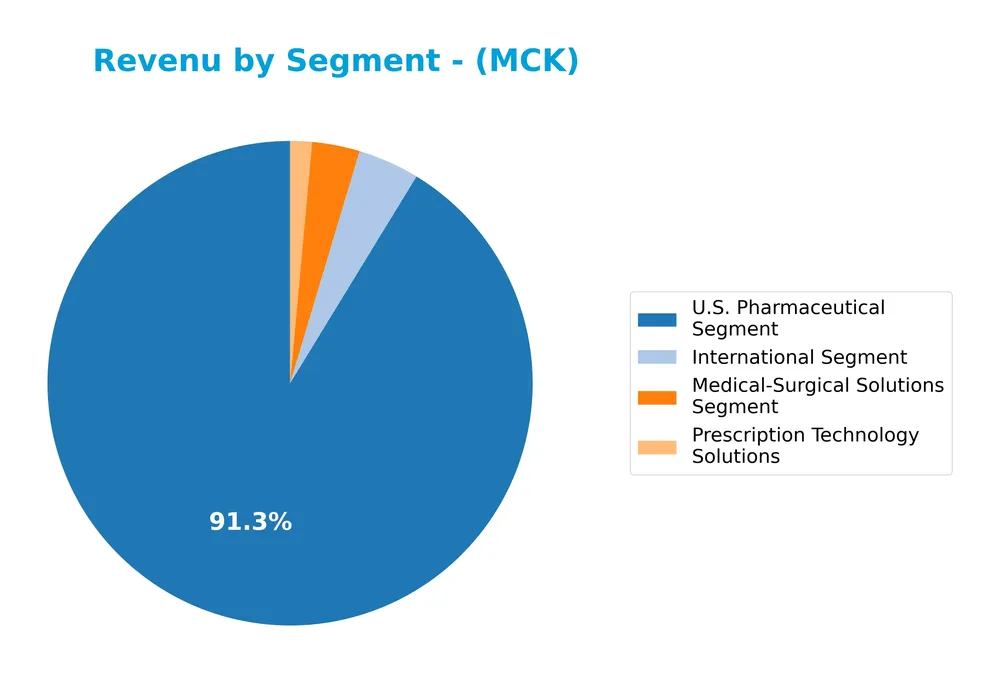
In 2025, McKesson’s revenue is heavily concentrated in the U.S. Pharmaceutical Segment, generating $328B and driving the bulk of the business. The International Segment and Medical-Surgical Solutions Segment contribute $14.7B and $11.4B respectively, showing stability with minor fluctuations. Prescription Technology Solutions, at $5.2B, continues to grow, reflecting gradual expansion. The overall trend indicates strong dominance of pharmaceutical distribution with growing technology integration.
Key Products & Brands
The table below summarizes McKesson Corporation’s key products and business segments as of fiscal year 2025:
| Product | Description |
|---|---|
| U.S. Pharmaceutical Segment | Distribution of branded, generic, specialty, biosimilar, and over-the-counter drugs; practice management, technology, and clinical support services; financial and operational solutions for pharmacies. |
| International Segment | Distribution and services to wholesale, institutional, and retail customers across 13 European countries and Canada. |
| Medical-Surgical Solutions Segment | Distribution, logistics, and related services for medical-surgical supplies to healthcare providers. |
| Prescription Technology Solutions (RxTS) | Solutions addressing medication challenges through access, adherence, third-party logistics, and wholesale distribution support for biopharma and life sciences partners. |
McKesson’s revenue streams are diversified across pharmaceutical distribution, international markets, medical-surgical supplies, and technology-driven prescription solutions, reflecting a broad healthcare services portfolio.
Main Competitors
There are 4 competitors in total, and the table below lists the top 10 leaders by market capitalization:
| Competitor | Market Cap. |
|---|---|
| McKesson Corporation | 103B |
| Cencora, Inc. | 66B |
| Cardinal Health, Inc. | 49B |
| Henry Schein, Inc. | 9.4B |
McKesson Corporation ranks 1st among its competitors with a market cap just below the top leader by 0.88%. It stands well above both the average market cap of the top 10 competitors (56.7B) and the median market cap in the sector (57.3B). The company holds a significant lead, with a 55.34% market cap gap to its closest rival below.
Comparisons with competitors
Check out how we compare the company to its competitors:
Does MCK have a competitive advantage?
McKesson Corporation demonstrates a durable competitive advantage, supported by a very favorable moat status with a ROIC significantly above its WACC and a positive ROIC growth trend. This indicates efficient capital use and consistent value creation.
Looking ahead, McKesson’s diverse segments including U.S. Pharmaceutical distribution, international operations, Medical-Surgical Solutions, and Prescription Technology Solutions position it well to capitalize on expanding healthcare markets and evolving technology-driven medication management opportunities.
SWOT Analysis
This SWOT analysis highlights McKesson Corporation’s key internal and external factors to guide informed investment decisions.
Strengths
- Large market cap of 102B USD
- Diverse global operations across US, Europe, Canada
- Strong value creation with ROIC well above WACC
Weaknesses
- Low net margin at 0.92%
- Negative return on equity at -158.87%
- Current and quick ratios below 1 indicating liquidity concerns
Opportunities
- Expanding international presence
- Growth in specialty and biosimilar pharmaceutical markets
- Increasing demand for integrated healthcare technology solutions
Threats
- Intense competition in pharmaceutical distribution
- Regulatory risks in multiple countries
- Economic uncertainty impacting healthcare spending
McKesson demonstrates a durable competitive advantage with solid growth and profitability trends despite some financial weaknesses. The company should leverage its global scale and innovative solutions while managing liquidity and regulatory risks carefully.
Stock Price Action Analysis
The weekly chart illustrates McKesson Corporation’s stock price movement over the past 12 months, highlighting key fluctuations and trend shifts:
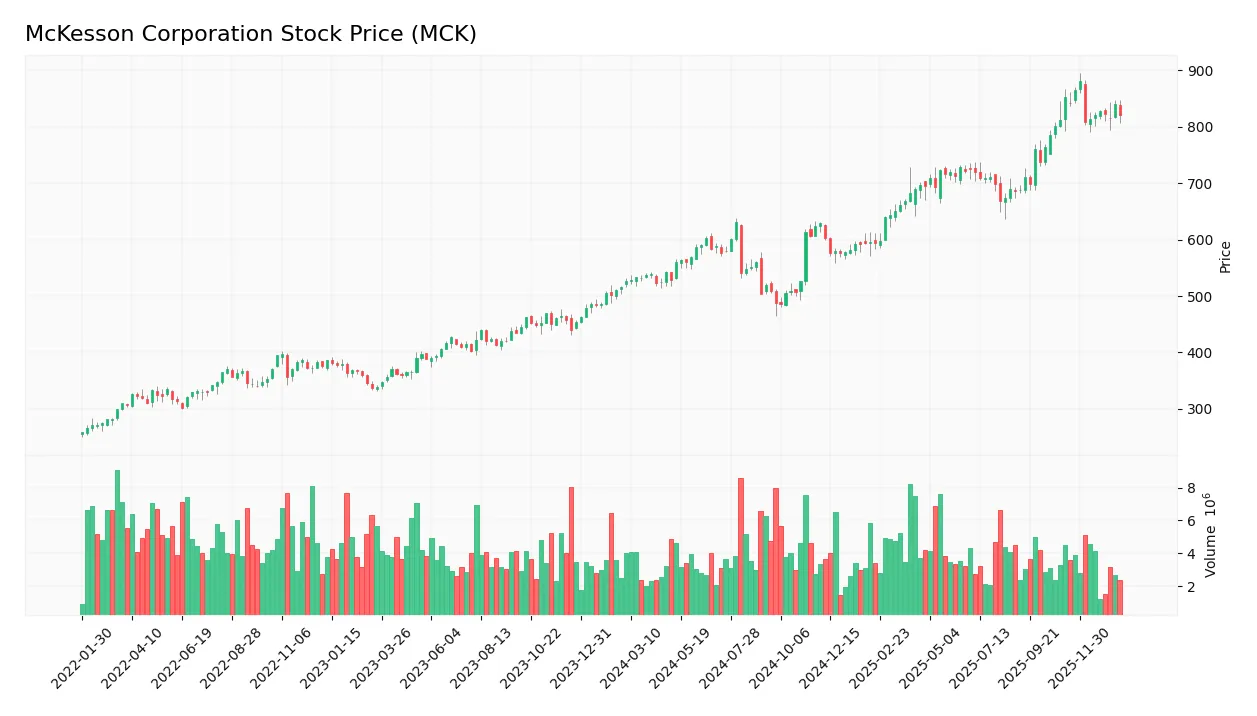
Trend Analysis
Over the past 12 months, MCK’s stock price increased by 55.97%, indicating a bullish trend overall. The price range was between 485.42 and 881.12, with a deceleration in upward momentum despite high volatility (std deviation 103.51). However, a recent 2.5-month period shows a -3.73% decline, reflecting a short-term bearish phase.
Volume Analysis
In the last three months, trading volumes have decreased, with buyers accounting for 60.12% of activity, maintaining buyer dominance. This decline in volume alongside buyer predominance suggests cautious market participation but persistent investor interest in accumulating shares.
Target Prices
The consensus target prices for McKesson Corporation indicate strong upside potential.
| Target High | Target Low | Consensus |
|---|---|---|
| 1000 | 772 | 920 |
Analysts expect McKesson’s stock price to range between 772 and 1000, with a consensus target near 920, reflecting positive market sentiment.

Don’t Let Luck Decide Your Entry Point
Optimize your entry points with our advanced ProRealTime indicators. You’ll get efficient buy signals with precise price targets for maximum performance. Start outperforming now!
Analyst & Consumer Opinions
This section reviews analyst ratings and consumer feedback to provide a balanced perspective on McKesson Corporation’s performance.
Stock Grades
Here is the latest summary of McKesson Corporation’s stock grades from recognized financial institutions:
| Grading Company | Action | New Grade | Date |
|---|---|---|---|
| Wells Fargo | Maintain | Equal Weight | 2025-11-10 |
| Morgan Stanley | Maintain | Overweight | 2025-11-06 |
| Baird | Maintain | Outperform | 2025-11-06 |
| UBS | Maintain | Buy | 2025-11-06 |
| UBS | Maintain | Buy | 2025-10-27 |
| Jefferies | Maintain | Buy | 2025-10-14 |
| JP Morgan | Maintain | Overweight | 2025-09-26 |
| TD Cowen | Maintain | Buy | 2025-09-24 |
| Evercore ISI Group | Maintain | Outperform | 2025-09-24 |
| Morgan Stanley | Maintain | Overweight | 2025-09-24 |
The consensus reflects a predominantly positive outlook with multiple buy and outperform ratings, while a few maintain equal weight, indicating steady investor confidence without significant downgrades.
Consumer Opinions
Consumers express mixed sentiments about McKesson Corporation, reflecting both appreciation for its service and concerns over certain operational issues.
| Positive Reviews | Negative Reviews |
|---|---|
| Efficient and timely delivery of orders | Customer service response times are slow |
| Wide range of pharmaceutical products | Occasional errors in order fulfillment |
| Competitive pricing and discounts | Website navigation can be confusing |
Overall, customers praise McKesson for its extensive product selection and competitive pricing but frequently note challenges with customer support and order accuracy. These insights suggest room for improvement in service quality.
Risk Analysis
Below is a summary table highlighting key risks associated with McKesson Corporation, focusing on their likelihood and potential impact:
| Category | Description | Probability | Impact |
|---|---|---|---|
| Financial Performance | Low net margin (0.92%) and negative return on equity (-158.87%) signal profitability risks. | High | High |
| Liquidity Risk | Current ratio (0.9) and quick ratio (0.53) below 1 indicate potential short-term liquidity issues. | Moderate | Moderate |
| Valuation Concerns | Unfavorable P/E (26.02) and negative P/B (-41.34) ratios suggest valuation uncertainty. | Moderate | Moderate |
| Debt Management | Favorable debt-to-assets (9.83%) and interest coverage (18.03) reduce financial distress risk. | Low | Low |
| Market Sensitivity | Low beta (0.409) implies limited stock volatility but also less responsiveness to market gains. | Low | Low |
The most significant risks are McKesson’s low profitability and weak equity returns, despite a strong Altman Z-Score indicating low bankruptcy risk. Investors should monitor liquidity ratios closely, as they reflect some strain in short-term financial health.
Should You Buy McKesson Corporation?
McKesson Corporation appears to be delivering robust value creation supported by a durable competitive moat with growing profitability, while maintaining a manageable leverage profile. Despite some unfavorable equity returns, its overall financial health could be seen as very favorable, reflected in a B- rating.
Strength & Efficiency Pillars
McKesson Corporation exhibits solid value creation, with a return on invested capital (ROIC) of 23.3% comfortably exceeding its weighted average cost of capital (WACC) at 5.58%, confirming it as a value creator. The company maintains a strong financial health profile, evidenced by a robust Altman Z-Score of 5.75, placing it securely in the safe zone, alongside a Piotroski score of 7, signaling strong operational fundamentals. Despite a modest net margin of 0.92%, McKesson’s favorable asset turnover (4.78) and interest coverage ratio (18.03) underscore efficient capital use and manageable debt servicing.
Weaknesses and Drawbacks
McKesson faces notable valuation and liquidity concerns that could temper investor enthusiasm. Its price-to-earnings ratio stands at 26.02, suggesting a relatively high market premium that may pressure future returns. The company’s liquidity ratios are below par, with a current ratio of 0.9 and a quick ratio of 0.53, indicating potential short-term solvency risks. While debt-to-equity is favorably negative at -3.56, the unfavorable return on equity (-158.87%) highlights profitability challenges that investors should monitor closely, especially given the recent net margin decline of -5.56%.
Our Verdict about McKesson Corporation
McKesson’s long-term fundamental profile appears favorable, driven by strong value creation and financial stability. The overall bullish stock trend, coupled with buyer dominance in the recent period, suggests sustained investor interest. However, the slight recent price decline calls for caution. Despite long-term strength, recent market deceleration might suggest a wait-and-see approach for a better entry point, as valuation and profitability risks persist.
Disclaimer: This content is for informational purposes only and does not constitute financial, investment, or other professional advice. Investing in financial markets involves a significant risk of loss, and past performance is not indicative of future results.
Additional Resources
- McKesson Corporation $MCK Shares Sold by Resona Asset Management Co. Ltd. – MarketBeat (Jan 24, 2026)
- McKesson Corporation (MCK) Is a Trending Stock: Facts to Know Before Betting on It – Yahoo Finance (Jan 21, 2026)
- McKesson Corp (NYSE:MCK) Demonstrates Strong Growth and Technical Breakout Potential – Chartmill (Jan 20, 2026)
- UniSuper Management Pty Ltd Boosts Position in McKesson Corporation $MCK – MarketBeat (Jan 24, 2026)
- McKesson’s CMS Cancer Data Role And What It May Mean For Valuation – Sahm (Jan 22, 2026)
For more information about McKesson Corporation, please visit the official website: mckesson.com