Home > Analyses > Consumer Cyclical > McDonald’s Corporation
McDonald’s transforms daily routines by serving millions with quick, consistent meals worldwide. It dominates the restaurant industry through its iconic menu, broad franchise network, and relentless innovation in convenience and digital ordering. Known for operational efficiency and brand strength, McDonald’s sets global standards in fast food. As market dynamics shift, I question whether its robust fundamentals still support its premium valuation and future growth prospects.

Table of contents
Business Model & Company Overview
McDonald’s Corporation, founded in 1940 and headquartered in Chicago, Illinois, commands a dominant position in the global restaurant industry. With over 40,000 restaurants worldwide, it offers a cohesive ecosystem of menu items ranging from classic hamburgers to breakfast sandwiches and beverages. This extensive footprint blends franchise operations with company-owned outlets, delivering consistent customer experiences across diverse markets.
The company’s revenue engine balances franchise fees, company-operated restaurant sales, and licensed locations across the Americas, Europe, and Asia. Recurring income from royalties and rent complements direct sales, creating a resilient cash flow model. McDonald’s economic moat lies in its brand strength and unparalleled global scale, shaping fast-food industry standards and consumer habits for decades.
Financial Performance & Fundamental Metrics
I will analyze McDonald’s Corporation’s income statement, key financial ratios, and dividend payout policy to assess its core financial health and shareholder value.
Income Statement
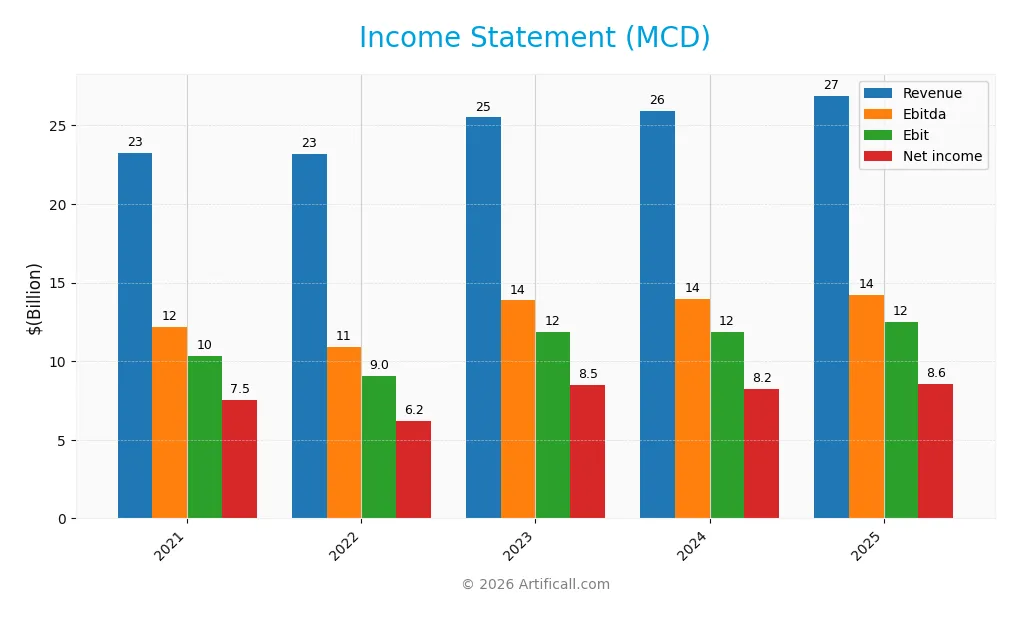
The table below summarizes McDonald’s Corporation’s key income statement figures for the fiscal years 2021 through 2025, reflecting revenue growth and profitability trends.
| 2021 | 2022 | 2023 | 2024 | 2025 | |
|---|---|---|---|---|---|
| Revenue | 23.2B | 23.2B | 25.5B | 25.9B | 26.9B |
| Cost of Revenue | 10.6B | 9.98B | 10.9B | 11.2B | 11.6B |
| Operating Expenses | 2.22B | 3.84B | 2.92B | 3.00B | 2.92B |
| Gross Profit | 12.6B | 13.2B | 14.6B | 14.7B | 15.3B |
| EBITDA | 12.2B | 10.9B | 13.9B | 13.9B | 14.2B |
| EBIT | 10.3B | 9.03B | 11.9B | 11.9B | 12.5B |
| Interest Expense | 1.19B | 1.21B | 1.36B | 1.51B | 1.58B |
| Net Income | 7.55B | 6.18B | 8.47B | 8.22B | 8.56B |
| EPS | 10.11 | 8.39 | 11.63 | 11.45 | 11.99 |
| Filing Date | 2022-02-24 | 2023-02-24 | 2024-02-22 | 2025-02-25 | 2026-02-24 |
Income Statement Evolution
From 2021 to 2025, McDonald’s revenue grew steadily by 15.8%, reflecting consistent demand. Net income increased 13.5%, though net margin contracted slightly by 2%. Gross margin remained solid near 57%, while EBIT margin improved to 46.4%, signaling efficient cost control. Operating expenses grew slower than revenue, supporting margin stability and profitability.
Is the Income Statement Favorable?
In 2025, McDonald’s reported $26.9B revenue and $8.56B net income, with net margin at a healthy 31.9%. EBIT margin stood at 46.4%, underlining strong operating performance. Interest expense consumed 5.9% of revenue, a neutral factor. Overall, fundamentals appear favorable, supported by margin expansion and steady profitability amid moderate revenue growth.
Financial Ratios
The following table summarizes key financial ratios for McDonald’s Corporation over the past five fiscal years, illustrating profitability, liquidity, leverage, efficiency, and dividend metrics:
| Ratios | 2021 | 2022 | 2023 | 2024 | 2025 |
|---|---|---|---|---|---|
| Net Margin | 32% | 27% | 33% | 32% | 32% |
| ROE | -1.6% | -1.0% | -1.8% | -2.2% | -4.8% |
| ROIC | 17% | 16% | 18% | 18% | 18% |
| P/E | 26.5 | 31.4 | 25.5 | 25.3 | 25.5 |
| P/B | -43.5 | -32.3 | -45.9 | -54.9 | -121.9 |
| Current Ratio | 1.78 | 1.43 | 1.16 | 1.19 | 0.95 |
| Quick Ratio | 1.76 | 1.41 | 1.16 | 1.18 | 0.95 |
| D/E | -10.7 | -8.1 | -11.3 | -13.7 | -38.1 |
| Debt-to-Assets | 92% | 97% | 95% | 94% | 115% |
| Interest Coverage | 8.7 | 7.8 | 8.6 | 7.8 | 7.8 |
| Asset Turnover | 0.43 | 0.46 | 0.45 | 0.47 | 0.45 |
| Fixed Asset Turnover | 0.61 | 0.64 | 0.66 | 0.67 | 0.63 |
| Dividend Yield | 2.0% | 2.1% | 2.1% | 2.3% | 2.3% |
Evolution of Financial Ratios
McDonald’s ROE deteriorated sharply in 2025, turning deeply negative, despite stable and strong net profit margins around 32%. The current ratio declined from above 1.4 to below 1, signaling weaker short-term liquidity. Debt-to-equity ratio remained negative, reflecting unusual capital structure dynamics but indicating leverage stability over the period. Profitability margins showed resilience amid these shifts.
Are the Financial Ratios Favorable?
In 2025, McDonald’s profitability remains robust with a net margin at 31.85%, and ROIC of 17.66% well above the WACC of 5.37%, signaling value creation. Liquidity ratios are mixed; the current ratio is below 1, a red flag, while the quick ratio is neutral. Leverage metrics are complex, with a highly negative debt-to-equity but favorable interest coverage. Asset turnover ratios lag, and market valuation (P/E) is unfavorable. Overall, the ratios are slightly favorable.
Shareholder Return Policy
McDonald’s maintains a dividend payout ratio near 60%, with consistent dividend per share growth reaching 7.16 in 2025. The annual dividend yield stands around 2.34%, supported by substantial free cash flow coverage and ongoing share buyback programs.
This distribution strategy balances returning capital to shareholders with sustainable cash flow management. It reflects a prudent approach that supports long-term shareholder value, avoiding excessive repurchases or unsustainable dividends amid varying market conditions.
Score analysis
The following radar chart summarizes key valuation and financial health metrics for McDonald’s Corporation:
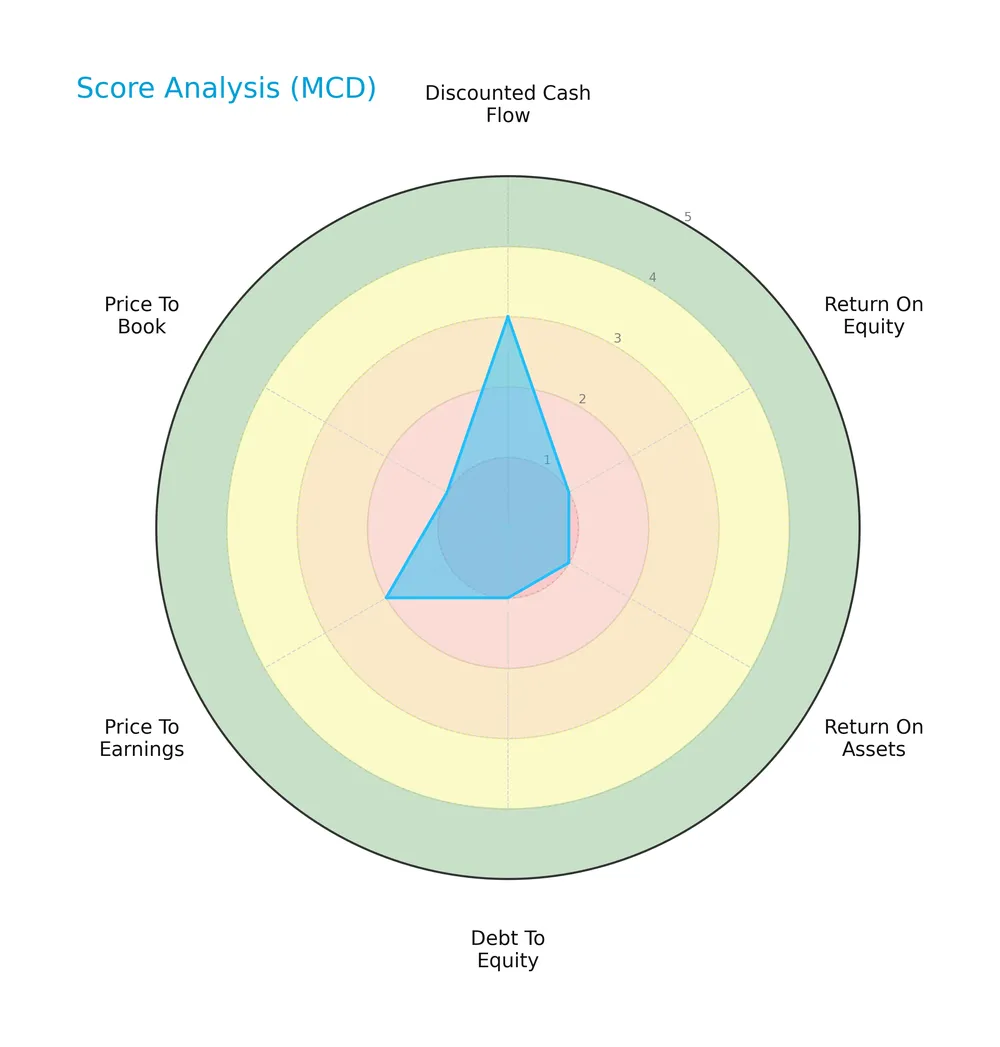
McDonald’s shows mixed scores: a moderate discounted cash flow score of 3, very favorable return on assets at 5, but very unfavorable return on equity, debt to equity, and price to book scores, indicating uneven financial efficiency and valuation challenges.
Analysis of the company’s bankruptcy risk
McDonald’s Altman Z-Score places it comfortably in the safe zone, indicating low bankruptcy risk based on current financial metrics:

Is the company in good financial health?
This Piotroski diagram highlights McDonald’s average financial health status based on nine key accounting criteria:

With a Piotroski Score of 5, McDonald’s shows moderate financial strength, suggesting neither strong nor weak financial fundamentals at this time.
Competitive Landscape & Sector Positioning
This section examines McDonald’s strategic positioning within the consumer cyclical sector and its revenue breakdown by segment. I will analyze key products, main competitors, and competitive advantages of the company. The goal is to determine whether McDonald’s holds a sustainable competitive advantage over its peers.
Strategic Positioning
McDonald’s focuses on a geographically diversified portfolio, generating $13.6B from International Operated Markets, $10.8B from the U.S., and $2.4B from licensed international markets in 2025. Its product offering centers on fast-food staples across global markets, maintaining balance between developed and high-growth regions.
Revenue by Segment
This pie chart illustrates McDonald’s revenue distribution across key segments for the fiscal year 2025, highlighting contributions from the United States, High-Growth Markets, and International Developmental Licensed Markets.
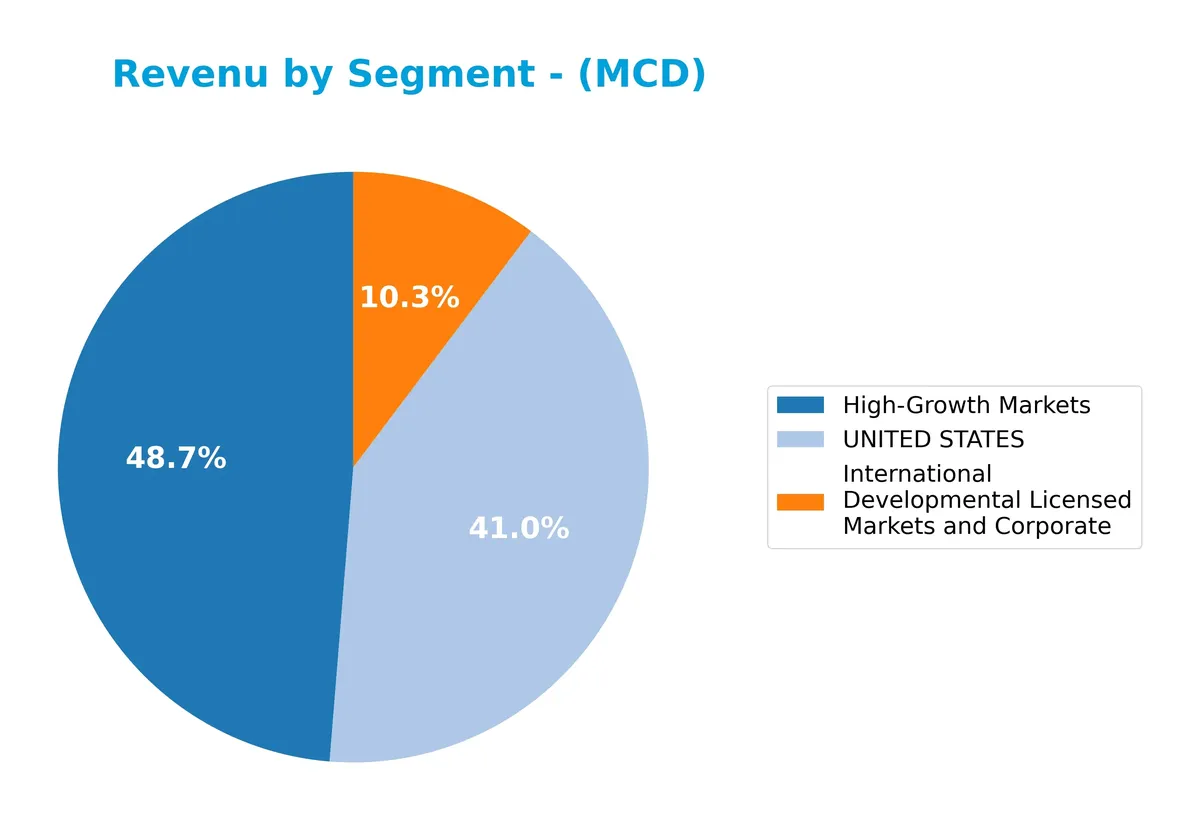
In 2025, High-Growth Markets lead with $13.6B, followed by the United States at $10.8B, and International Developmental Licensed Markets at $2.4B. I observe steady growth in the U.S. and High-Growth sectors, with the latter showing notable expansion. The slight dip in the International segment suggests emerging pressures, but the overall business remains concentrated in these three core areas with balanced momentum.
Key Products & Brands
The table below details McDonald’s key products and brands along with their descriptions:
| Product | Description |
|---|---|
| Hamburgers and Cheeseburgers | Classic McDonald’s sandwiches featuring beef patties with cheese, a core menu staple worldwide. |
| Chicken Sandwiches and Nuggets | Breaded and seasoned chicken offerings including sandwiches and bite-sized nuggets. |
| Wraps and Salads | Health-conscious options including various wraps and fresh salads. |
| Fries and Bakery Items | Signature French fries and a variety of bakery goods like muffins and cookies. |
| Breakfast Menu | Includes biscuit and bagel sandwiches, breakfast burritos, and hotcakes served during morning hours. |
| Desserts and Beverages | Shakes, sundaes, soft serve cones, coffee, soft drinks, and other beverages complement the food menu. |
| International Developmental Licensed Markets and Corporate | Revenue segment representing restaurants in licensed and corporate markets outside the U.S. |
| High-Growth Markets | Revenue from emerging and rapidly expanding international markets. |
| United States | Revenue from McDonald’s restaurants operating within the United States. |
McDonald’s product range spans traditional fast-food staples and evolving global tastes. Its revenue is segmented geographically, with significant contributions from the U.S., high-growth international markets, and licensed operations. This diversified portfolio supports its global footprint.
Main Competitors
There are 6 main competitors in the Restaurants industry; the table lists the top 10 leaders by market capitalization:
| Competitor | Market Cap. |
|---|---|
| McDonald’s Corporation | 217B |
| Starbucks Corporation | 95.5B |
| Chipotle Mexican Grill, Inc. | 50.6B |
| Yum! Brands, Inc. | 41.8B |
| Darden Restaurants, Inc. | 21.8B |
| Domino’s Pizza, Inc. | 14.4B |
McDonald’s ranks 1st among its competitors, with a market cap 10% above the next largest player. It stands well above both the average market cap of the top 10 competitors (73.5B) and the sector median (46.2B). The company holds a substantial lead, with no competitor above it, emphasizing its dominance in the sector.
Comparisons with competitors
Check out how we compare the company to its competitors:
Does McDonald’s have a competitive advantage?
McDonald’s demonstrates a very favorable competitive advantage, consistently creating value with an ROIC exceeding WACC by 12.3%. Its growing ROIC trend signals increasing profitability and efficient capital use.
Looking ahead, McDonald’s opportunities lie in expanding international operated markets and developmental licensed areas. Continued menu innovation and global footprint growth could further strengthen its market position.
SWOT Analysis
This SWOT analysis highlights McDonald’s key strategic factors influencing its market position and future growth.
Strengths
- strong global brand
- high gross margin at 57%
- sustainable competitive advantage with growing ROIC
Weaknesses
- unfavorable return on equity at -478%
- low current ratio at 0.95 indicates liquidity risk
- high debt to assets at 115%
Opportunities
- expanding international operated markets
- digital innovation in delivery and ordering
- growing demand for convenience foods
Threats
- intense competition in fast food sector
- changing consumer preferences towards healthier options
- economic downturns impacting discretionary spending
McDonald’s exhibits robust profitability and moat but faces liquidity and leverage concerns. Strategic focus should balance expansion with risk mitigation in operational efficiency and financial structure.
Stock Price Action Analysis
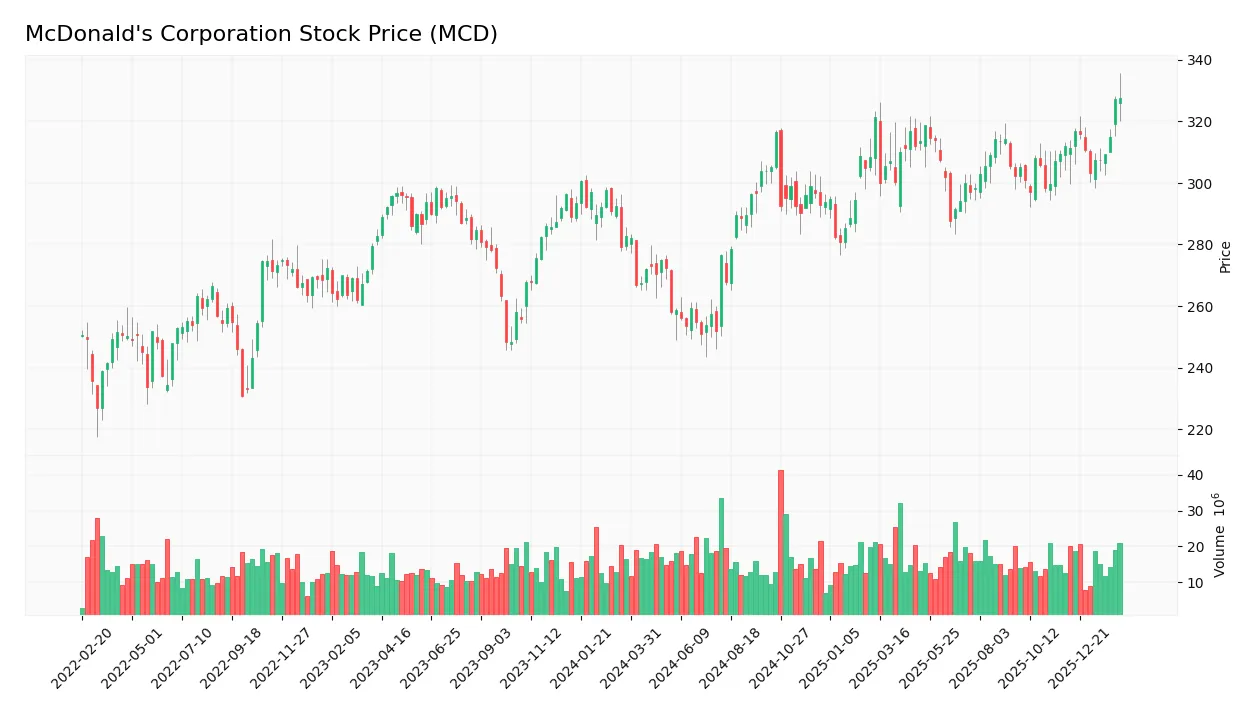
The weekly stock chart below illustrates McDonald’s price movement over the past 100 weeks, highlighting key highs, lows, and overall volatility:
Trend Analysis
Over the past 100 weeks, McDonald’s stock price rose 24.77%, indicating a bullish trend with accelerating momentum. The price ranged between 251.09 and 332.75, showing healthy volatility with a 19.19 standard deviation. Recent months confirm continued positive direction with a 5.06% gain and moderate slope.
Volume Analysis
Trading volume shows a decreasing trend despite strong buyer dominance at 59.47% overall and 78.77% recently. Buyer-driven activity suggests sustained investor interest, but waning volume may signal caution or a pause in participation ahead.
Target Prices
Analysts project a target price consensus that reflects confidence in McDonald’s growth prospects.
| Target Low | Target High | Consensus |
|---|---|---|
| 320 | 380 | 349.69 |
The target range suggests moderate upside potential, with analysts expecting steady performance supported by McDonald’s strong market position.

Don’t Let Luck Decide Your Entry Point
Optimize your entry points with our advanced ProRealTime indicators. You’ll get efficient buy signals with precise price targets for maximum performance. Start outperforming now!
Analyst & Consumer Opinions
This section explores the latest analyst grades and consumer feedback regarding McDonald’s Corporation (MCD).
Stock Grades
Here are the latest verified grades from established financial firms for McDonald’s Corporation:
| Grading Company | Action | New Grade | Date |
|---|---|---|---|
| Guggenheim | Maintain | Neutral | 2026-02-13 |
| Argus Research | Upgrade | Buy | 2026-02-13 |
| Citigroup | Maintain | Buy | 2026-02-12 |
| Jefferies | Maintain | Buy | 2026-02-12 |
| RBC Capital | Maintain | Sector Perform | 2026-02-12 |
| UBS | Maintain | Buy | 2026-02-12 |
| Piper Sandler | Maintain | Neutral | 2026-02-12 |
| TD Cowen | Maintain | Hold | 2026-02-12 |
| Barclays | Maintain | Overweight | 2026-02-12 |
| BTIG | Maintain | Buy | 2026-02-12 |
Most analysts maintain a positive stance, with a strong tilt toward Buy ratings. Neutral and Hold grades signal some caution, but upgrades remain limited to one firm.
Consumer Opinions
McDonald’s continues to evoke strong opinions, reflecting its global footprint and consistent brand presence.
| Positive Reviews | Negative Reviews |
|---|---|
| “Fast service and consistent taste.” | “Quality has declined in some locations.” |
| “Great value for money, especially combos.” | “Long wait times during peak hours.” |
| “Friendly staff and clean environment.” | “Limited healthy options on the menu.” |
Overall, consumers praise McDonald’s for speed, affordability, and staff friendliness. However, complaints about quality variability and menu healthiness persist, signaling areas for improvement.
Risk Analysis
Below is a concise overview of McDonald’s key risks, categorized by probability and impact:
| Category | Description | Probability | Impact |
|---|---|---|---|
| Financial Leverage | Debt to assets ratio exceeds 114%, indicating high leverage. | High | High |
| Liquidity | Current ratio below 1.0 signals potential short-term stress. | Medium | Medium |
| Valuation | Elevated P/E of 25.49 raises concerns of overvaluation. | Medium | Medium |
| Profitability | Negative ROE (-478%) suggests inefficient equity use. | Low | High |
| Operational Efficiency | Low asset turnover (0.45) limits revenue generation capacity. | Medium | Medium |
| Market Volatility | Beta of 0.53 indicates lower sensitivity to market swings. | Low | Low |
McDonald’s stands in the safe zone per Altman Z-score (3.48), showing solid bankruptcy resistance. However, its excessive leverage and weak ROE are red flags. Historically, in the consumer cyclical sector, high debt combined with low equity returns can constrain growth during economic downturns. Prudence dictates monitoring debt levels closely.
Should You Buy McDonald’s Corporation?
McDonald’s appears to be a robust value creator with a durable competitive moat supported by a growing ROIC well above WACC. Despite significant leverage and mixed profitability signals, its overall rating of C+ suggests cautious optimism amid operational efficiency challenges.
Strength & Efficiency Pillars
McDonald’s Corporation delivers robust operational efficiency, evidenced by a strong net margin of 31.85% and an EBIT margin of 46.39%. The company’s return on invested capital (ROIC) stands at 17.66%, comfortably above its WACC of 5.37%, confirming it as a clear value creator. Despite a negative return on equity of -478.11%, the firm’s growing ROIC trend and high gross margin of 56.95% underscore sustainable competitive advantages and effective capital deployment.
Weaknesses and Drawbacks
McDonald’s faces valuation and liquidity challenges, with a price-to-earnings ratio of 25.49 signaling a moderate premium valuation. The current ratio at 0.95 flags potential short-term liquidity constraints, raising caution about its ability to cover near-term obligations. Although debt-to-equity is negative at -38.12, an unusually high debt-to-assets ratio of 114.71% signals significant leverage risk. These factors could pressure the stock if market sentiment shifts or economic conditions tighten.
Our Final Verdict about McDonald’s Corporation
McDonald’s presents a fundamentally strong profile with clear value creation and a bullish long-term trend. The recent period shows strongly buyer-dominant behavior, suggesting continued market confidence. This combination may appear attractive for long-term exposure, although investors should monitor the liquidity and leverage risks closely before committing capital.
Disclaimer: This content is for informational purposes only and does not constitute financial, investment, or other professional advice. Investing in financial markets involves a significant risk of loss, and past performance is not indicative of future results.
Additional Resources
- MCDONALD’S CORPORATION (MCD) – MSN (Feb 24, 2026)
- McDonald’s Corporation (MCD) is Attracting Investor Attention: Here is What You Should Know – Yahoo Finance (Feb 19, 2026)
- James D. Farley, Jr. Elected to McDonald’s Board of Directors – McDonald’s Corporation (Feb 10, 2026)
- McDonald’s | History, Ray Kroc, & Famous Menu Items | Britannica Money – Britannica (Feb 09, 2026)
- CosMc’s afterlife: McDonald’s secret weapon to take on Starbucks and Dutch Bros (MCD:NYSE) – Seeking Alpha (Feb 21, 2026)
For more information about McDonald’s Corporation, please visit the official website: corporate.mcdonalds.com