Home > Analyses > Consumer Defensive > McCormick & Company, Incorporated
McCormick & Company spices up kitchens and food industries worldwide, delivering flavors that shape how people experience meals every day. As a dominant player in the packaged foods sector, McCormick boasts a diverse portfolio including iconic brands like French’s, Frank’s RedHot, and Old Bay, known for innovation and consistent quality. With a strong global presence and a history of adapting to evolving tastes, I explore whether McCormick’s solid fundamentals continue to justify its market valuation and growth prospects in 2026.

Table of contents
Business Model & Company Overview
McCormick & Company, Incorporated, founded in 1889 and headquartered in Hunt Valley, Maryland, stands as a dominant player in the packaged foods industry. Its integrated ecosystem centers on manufacturing, marketing, and distributing spices, seasoning mixes, condiments, and flavor solutions. McCormick’s brand portfolio spans globally recognized names like French’s and Frank’s RedHot in the Americas, Ducros in Europe, and McCormick in China and Australia, creating a cohesive mission to enhance culinary experiences worldwide.
The company’s revenue engine balances Consumer products—spices, herbs, sauces—and Flavor Solutions for multinational food manufacturers and foodservice clients. This dual-segment approach fuels steady cash flow across retail and industrial channels. Operating extensively in the Americas, Europe, Asia, and beyond, McCormick leverages its broad geographic footprint to maintain resilient growth. Its economic moat is anchored in trusted brands and global supply chain expertise, shaping the future of flavor innovation.
Financial Performance & Fundamental Metrics
In this section, I analyze McCormick & Company’s income statement, key financial ratios, and dividend payout policy to assess its financial health and investment potential.
Income Statement
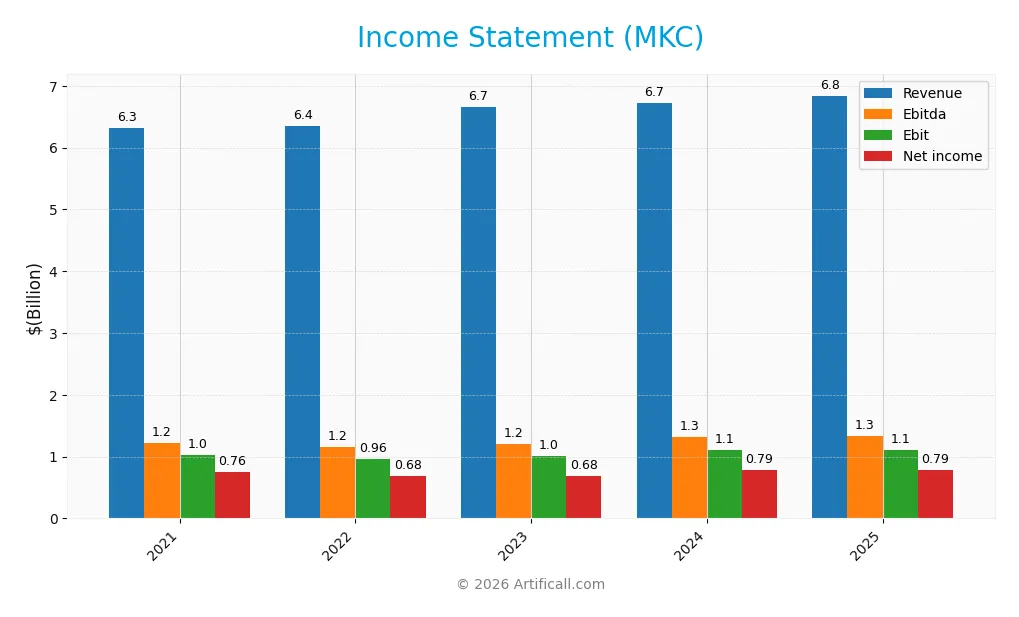
The table below summarizes McCormick & Company, Incorporated’s key income statement figures for fiscal years 2021 through 2025, reported in USD.
| 2021 | 2022 | 2023 | 2024 | 2025 | |
|---|---|---|---|---|---|
| Revenue | 6.32B | 6.35B | 6.66B | 6.72B | 6.84B |
| Cost of Revenue | 3.82B | 4.08B | 4.16B | 4.13B | 4.25B |
| Operating Expenses | 1.48B | 1.41B | 1.54B | 1.53B | 1.50B |
| Gross Profit | 2.49B | 2.27B | 2.50B | 2.59B | 2.59B |
| EBITDA | 1.22B | 1.16B | 1.21B | 1.32B | 1.34B |
| EBIT | 1.03B | 0.96B | 1.01B | 1.11B | 1.11B |
| Interest Expense | 137M | 149M | 208M | 209M | 196M |
| Net Income | 755M | 682M | 681M | 789M | 789M |
| EPS | 2.83 | 2.54 | 2.54 | 2.94 | 2.94 |
| Filing Date | 2022-01-27 | 2023-01-26 | 2024-01-25 | 2025-01-23 | 2026-01-22 |
Income Statement Evolution
From 2021 to 2025, McCormick & Company experienced steady revenue growth, rising 8.27% overall but slowing to 1.73% in the last year. Gross profit remained mostly stable with marginal growth, while net income increased moderately by 4.51%. Margins showed mixed trends: the net margin declined by 3.47% over the period, despite a slight rise in earnings per share (EPS) of 4.64%.
Is the Income Statement Favorable?
In 2025, McCormick reported revenue of $6.84B and net income of $789M, yielding a net margin of 11.54%, which is considered favorable. Operating efficiency is reflected in a healthy gross margin of 37.9% and an EBIT margin of 16.22%. Interest expenses remain well-controlled at 2.87% of revenue. Although revenue growth slowed and net margin slightly contracted last year, the overall fundamentals of the income statement are assessed as favorable.
Financial Ratios
The following table presents key financial ratios for McCormick & Company, Incorporated (MKC) over the last five fiscal years, offering insight into profitability, liquidity, leverage, and market valuation:
| Ratios | 2021 | 2022 | 2023 | 2024 | 2025 |
|---|---|---|---|---|---|
| Net Margin | 12.0% | 10.7% | 10.2% | 11.7% | 11.5% |
| ROE | 17.1% | 14.6% | 13.4% | 14.9% | 13.8% |
| ROIC | 7.4% | 6.2% | 7.1% | 7.9% | 7.9% |
| P/E | 30.4 | 33.5 | 25.6 | 26.7 | 0 |
| P/B | 5.20 | 4.88 | 3.44 | 3.98 | 0 |
| Current Ratio | 0.68 | 0.70 | 0.65 | 0.74 | 0.70 |
| Quick Ratio | 0.31 | 0.30 | 0.28 | 0.31 | 0.28 |
| D/E | 1.22 | 1.14 | 0.91 | 0.85 | 0.70 |
| Debt-to-Assets | 41.8% | 35.7% | 35.7% | 34.5% | 30.3% |
| Interest Coverage | 7.4 | 5.8 | 4.6 | 5.1 | 5.6 |
| Asset Turnover | 0.49 | 0.48 | 0.52 | 0.51 | 0.52 |
| Fixed Asset Turnover | 4.95 | 4.48 | 4.31 | 4.14 | 4.72 |
| Dividend Yield | 1.58% | 1.74% | 2.41% | 2.14% | 0% |
Evolution of Financial Ratios
Over the recent years, McCormick & Company’s Return on Equity (ROE) showed a slight decline from 17.12% in 2021 to 13.76% in 2025, indicating moderated profitability. The Current Ratio remained consistently below 1, fluctuating around 0.7, highlighting tight short-term liquidity. The Debt-to-Equity Ratio improved modestly, decreasing from 1.22 in 2021 to 0.7 in 2025, reflecting a gradual reduction in leverage.
Are the Financial Ratios Favorable?
In 2025, McCormick’s profitability ratios such as net margin (11.54%) and interest coverage (5.65) were favorable, indicating solid earnings and debt servicing ability. However, liquidity ratios like the current ratio (0.7) and quick ratio (0.28) were unfavorable, suggesting limited short-term asset coverage. Leverage ratios were neutral, with debt-to-equity at 0.7. Overall, 42.86% of ratios were favorable, 35.71% neutral, and 21.43% unfavorable, leading to a slightly favorable financial profile.
Shareholder Return Policy
McCormick & Company pays dividends with a payout ratio around 48-61% over recent years and a dividend yield near 1.6-2.4%. Dividend payments are covered by free cash flow, and the company maintains a dividend paid and capex coverage ratio above 1, indicating prudent cash management.
There is no explicit data on share buybacks. The stable payout ratio and dividend coverage suggest a balanced policy supporting sustainable long-term shareholder value, avoiding risks of excessive distributions or unsustainable repurchases.
Score analysis
The following radar chart presents a comprehensive overview of McCormick & Company, Incorporated’s key financial scores:
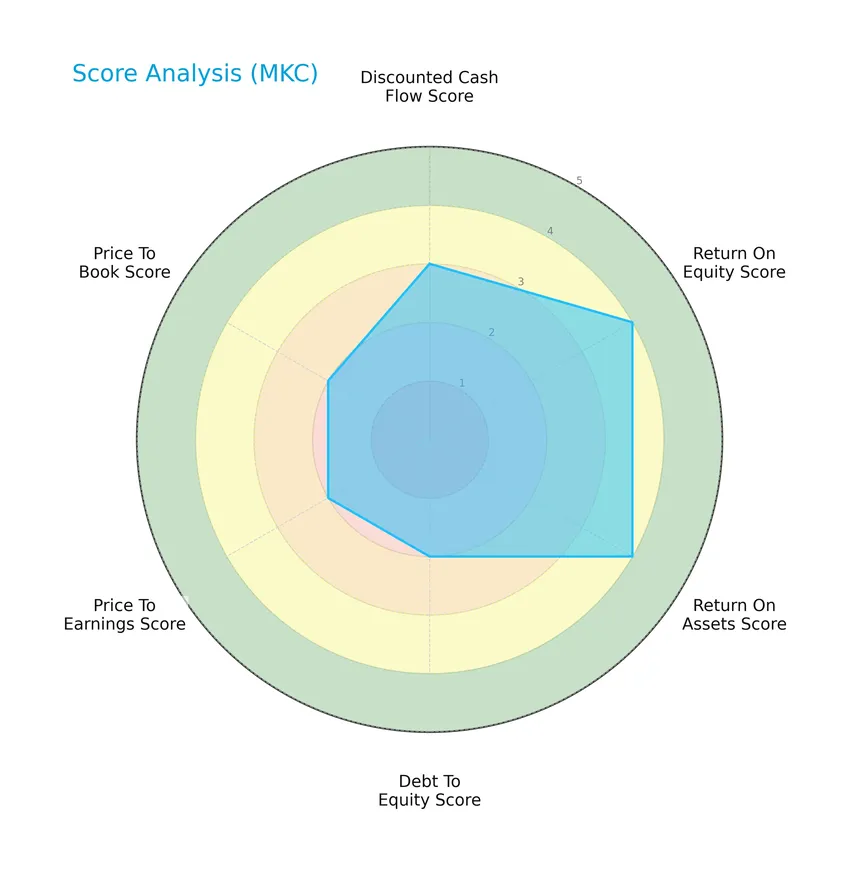
The discounted cash flow score is moderate at 3, while return on equity and return on assets show favorable scores of 4 each. Debt to equity, price to earnings, and price to book ratios all reflect moderate scores of 2, indicating balanced but cautious financial metrics.
Analysis of the company’s bankruptcy risk
McCormick & Company, Incorporated’s Altman Z-Score falls in the grey zone at approximately 2.44, suggesting a moderate risk of bankruptcy that warrants attention:

Is the company in good financial health?
The Piotroski Score diagram illustrates the company’s overall financial health status:

With a Piotroski Score of 6, McCormick & Company shows average financial strength. This indicates reasonable operational efficiency and profitability, though not at the highest levels of financial robustness.
Competitive Landscape & Sector Positioning
This sector analysis will examine McCormick & Company, Incorporated’s strategic positioning, revenue by segment, key products, main competitors, and competitive advantages. I will also assess whether McCormick holds a competitive advantage over its industry peers.
Strategic Positioning
McCormick & Company maintains a diversified product portfolio across two main segments: Consumer ($3.95B in 2025) and Flavor Solutions ($2.89B), with broad geographic exposure primarily in the Americas ($4.87B), Europe, Middle East, Africa ($1.27B), and Asia Pacific ($704M).
Revenue by Segment
This pie chart displays McCormick & Company, Incorporated’s revenue distribution by segment for the fiscal year 2025.
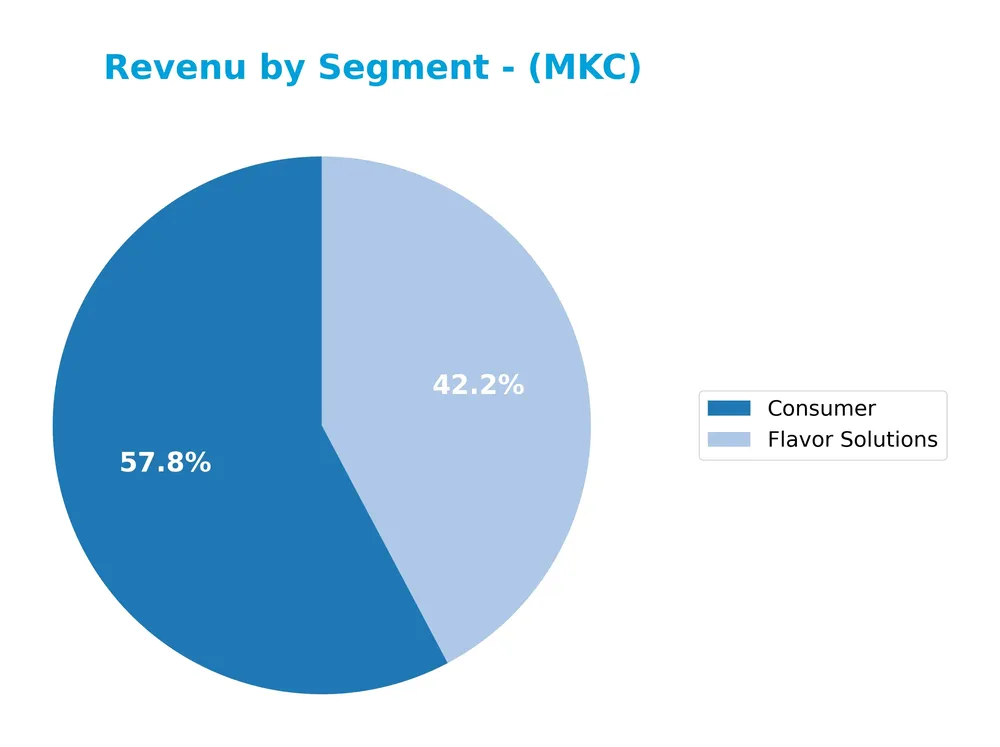
In 2025, the Consumer segment led revenue generation at $3.95B, showing steady growth over recent years. Flavor Solutions contributed $2.89B, also increasing consistently but at a slower pace. The business remains concentrated in these two segments, with Consumer maintaining a slight dominance. The steady expansion in both sectors reflects balanced growth without signs of concentration risk or volatility in the latest fiscal year.
Key Products & Brands
The table below presents McCormick & Company’s principal products and brand portfolios offered across its operating segments:
| Product | Description |
|---|---|
| Consumer Segment | Offers spices, herbs, seasonings, condiments, sauces, and desserts marketed under brands including McCormick, French’s, Frank’s RedHot, Lawry’s, Cholula Hot Sauce, Gourmet Garden, Club House, OLD BAY (Americas); Ducros, Schwartz, Kamis, Drogheria & Alimentari, Vahiné (EMEA); McCormick, DaQiao (China); McCormick, Aeroplane, Gourmet Garden (Australia); plus regional brands like Zatarain’s, Stubb’s, Thai Kitchen, Simply Asia, and private label products. |
| Flavor Solutions Segment | Supplies seasoning blends, spices, herbs, condiments, coating systems, and compound flavors to multinational food manufacturers and foodservice customers, distributed directly and through distributors. |
McCormick’s product offering spans a wide variety of spices, seasonings, and condiments marketed globally under both well-known and regional brands, addressing retail consumers and large-scale food manufacturers.
Main Competitors
There are 11 competitors in the Consumer Defensive sector of Packaged Foods; below are the top 10 leaders by market capitalization:
| Competitor | Market Cap. |
|---|---|
| JBS N.V. | 32B |
| The Kraft Heinz Company | 29B |
| General Mills, Inc. | 25B |
| McCormick & Company, Incorporated | 18B |
| Hormel Foods Corporation | 13B |
| The J. M. Smucker Company | 10B |
| The Magnum Ice Cream Company N.V. | 9.7B |
| Pilgrim’s Pride Corporation | 9.3B |
| Conagra Brands, Inc. | 8.3B |
| Campbell Soup Company | 8.3B |
McCormick & Company ranks 4th among its competitors with a market cap slightly above 18B, representing about 51% of the leader’s valuation. It stands above both the average market cap of the top 10 competitors (16.2B) and the sector median (10.3B). The company enjoys a significant 52.57% market cap advantage over its nearest competitor above, reflecting a strong mid-tier positioning within the sector.
Comparisons with competitors
Check out how we compare the company to its competitors:
Does MKC have a competitive advantage?
McCormick & Company, Incorporated does not currently demonstrate a strong competitive advantage, as its return on invested capital (ROIC) remains below its weighted average cost of capital (WACC), indicating value is being shed. However, the company shows a growing ROIC trend, signaling improving profitability over the 2021-2025 period.
Looking ahead, McCormick’s diverse geographic presence across the Americas, Europe, Middle East, Africa, and Asia Pacific, combined with its extensive brand portfolio, may offer opportunities to expand market share. Continued innovation in seasoning products and flavor solutions could support future growth in both consumer and foodservice segments.
SWOT Analysis
This SWOT analysis highlights McCormick & Company’s key internal and external factors to guide investment decisions.
Strengths
- strong brand portfolio
- favorable gross and net margins
- diversified global presence
Weaknesses
- low liquidity ratios
- declining net margin growth
- moderate debt levels
Opportunities
- expanding in emerging markets
- growing demand for flavor solutions
- innovation in health-conscious products
Threats
- intense competition
- raw material price volatility
- regulatory challenges
Overall, McCormick shows solid profitability and brand strength but faces margin pressure and liquidity concerns. Strategic focus on innovation and geographic expansion is essential to mitigate competitive and supply risks.
Stock Price Action Analysis
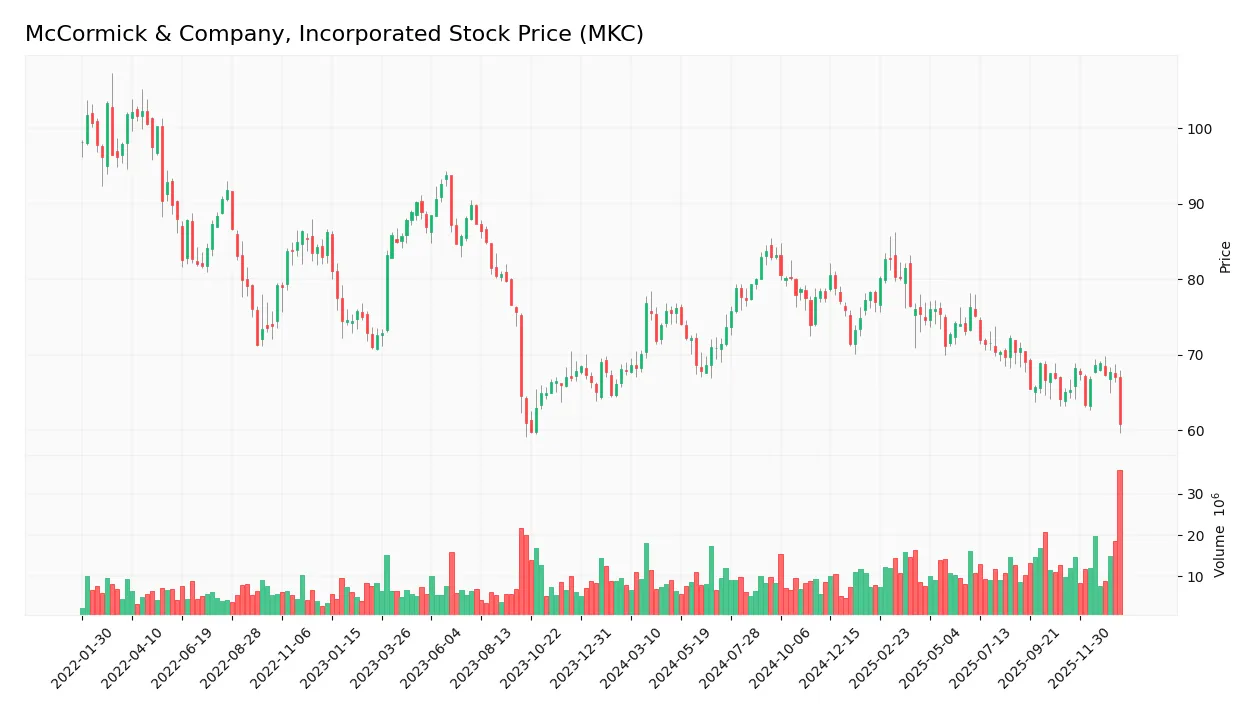
The weekly stock chart of McCormick & Company, Incorporated (MKC) over the last 12 months shows the price fluctuations and trend dynamics as follows:
Trend Analysis
Over the past 12 months, MKC’s stock price declined by 10.35%, indicating a bearish trend with accelerating downward momentum. The stock traded between a high of 83.76 and a low of 60.79, with a volatility measure (standard deviation) of 5.19, reflecting notable price swings during this period.
Volume Analysis
In the last three months, trading volume for MKC has been increasing overall, with buyer volume slightly exceeding seller volume at 52.1%, signaling balanced but slightly buyer-favored activity. This neutral buyer behavior suggests steady investor participation without strong directional conviction.
Target Prices
The current analyst consensus for McCormick & Company, Incorporated (MKC) indicates a moderate upside potential.
| Target High | Target Low | Consensus |
|---|---|---|
| 85 | 67 | 74.29 |
Analysts expect MKC’s stock price to range between 67 and 85, with a consensus target around 74. This suggests cautious optimism about the stock’s near-term performance.

Don’t Let Luck Decide Your Entry Point
Optimize your entry points with our advanced ProRealTime indicators. You’ll get efficient buy signals with precise price targets for maximum performance. Start outperforming now!
Analyst & Consumer Opinions
This section examines analyst ratings and consumer feedback related to McCormick & Company, Incorporated (MKC).
Stock Grades
Here is a summary of recent verified stock grades for McCormick & Company, Incorporated from reputable financial institutions:
| Grading Company | Action | New Grade | Date |
|---|---|---|---|
| UBS | Maintain | Neutral | 2026-01-23 |
| Stifel | Maintain | Hold | 2026-01-23 |
| UBS | Maintain | Neutral | 2025-10-08 |
| Deutsche Bank | Maintain | Hold | 2025-10-08 |
| Stifel | Maintain | Hold | 2025-10-08 |
| Barclays | Maintain | Equal Weight | 2025-10-08 |
| Jefferies | Maintain | Buy | 2025-10-08 |
| Bernstein | Maintain | Outperform | 2025-10-08 |
| UBS | Maintain | Neutral | 2025-10-01 |
| JP Morgan | Maintain | Overweight | 2025-09-25 |
The consensus from these grades is predominantly neutral to hold, reflecting a cautious stance among analysts with a few recommending buy or outperform positions. Overall, the trend shows stability without recent upgrades or downgrades.
Consumer Opinions
Consumers generally appreciate McCormick & Company’s commitment to quality and flavor, though some note areas for improvement.
| Positive Reviews | Negative Reviews |
|---|---|
| Consistently high-quality spices with rich flavors | Some products have a higher price point |
| Wide variety of seasoning options for all cuisines | Occasional issues with packaging durability |
| Reliable and fresh ingredients | Limited availability of certain specialty blends |
| Enhances home-cooked meals significantly | Customer service response times can be slow |
Overall, McCormick receives praise for product quality and variety, while concerns mainly focus on pricing and packaging. These insights suggest strong brand loyalty but highlight opportunities for better customer experience.
Risk Analysis
Below is a concise overview of McCormick & Company’s key risks categorized by type, along with their probability and potential impact:
| Category | Description | Probability | Impact |
|---|---|---|---|
| Market Risk | Fluctuations in commodity prices affecting raw material costs | Medium | High |
| Liquidity Risk | Current and quick ratios below 1 indicate potential liquidity constraints | Medium | Medium |
| Operational Risk | Supply chain disruptions may affect production and delivery | Medium | Medium |
| Financial Risk | Moderate debt levels with debt-to-assets at 30.27% | Medium | Medium |
| Competitive Risk | Intense competition in packaged foods limits market share growth | High | Medium |
| Regulatory Risk | Changes in food safety and labeling regulations | Low | Medium |
| Economic Risk | Economic downturns reducing consumer spending on branded spices | Medium | Medium |
The most pressing risks for McCormick are market risk due to volatile raw material costs and competitive pressures in the packaged foods sector. Its liquidity ratios remain unfavorable, which warrants monitoring for short-term financial stability. The Altman Z-score places the company in a grey zone, signaling moderate bankruptcy risk, while the Piotroski score is average, reflecting decent but not strong financial health.
Should You Buy McCormick & Company, Incorporated?
McCormick appears to be exhibiting improving profitability alongside a slightly favorable moat, suggesting growing operational efficiency despite shedding value relative to cost of capital. Its leverage profile could be seen as moderate, with an overall rating of B reflecting a very favorable but cautious investment profile.
Strength & Efficiency Pillars
McCormick & Company, Incorporated showcases solid profitability with a net margin of 11.54% and an EBIT margin of 16.22%, underscoring operational efficiency. Despite a moderate return on equity at 13.76% and ROIC at 7.93%, the company’s weighted average cost of capital (WACC) is lower at 6.2%, indicating a positive spread and thus a capacity for value creation. The Altman Z-score of 2.44 places McCormick in a grey zone for financial distress risk, while a Piotroski score of 6 reflects average financial strength, suggesting moderate resilience.
Weaknesses and Drawbacks
The company faces liquidity concerns with a current ratio of 0.7 and an even weaker quick ratio of 0.28, signaling potential short-term solvency issues. Leverage remains moderate with a debt-to-equity ratio of 0.7, which neither alarms nor reassures fully. Valuation metrics are favorable with no elevated P/E or P/B reported, but a recent overall bearish stock trend with a price decline of 10.35% and increased market volatility (std deviation 5.19) indicate market pressure. Buyer dominance is near parity at 48.44%, reflecting a balanced but cautious investor sentiment.
Our Verdict about McCormick & Company, Incorporated
McCormick’s long-term fundamental profile appears favorable, supported by competent profitability and value creation metrics. However, the recent bearish technical trend and liquidity concerns introduce caution. Given the neutral buyer dominance in the recent period and a grey zone financial distress score, this profile might appear suitable for investors prioritizing steady fundamentals but suggests a wait-and-see approach for those sensitive to short-term market fluctuations.
Disclaimer: This content is for informational purposes only and does not constitute financial, investment, or other professional advice. Investing in financial markets involves a significant risk of loss, and past performance is not indicative of future results.
Additional Resources
- McCormick Raises Prices as Higher Costs Hurt Profitability – The Wall Street Journal (Jan 22, 2026)
- McCormick Just Released 4 New Frank’s RedHot Flavors and Fans Are Saying ‘Sign Me Up’ – Allrecipes (Jan 22, 2026)
- Cubs, Chas McCormick Agree To Minor League Deal – MLB Trade Rumors (Jan 22, 2026)
- Chicago Cubs news and notes — Carlson, Hoerner, McCormick, Shaw – Bleed Cubbie Blue (Jan 24, 2026)
- The Chicago Cubs Take a Low-Risk Swing on Chas McCormick – On Tap Sports Net (Jan 24, 2026)
For more information about McCormick & Company, Incorporated, please visit the official website: mccormickcorporation.com