Home > Analyses > Technology > MaxLinear, Inc.
MaxLinear powers the invisible networks connecting our digital world. Its cutting-edge semiconductor SoCs drive broadband modems, Wi-Fi routers, and 4G/5G infrastructure with relentless innovation. Renowned for integrating complex RF, analog, and digital functions into sleek platforms, MaxLinear shapes how we communicate daily. As the semiconductor landscape evolves rapidly, I ask: does MaxLinear’s technological edge and market position still justify its valuation and growth prospects?

Table of contents
Business Model & Company Overview
MaxLinear, Inc., founded in 2003 and headquartered in Carlsbad, California, stands as a key player in the semiconductor industry. It delivers integrated radiofrequency (RF), analog, and mixed-signal communications systems-on-chip (SoCs) that form a cohesive ecosystem powering connected homes, wireless infrastructure, and industrial applications worldwide. Its solutions blend RF, digital signal processing, security, and power management into a unified platform.
MaxLinear’s revenue engine balances high-performance hardware with embedded software, driving value across broadband modems, Wi-Fi routers, 4G/5G infrastructure, and fiber-optic networks. It serves global markets in the Americas, Europe, and Asia through direct sales and distributors. The company’s competitive advantage lies in its highly integrated end-to-end communication platforms that shape the future of digital connectivity.
Financial Performance & Fundamental Metrics
I will analyze MaxLinear, Inc.’s income statement, key financial ratios, and dividend payout policy to assess its core financial health and shareholder returns.
Income Statement
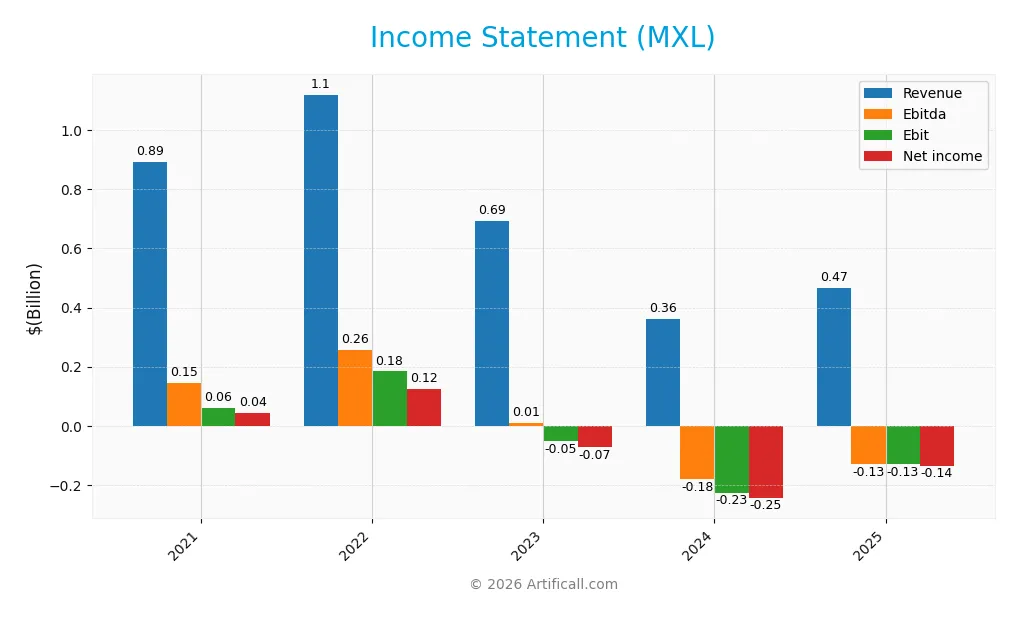
The following table summarizes MaxLinear, Inc.’s key income statement metrics over the past five fiscal years, highlighting revenue trends and profitability dynamics.
| 2021 | 2022 | 2023 | 2024 | 2025 | |
|---|---|---|---|---|---|
| Revenue | 892M | 1.12B | 693M | 361M | 468M |
| Cost of Revenue | 420M | 482M | 310M | 168M | 202M |
| Operating Expenses | 405M | 452M | 399M | 361M | 393M |
| Gross Profit | 472M | 638M | 383M | 192M | 266M |
| EBITDA | 145M | 256M | 9.5M | -182M | -131M |
| EBIT | 61M | 184M | -53M | -228M | -131M |
| Interest Expense | 13M | 9.8M | 11M | 11M | 10M |
| Net Income | 42M | 125M | -73M | -245M | -137M |
| EPS | 0.55 | 1.6 | -0.91 | -2.93 | -1.58 |
| Filing Date | 2022-02-02 | 2023-02-01 | 2024-01-31 | 2025-01-29 | 2026-01-29 |
Income Statement Evolution
MaxLinear’s revenue fell sharply by 47.6% from 2021 to 2025, with net income declining over 425% in the same period. However, the past year saw a 29.7% revenue rebound and a 57% net margin improvement. Gross margins remained relatively stable and favorable at 56.8%, even as operating and net income margins stayed negative.
Is the Income Statement Favorable?
In 2025, MaxLinear showed signs of recovery with a 29.7% revenue increase and a 42.6% EBIT growth year-over-year. Despite a negative EBIT margin of -28%, gross margin at 56.8% and controlled interest expense at 2.15% support operational stability. The net margin of -29.2% remains unfavorable, but recent margin improvements and EPS growth of 46% suggest improving fundamentals.
Financial Ratios
The following table presents key financial ratios for MaxLinear, Inc. (MXL) across fiscal years 2021 to 2025, reflecting profitability, leverage, liquidity, and market valuation metrics:
| Ratios | 2021 | 2022 | 2023 | 2024 | 2025 |
|---|---|---|---|---|---|
| Net Margin | 4.7% | 11.2% | -10.6% | -68.0% | -29.2% |
| ROE | 8.6% | 18.5% | -10.7% | -47.5% | -30.2% |
| ROIC | 6.9% | 15.5% | -1.8% | -24.3% | -20.2% |
| P/E | 137 | 21 | -26 | -6.7 | -11 |
| P/B | 11.7 | 3.9 | 2.8 | 3.2 | 3.3 |
| Current Ratio | 1.95 | 1.65 | 2.20 | 1.77 | 1.34 |
| Quick Ratio | 1.31 | 1.18 | 1.75 | 1.28 | 0.92 |
| D/E | 0.69 | 0.23 | 0.23 | 0.29 | 0.30 |
| Debt-to-Assets | 32.3% | 13.1% | 14.6% | 17.2% | 17.1% |
| Interest Coverage | 5.2 | 19.0 | -1.5 | -15.5 | -12.6 |
| Asset Turnover | 0.85 | 0.94 | 0.64 | 0.42 | 0.59 |
| Fixed Asset Turnover | 10.1 | 10.4 | 7.1 | 4.7 | 7.3 |
| Dividend Yield | 0% | 0% | 0% | 0% | 0% |
Evolution of Financial Ratios
MaxLinear’s Return on Equity (ROE) deteriorated sharply from positive in 2021 and 2022 to -30.25% in 2025, reflecting worsening profitability. The Current Ratio declined from 2.20 in 2023 to 1.34 in 2025, indicating reduced short-term liquidity. Debt-to-Equity Ratio improved from 0.69 in 2021 to a favorable 0.30 in 2025, suggesting lower leverage.
Are the Financial Ratios Favorable?
Profitability ratios remain unfavorable with a net margin of -29.23% and ROIC at -20.17%, well below the 2025 WACC of 11.38%. Liquidity ratios like Current Ratio (1.34) and Quick Ratio (0.92) are neutral, neither signaling strength nor distress. Leverage ratios, including Debt-to-Equity at 0.30, are favorable. Asset turnover is neutral at 0.59, while fixed asset turnover is favorable at 7.26. Overall, 50% of ratios are unfavorable, leading to a slightly unfavorable financial profile.
Shareholder Return Policy
MaxLinear, Inc. (MXL) does not pay dividends, reflecting its negative net income in recent years. The company prioritizes reinvestment and growth, with no dividend payout or yield reported.
MXL has not engaged in share buybacks either, focusing resources on operational needs amid losses. This approach aligns with long-term value creation but depends on eventual profitability improvements.
Score analysis
The following radar chart illustrates MaxLinear, Inc.’s key financial scores across valuation, profitability, and leverage metrics:
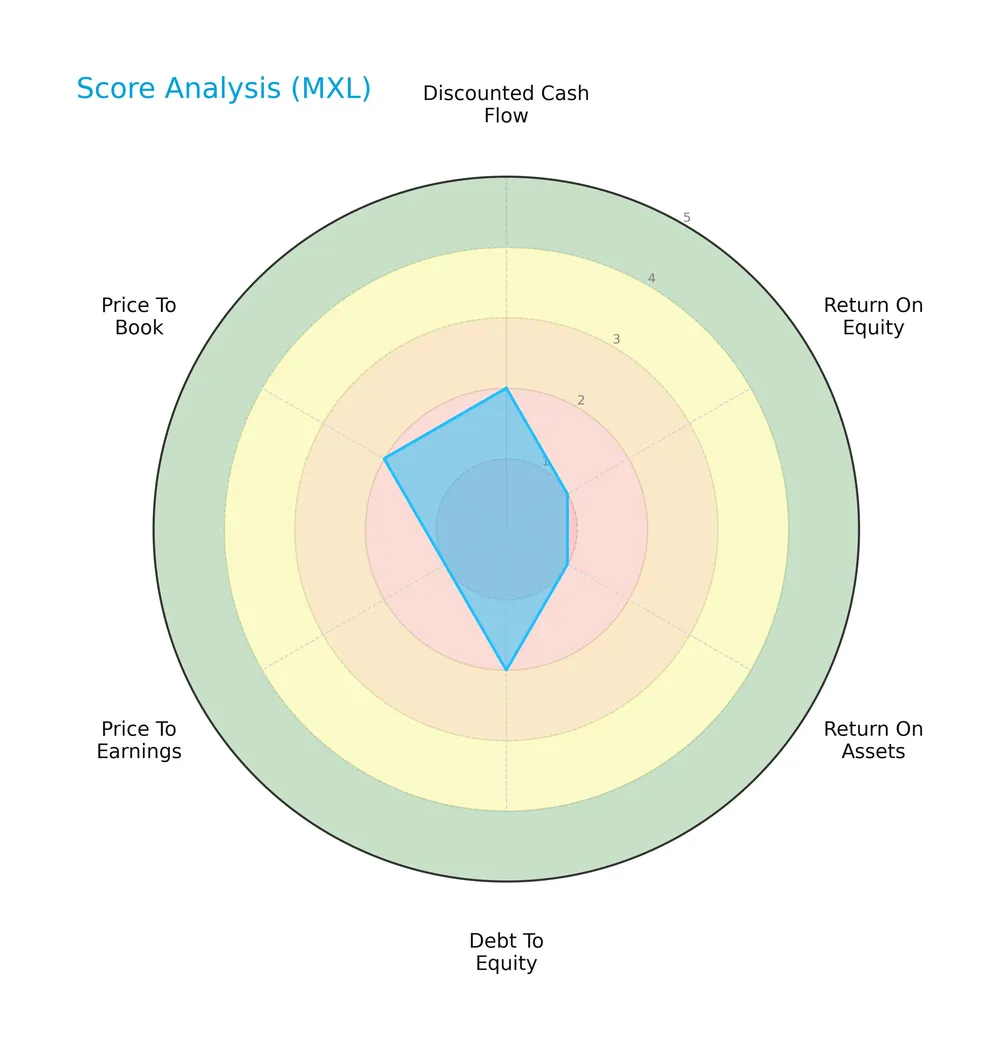
MaxLinear shows mostly very unfavorable profitability and valuation scores, with return on equity, return on assets, and price-to-earnings rated very low. Debt-to-equity, discounted cash flow, and price-to-book scores appear moderate, indicating mixed financial signals.
Analysis of the company’s bankruptcy risk
MaxLinear’s Altman Z-Score positions the company in the safe zone, suggesting a low risk of bankruptcy:

Is the company in good financial health?
This Piotroski diagram highlights MaxLinear’s average financial health based on profitability, leverage, and liquidity measures:

With a Piotroski Score of 4, MaxLinear’s financial strength is moderate, reflecting neither strong resilience nor significant weaknesses in operational performance.
Competitive Landscape & Sector Positioning
This analysis examines MaxLinear, Inc.’s positioning within the semiconductor sector, focusing on key business segments and competitors. I will assess whether MaxLinear holds a sustainable competitive advantage over its industry peers.
Strategic Positioning
MaxLinear focuses on diversified semiconductor products spanning broadband, connectivity, industrial, and infrastructure segments. Geographically, it relies heavily on the Asian market, with minimal US revenue. This concentration in Asia shapes its global exposure and risk profile.
Revenue by Segment
This pie chart illustrates MaxLinear, Inc.’s revenue distribution by segment for fiscal year 2025, highlighting the company’s diverse product portfolio.
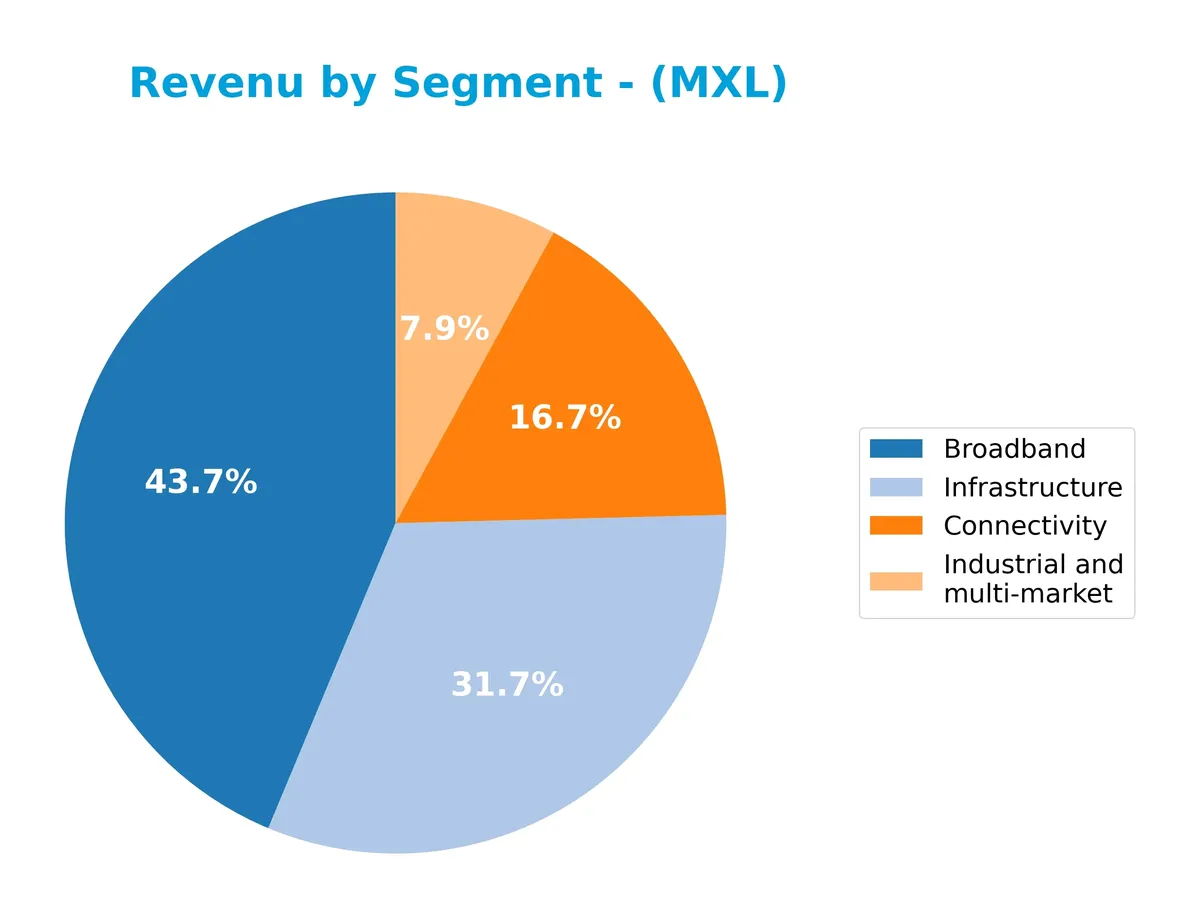
Broadband leads MaxLinear’s revenues with 204M in 2025, showing strong recovery from 117M in 2024. Infrastructure also grew to 148M, signaling steady demand. Connectivity rose to 78M, while Industrial and multi-market declined to 37M. The mix shows concentration in Broadband and Infrastructure, but Industrial’s drop signals potential risk in diversification. Recent acceleration in Broadband is a clear growth driver to watch closely.
Key Products & Brands
MaxLinear’s key products and brands span multiple communication system segments, including broadband, connectivity, industrial, and infrastructure solutions:
| Product | Description |
|---|---|
| Broadband | Radiofrequency and mixed-signal solutions for cable, fiber, and DSL broadband modems and gateways. |
| Connectivity | Wi-Fi and wireline routers, radio transceivers, and modems for 4G/5G base-station and backhaul infrastructure. |
| Industrial and multi-market | Mixed-signal communications SoCs used in diverse industrial applications and multi-market electronic devices. |
| Infrastructure | Fiber-optic modules and power management products for data center, metro, and long-haul transport networks. |
MaxLinear’s product portfolio integrates RF, analog, and digital processing technologies. It targets high-speed communication platforms for connected homes, wireless infrastructure, and industrial markets worldwide.
Main Competitors
In the Technology sector’s Semiconductors industry, MaxLinear, Inc. faces 38 competitors; here are the top 10 leaders by market capitalization:
| Competitor | Market Cap. |
|---|---|
| NVIDIA Corporation | 4.6T |
| Broadcom Inc. | 1.6T |
| Taiwan Semiconductor Manufacturing Company Limited | 1.6T |
| ASML Holding N.V. | 415B |
| Advanced Micro Devices, Inc. | 363B |
| Micron Technology, Inc. | 353B |
| Lam Research Corporation | 232B |
| Applied Materials, Inc. | 214B |
| QUALCOMM Incorporated | 185B |
| Intel Corporation | 173B |
MaxLinear ranks 34th among 38 competitors by market cap. Its scale is just 0.03% of NVIDIA’s, the sector leader. It sits well below the average top 10 market cap of 975B and below the sector median of 31B. The company enjoys a substantial 102.9% market cap gap from its nearest larger rival, indicating a clear size step in the competitive landscape.
Comparisons with competitors
Check out how we compare the company to its competitors:
Does MaxLinear have a competitive advantage?
MaxLinear currently lacks a competitive advantage, as its return on invested capital (ROIC) is significantly below its weighted average cost of capital (WACC), indicating value destruction and declining profitability. The company’s ROIC trend over 2021-2025 shows a steep decline, reinforcing its very unfavorable moat status.
Looking ahead, MaxLinear operates in diverse markets including connected home, wired and wireless infrastructure, and industrial applications, offering integrated communications SoCs. Opportunities exist in expanding 4G/5G infrastructure and fiber-optic modules, which could support future growth if operational efficiency improves.
SWOT Analysis
This analysis highlights MaxLinear’s key internal and external factors to inform strategic decisions.
Strengths
- strong gross margin at 56.8%
- favorable revenue growth of 29.7% in last year
- low debt-to-assets ratio at 17.1%
Weaknesses
- negative net margin at -29.2%
- declining ROIC well below WACC
- weak profitability metrics and negative returns
Opportunities
- expanding 5G and fiber infrastructure demand
- growth in connected home and industrial IoT markets
- rising need for integrated SoC solutions
Threats
- intense competition in semiconductor sector
- rapid technology shifts require constant innovation
- macroeconomic volatility impacting supply chains
MaxLinear combines solid margin structure and recent revenue growth with significant profitability challenges. The company must leverage market trends while urgently addressing its value destruction to sustain long-term competitiveness.
Stock Price Action Analysis
The weekly stock chart of MaxLinear, Inc. (MXL) reveals price movements and volatility patterns over the past 12 months:
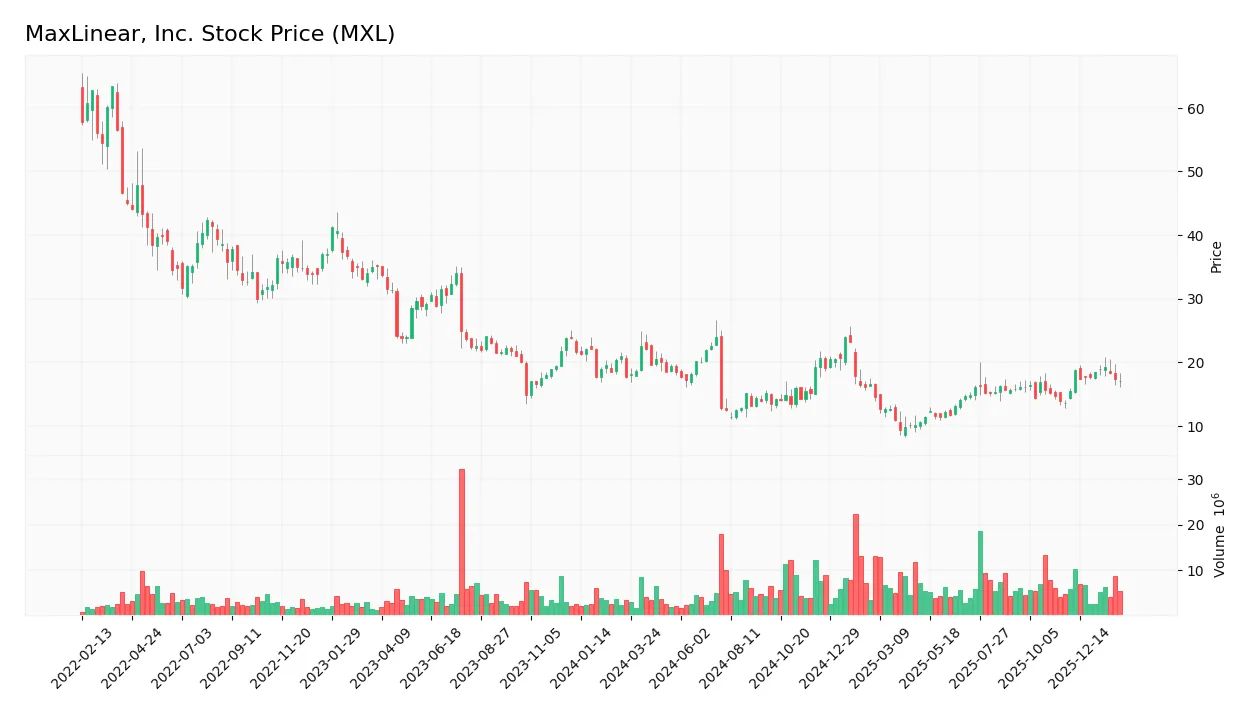
Trend Analysis
Over the past 12 months, MXL’s stock price declined by 3.61%, indicating a bearish trend. The price showed acceleration in this downward movement, with a high volatility level measured by a 3.34 standard deviation. The stock traded between a high of 24.05 and a low of 9.31 during this period.
Volume Analysis
Trading volume for MXL has increased recently, with a slight buyer dominance at 57% between November 2025 and February 2026. This buyer-driven activity suggests growing investor interest and participation, potentially signaling a shift in market sentiment despite the overall bearish trend.
Target Prices
Analysts show a tight target price range, reflecting moderate confidence in MaxLinear’s near-term outlook.
| Target Low | Target High | Consensus |
|---|---|---|
| 23 | 25 | 24 |
The consensus target price of $24 implies a stable valuation, with limited upside but solid support near $23, signaling cautious optimism.

Don’t Let Luck Decide Your Entry Point
Optimize your entry points with our advanced ProRealTime indicators. You’ll get efficient buy signals with precise price targets for maximum performance. Start outperforming now!
Analyst & Consumer Opinions
This section examines MaxLinear, Inc. (MXL) through detailed analyst ratings and consumer feedback for comprehensive insight.
Stock Grades
Here are the latest verified stock grades for MaxLinear, Inc. from established financial firms:
| Grading Company | Action | New Grade | Date |
|---|---|---|---|
| Wells Fargo | Maintain | Equal Weight | 2026-01-30 |
| Benchmark | Maintain | Buy | 2026-01-16 |
| Benchmark | Maintain | Buy | 2025-10-24 |
| Benchmark | Maintain | Buy | 2025-10-17 |
| Benchmark | Maintain | Buy | 2025-09-02 |
| Loop Capital | Maintain | Hold | 2025-08-04 |
| Wells Fargo | Maintain | Equal Weight | 2025-07-24 |
| Benchmark | Maintain | Buy | 2025-07-24 |
| Susquehanna | Maintain | Neutral | 2025-07-24 |
| Susquehanna | Maintain | Neutral | 2025-07-22 |
The consensus leans toward a Buy rating, with Benchmark consistently endorsing the stock. However, Wells Fargo and Loop Capital maintain more cautious Equal Weight and Hold stances, indicating some division in analyst sentiment.
Consumer Opinions
Consumers express mixed feelings about MaxLinear, Inc., reflecting both satisfaction with its innovative products and concerns about customer service.
| Positive Reviews | Negative Reviews |
|---|---|
| “MaxLinear’s chipsets deliver excellent performance and reliability.” | “Customer support response times are often slow and unhelpful.” |
| “Their products are competitively priced with solid features.” | “Firmware updates sometimes cause unexpected issues.” |
| “I appreciate the energy efficiency in their designs.” | “Limited documentation makes troubleshooting difficult.” |
Overall, users praise MaxLinear’s product quality and innovation but frequently cite weak customer support and documentation as key drawbacks. This mix suggests room for operational improvements despite strong technical appeal.
Risk Analysis
Below is a summary of key risks facing MaxLinear, Inc., highlighting their likelihood and potential impact on the company’s financial health:
| Category | Description | Probability | Impact |
|---|---|---|---|
| Profitability Risk | Negative net margin (-29.23%) signals ongoing losses. | High | High |
| Operational Risk | ROIC (-20.17%) well below WACC (11.38%), destroying value. | High | High |
| Liquidity Risk | Current ratio (1.34) and quick ratio (0.92) indicate moderate liquidity. | Medium | Medium |
| Leverage Risk | Debt-to-equity ratio (0.3) is moderate, manageable debt level. | Low | Medium |
| Market Volatility | Beta of 1.708 suggests high sensitivity to market swings. | High | Medium |
| Credit Risk | Interest coverage ratio (-13.01) is negative, raising default risk. | High | High |
| Dividend Risk | Zero dividend yield may deter income-focused investors. | High | Low |
I see the most pressing risks stem from weak profitability and negative returns on invested capital. These factors erode shareholder value and signal operational inefficiencies. The negative interest coverage ratio also flags trouble servicing debt, despite moderate leverage. Market volatility compounds these risks given MXL’s high beta. Investors must weigh these challenges against the company’s safe Altman Z-score and average Piotroski score, which suggest a moderate credit profile but weak financial strength.
Should You Buy MaxLinear, Inc.?
MaxLinear, Inc. appears to be shedding value with declining profitability and a very unfavorable moat profile. While its leverage profile is moderate and the Altman Z-Score suggests financial stability, overall operational efficiency and return metrics imply a cautious C- rating.
Strength & Efficiency Pillars
MaxLinear, Inc. exhibits solid financial health, reflected in an Altman Z-score of 3.03, positioning it safely away from bankruptcy risk. The company maintains a moderate Piotroski score of 4, suggesting average financial strength. Its debt-to-equity ratio stands favorably at 0.3, indicating prudent leverage management. While gross margin is robust at 56.84%, the firm struggles with profitability, as reflected by a negative ROIC of -20.17% that falls below the WACC of 11.38%, signifying value destruction rather than creation.
Weaknesses and Drawbacks
Profitability metrics weigh heavily on MaxLinear’s profile. The net margin of -29.23% and ROE of -30.25% signal operational inefficiencies. The price-to-book ratio of 3.34 marks an elevated valuation relative to book value, posing a risk if earnings fail to rebound. Interest coverage is deeply negative at -13.01, highlighting vulnerability to debt servicing costs despite low leverage. The bearish overall stock trend, with a 3.61% price decline, reflects market skepticism, although recent buyer dominance at 57% hints at tentative support.
Our Verdict about MaxLinear, Inc.
MaxLinear presents an unfavorable long-term fundamental profile driven by persistent profitability challenges and value erosion. Despite this, recent buyer dominance and a modest upward price trend may suggest early signs of recovery. The profile might appear attractive to investors seeking turnaround opportunities but suggests caution given the current financial and market headwinds. A wait-and-see stance could be prudent until profitability stabilizes and valuation risks diminish.
Disclaimer: This content is for informational purposes only and does not constitute financial, investment, or other professional advice. Investing in financial markets involves a significant risk of loss, and past performance is not indicative of future results.
Additional Resources
- MaxLinear (MXL) Q4 Revenue Jumps 48% Driven by Infrastructure and Data Center Demand – Yahoo Finance (Jan 31, 2026)
- Universal Beteiligungs und Servicegesellschaft mbH Acquires Shares of 97,719 MaxLinear, Inc $MXL – MarketBeat (Jan 31, 2026)
- MaxLinear (MXL) Is Down 5.7% After Narrower Q4 Loss And New Buyback Plan – Has The Bull Case Changed? – simplywall.st (Feb 02, 2026)
- AIGH Capital Dumps 1.1 Million MaxLinear (MXL) Shares – fool.com (Feb 02, 2026)
- MaxLinear Stock Price Today | NASDAQ: MXL Live – Investing.com (Jan 29, 2026)
For more information about MaxLinear, Inc., please visit the official website: maxlinear.com