Home > Analyses > Technology > Match Group, Inc.
Match Group, Inc. revolutionizes how millions connect and form relationships worldwide. With flagship brands like Tinder, Match, and Hinge, it dominates the online dating landscape. The company’s relentless innovation and broad portfolio set the industry standard for user engagement and revenue growth. As competition intensifies and user preferences evolve, I ask: does Match Group’s current valuation still reflect its growth potential and operational strength?

Table of contents
Business Model & Company Overview
Match Group, Inc., founded in 1986 and headquartered in Dallas, Texas, dominates the global dating landscape with a portfolio that includes Tinder, Match, OkCupid, and Hinge. Its suite of products forms a cohesive digital matchmaking ecosystem that connects millions. With 2,500 employees, the company leads the Software – Application industry through innovation and scale.
The company’s revenue engine balances subscription-based services and in-app purchases, generating steady recurring income worldwide across the Americas, Europe, and Asia. Its strategic global footprint and diversified brand mix create a robust competitive advantage. Match Group’s integrated platform and data-driven insights build a durable economic moat, shaping the future of online dating.
Financial Performance & Fundamental Metrics
I will analyze Match Group, Inc.’s income statement, key financial ratios, and dividend payout policy to assess its core financial health and shareholder value.
Income Statement
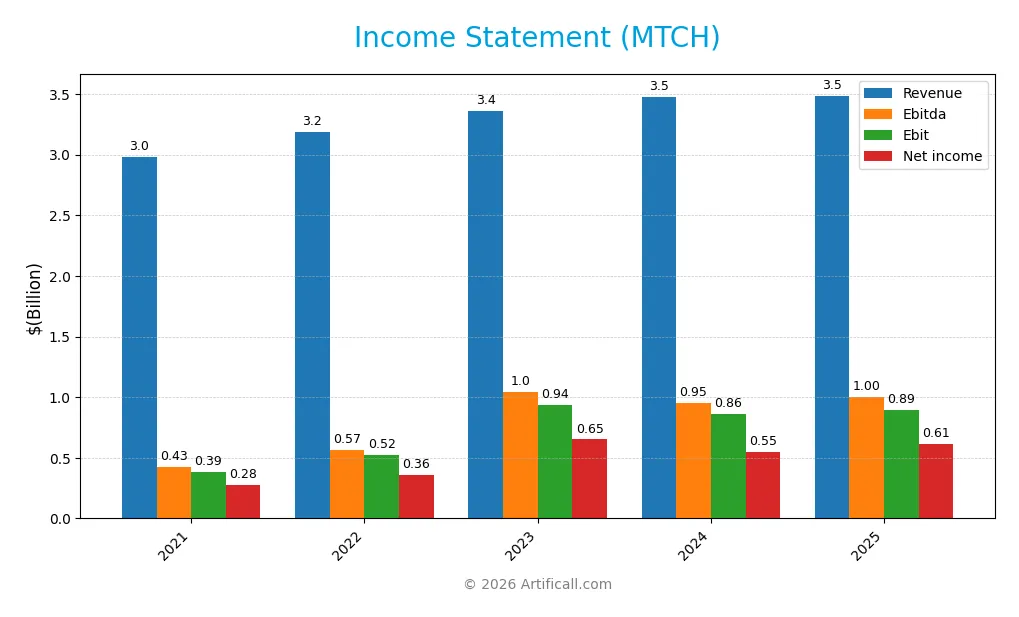
The table below summarizes Match Group, Inc.’s key financial results for fiscal years 2021 through 2025, reflecting revenue, expenses, and profitability trends.
| 2021 | 2022 | 2023 | 2024 | 2025 | |
|---|---|---|---|---|---|
| Revenue | 2.98B | 3.19B | 3.36B | 3.48B | 3.49B |
| Cost of Revenue | 839M | 960M | 954M | 991M | 948M |
| Operating Expenses | 1.29B | 1.71B | 1.49B | 1.66B | 1.67B |
| Gross Profit | 2.14B | 2.23B | 2.41B | 2.49B | 2.54B |
| EBITDA | 428M | 567M | 1.05B | 952M | 999M |
| EBIT | 387M | 523M | 937M | 864M | 894M |
| Interest Expense | 130M | 146M | 160M | 160M | 148M |
| Net Income | 278M | 362M | 651M | 551M | 613M |
| EPS | 1.01 | 1.28 | 2.36 | 2.12 | 2.53 |
| Filing Date | 2022-02-24 | 2023-02-24 | 2024-02-23 | 2025-02-27 | 2026-02-26 |
Income Statement Evolution
From 2021 to 2025, Match Group’s revenue grew 16.9%, but growth slowed to 0.2% in the last year. Gross profit increased steadily, reflecting stable gross margins around 72.8%. Operating expenses rose modestly, supporting a slight EBIT margin improvement to 25.6%. Net income more than doubled over the period, with net margin expanding by nearly 89%.
Is the Income Statement Favorable?
In 2025, fundamentals appear favorable. The company posted $3.49B revenue and $613M net income, achieving a healthy 17.6% net margin. EBIT margin at 25.6% and interest expense ratio of 4.2% support operational efficiency. EPS rose 17.8% year-over-year, signaling strong profitability despite revenue growth stagnation. Overall, income metrics reflect solid earnings quality and margin resilience.
Financial Ratios
The following table presents key financial ratios for Match Group, Inc. (MTCH) over the last five fiscal years, illustrating profitability, leverage, liquidity, valuation, and operational efficiency:
| Ratios | 2021 | 2022 | 2023 | 2024 | 2025 |
|---|---|---|---|---|---|
| Net Margin | 9.3% | 11.4% | 19.7% | 16.2% | 17.6% |
| ROE | -1.4% | -1.0% | -33.3% | -8.7% | -2.4% |
| ROIC | 21.3% | 13.6% | 19.3% | 16.5% | 18.5% |
| P/E | 131 | 32.4 | 15.4 | 15.4 | 12.8 |
| P/B | -178.5 | -32.6 | -515 | -133.7 | -30.9 |
| Current Ratio | 1.04 | 1.59 | 2.39 | 2.54 | 1.42 |
| Quick Ratio | 1.04 | 1.59 | 2.39 | 2.54 | 1.42 |
| D/E | -19.3 | -10.7 | -196.6 | -60.5 | -15.7 |
| Debt-to-Assets | 77.6% | 91.7% | 85.2% | 86.2% | 89.1% |
| Interest Coverage | 6.5x | 3.5x | 5.7x | 5.1x | 5.9x |
| Asset Turnover | 0.59 | 0.76 | 0.75 | 0.78 | 0.78 |
| Fixed Asset Turnover | 18.3 | 18.1 | 17.3 | 22.0 | 26.6 |
| Dividend Yield | 0% | 0% | 0% | 0% | 2.4% |
Evolution of Financial Ratios
Match Group’s Return on Equity (ROE) remained negative, worsening to -242% in 2025, indicating persistent equity challenges. The Current Ratio declined sharply from above 2.5 in 2024 to 1.42 in 2025, reflecting reduced liquidity. Debt-to-Equity improved to -15.67, showing a shift in leverage structure, while profitability margins increased steadily, signaling stronger earnings.
Are the Financial Ratios Favorable?
In 2025, profitability metrics like net margin (17.6%) and ROIC (18.5%) appear favorable, outperforming typical sector benchmarks. Liquidity is mixed; the current ratio is neutral, but the quick ratio shows strength. Despite a high debt-to-assets ratio (89%), interest coverage remains solid at 6.06. Asset turnover is stable, and dividend yield at 2.38% adds appeal. Overall, 71% of key ratios are favorable, indicating a generally positive financial profile.
Shareholder Return Policy
Match Group, Inc. does not pay dividends, reflecting its reinvestment strategy during growth phases. The company supports shareholder value through share buybacks, funded by robust free cash flow coverage near 95%. This approach prioritizes long-term expansion over immediate income distribution.
This policy aligns with sustainable value creation, given Match Group’s strong margins and cash flow metrics. However, investors should monitor buyback levels and leverage ratios closely, as excessive debt and repurchases could constrain future flexibility. Overall, the absence of dividends suits its capital allocation focus.
Score analysis
The radar chart below summarizes key financial scores assessing Match Group’s valuation, profitability, and leverage metrics:
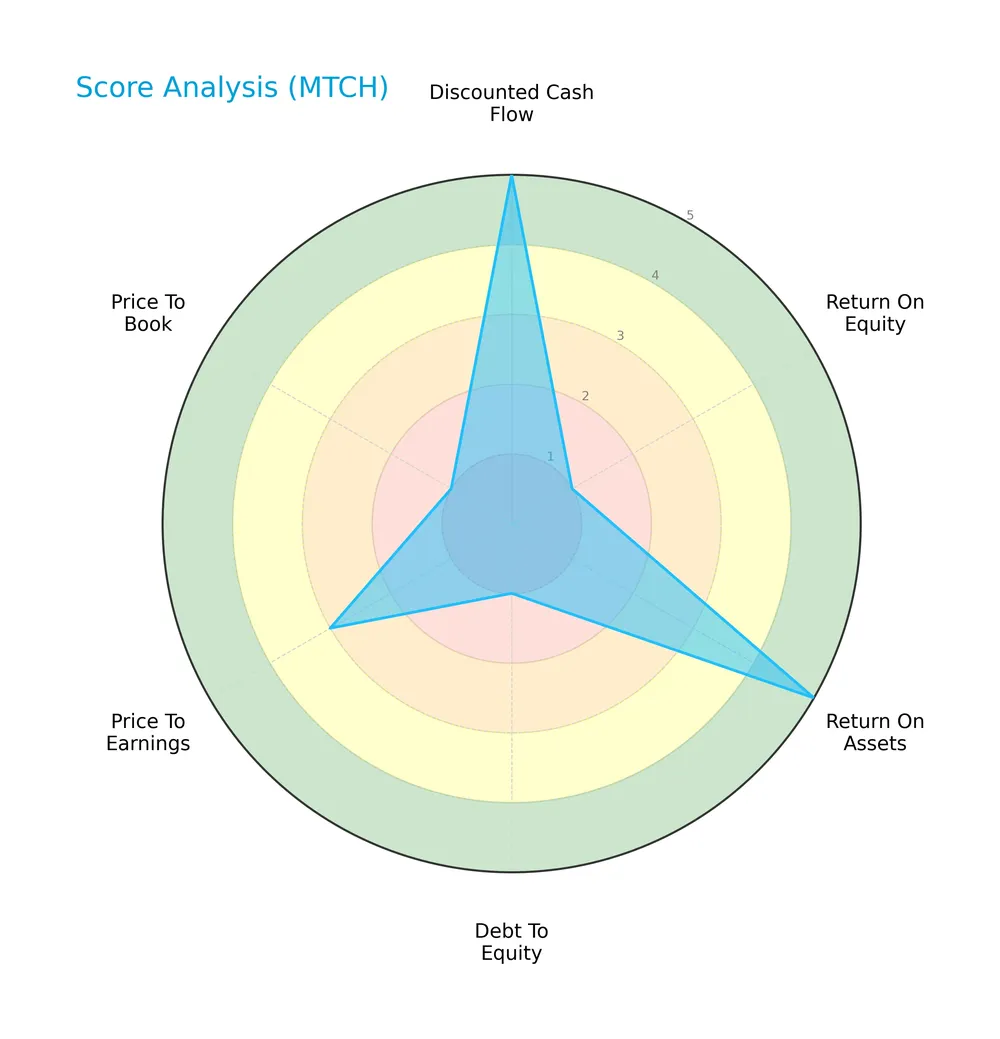
Match Group’s discounted cash flow and return on assets scores are very favorable at 5 each. However, return on equity, debt to equity, and price to book scores are very unfavorable at 1. Price to earnings is moderate at 3, reflecting mixed operational efficiency and valuation signals.
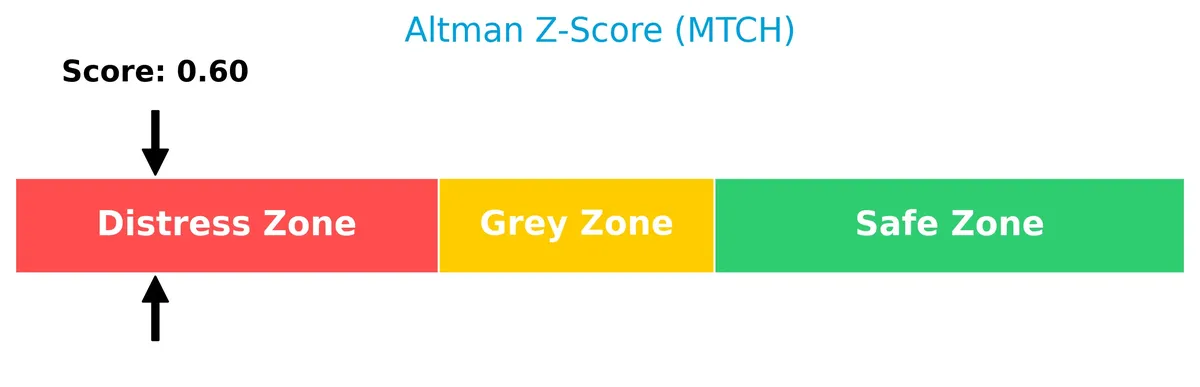
Analysis of the company’s bankruptcy risk
Match Group’s Altman Z-Score places it in the distress zone, signaling a high risk of financial distress and potential bankruptcy:
Is the company in good financial health?
The Piotroski Score chart highlights Match Group’s strong financial health rating based on nine profitability and efficiency criteria:
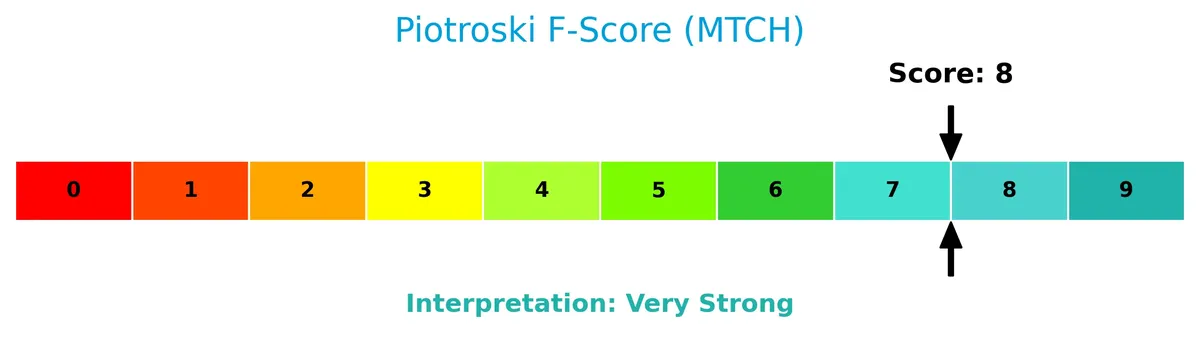
With a Piotroski Score of 8, the company shows very strong financial fundamentals, indicating robust profitability, sound leverage, and effective capital management.
Competitive Landscape & Sector Positioning
This section examines Match Group, Inc.’s strategic positioning within the software application sector. It reviews revenue by segment, key products, and main competitors. I will assess whether Match Group holds a competitive advantage over its peers.
Strategic Positioning
Match Group concentrates on dating products with a portfolio including Tinder and OkCupid. Its revenue shows geographic diversification, with Non-US sales at $1.96B and US sales at $1.53B in 2025, reflecting balanced global exposure within a focused product segment.
Revenue by Segment
This pie chart illustrates Match Group, Inc.’s revenue distribution by product and service segments for the fiscal year 2020.

In 2020, Match Group’s revenue primarily derived from its Service segment at $1.36B, with Product and Service, Other contributing $989M. Historically, the company’s focus has shifted from broader categories like Dating and eCommerce to more consolidated service offerings. The recent concentration in Service signals strategic focus but also introduces a risk if this segment faces disruption or market saturation.
Key Products & Brands
Match Group’s portfolio includes leading dating platforms and complementary brands worldwide:
| Product | Description |
|---|---|
| Tinder | A globally recognized dating app focused on casual dating and broad user engagement. |
| Match | A flagship online dating service targeting serious relationships and long-term matches. |
| Meetic | European dating platform offering localized matchmaking services. |
| OkCupid | A brand known for detailed user profiles and algorithm-driven matches. |
| Hinge | A dating app emphasizing meaningful connections and relationship-focused experiences. |
| Pairs | A dating service primarily serving the Japanese market with tailored matchmaking features. |
| PlentyOfFish | A broad dating platform with a large user base and diverse matchmaking options. |
| OurTime | A niche dating service catering to singles over 50 seeking companionship or romance. |
| Other Brands | Various additional dating brands expanding Match Group’s market reach and demographic coverage. |
Match Group dominates the online dating market through a diversified brand portfolio. Its products cover a wide range of demographics and relationship goals, securing a strong competitive moat in the evolving digital dating industry.
Main Competitors
There are 33 competitors in total, with the table below listing the top 10 leaders by market capitalization:
| Competitor | Market Cap. |
|---|---|
| Salesforce, Inc. | 242B |
| Shopify Inc. | 210B |
| AppLovin Corporation | 209B |
| Intuit Inc. | 175B |
| Uber Technologies, Inc. | 172B |
| ServiceNow, Inc. | 153B |
| Cadence Design Systems, Inc. | 84.5B |
| Snowflake Inc. | 73.4B |
| Autodesk, Inc. | 61.2B |
| Workday, Inc. | 54.9B |
Match Group, Inc. ranks 28th among 33 competitors, with a market cap just 3.14% of Salesforce’s 242B. The company sits below both the 143.6B average of the top 10 and the 18.8B sector median. It is narrowly behind its closest competitor by approximately 0.72%, indicating a tight cluster in its market segment.
Comparisons with competitors
Check out how we compare the company to its competitors:
Does MTCH have a competitive advantage?
Match Group, Inc. shows a slight competitive advantage by generating returns above its cost of capital, indicating value creation despite a declining ROIC trend. Its 72.8% gross margin and 25.6% EBIT margin reflect efficient capital use and strong profitability.
Looking ahead, MTCH’s diversified brand portfolio—including Tinder, Match, and Hinge—positions it to capture growth across global dating markets. Expanding non-US revenues near $2B signals opportunities to leverage new demographics and product innovations.
SWOT Analysis
This analysis highlights Match Group’s internal capabilities and external market conditions to guide strategic decisions.
Strengths
- strong brand portfolio including Tinder and Hinge
- high gross margin at 72.8%
- favorable net margin of 17.59%
Weaknesses
- declining ROIC trend
- very high debt to assets at 89%
- negative return on equity (-242%)
Opportunities
- expanding non-US revenue base
- growing global online dating market
- potential for product innovation and diversification
Threats
- intense competition in the dating app sector
- regulatory risks on data privacy
- macroeconomic pressures impacting consumer spending
Match Group’s strong profitability and brand power support its market position, but heavy leverage and declining returns pose risks. Strategic focus must balance growth investments with debt management.
Stock Price Action Analysis
The weekly stock chart for Match Group, Inc. (MTCH) displays price movements and volatility trends over the past 12 months:
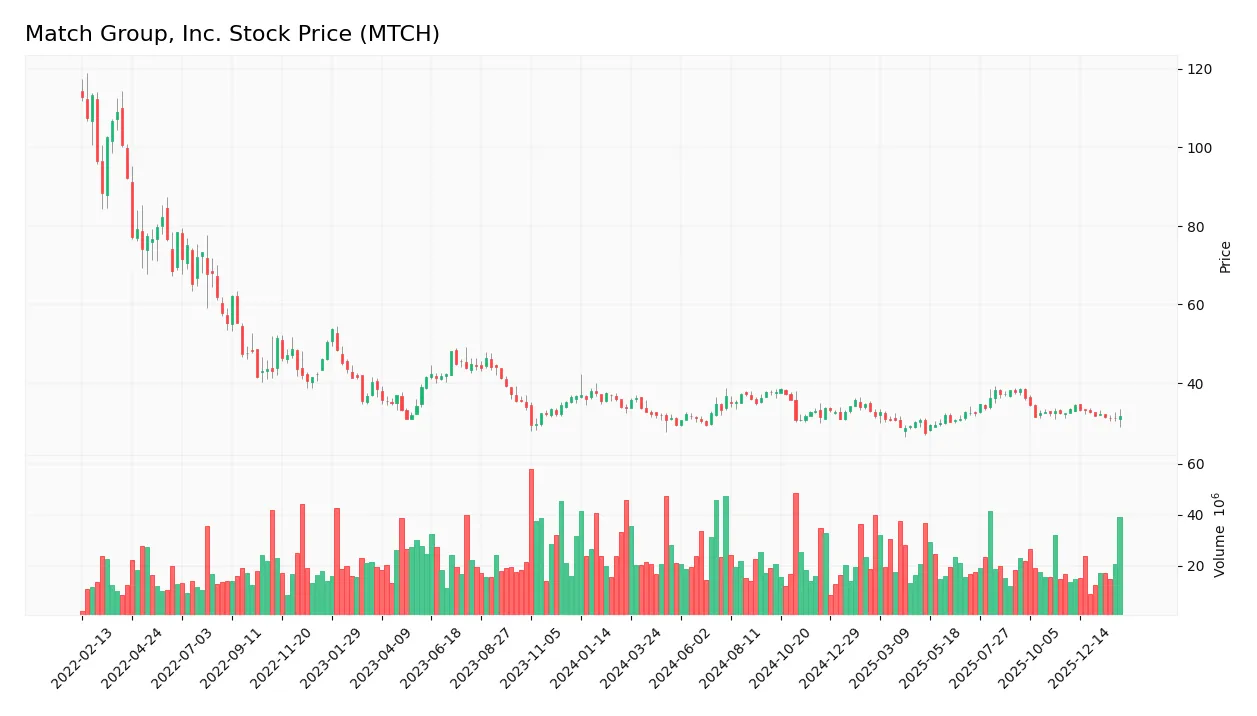
Trend Analysis
Over the past 12 months, MTCH’s stock price declined by 4.42%, indicating a bearish trend. The highest price reached 38.51, the lowest 27.18, with decelerating downward momentum. Recent three-month trend shows a 2.92% decrease, confirming a continued bearish stance with low volatility (std dev 0.77).
Volume Analysis
Trading volume over the last three months totals roughly 218M shares, with sellers slightly dominant at 53%. Volume is decreasing, suggesting waning market participation and cautious investor sentiment toward MTCH stock. This decline in activity may reflect uncertainty or reduced conviction among traders.
Target Prices
Analysts set a clear target range reflecting moderate upside potential for Match Group, Inc.
| Target Low | Target High | Consensus |
|---|---|---|
| 33 | 43 | 36 |
The consensus target price of $36 suggests steady growth expectations, with a balanced risk-reward profile noted by the range between $33 and $43.

Don’t Let Luck Decide Your Entry Point
Optimize your entry points with our advanced ProRealTime indicators. You’ll get efficient buy signals with precise price targets for maximum performance. Start outperforming now!
Analyst & Consumer Opinions
This section reviews recent analyst grades and consumer feedback for Match Group, Inc. to gauge market sentiment.
Stock Grades
The following table presents recent verified analyst grades for Match Group, Inc., reflecting their current positions and updates:
| Grading Company | Action | New Grade | Date |
|---|---|---|---|
| TD Cowen | Maintain | Buy | 2026-02-05 |
| JP Morgan | Maintain | Neutral | 2026-02-04 |
| Truist Securities | Maintain | Hold | 2026-02-04 |
| Morgan Stanley | Maintain | Equal Weight | 2026-01-13 |
| Truist Securities | Maintain | Hold | 2025-11-05 |
| Evercore ISI Group | Maintain | In Line | 2025-11-05 |
| Wells Fargo | Maintain | Equal Weight | 2025-11-05 |
| Morgan Stanley | Maintain | Equal Weight | 2025-10-20 |
| Susquehanna | Maintain | Positive | 2025-08-07 |
| Evercore ISI Group | Maintain | In Line | 2025-08-06 |
The overall trend shows consistent maintenance of existing grades, mostly centered around neutral or hold positions with a few buy ratings. This stability suggests cautious confidence without aggressive upgrades or downgrades.
Consumer Opinions
Consumers express a mix of enthusiasm and frustration toward Match Group, Inc., reflecting its strong market presence amid evolving user expectations.
| Positive Reviews | Negative Reviews |
|---|---|
| “Intuitive interface and diverse dating options.” | “Subscription fees feel steep for the features offered.” |
| “Effective matching algorithms that improve over time.” | “Customer support is slow to respond to issues.” |
| “Active user base ensures plenty of potential matches.” | “Frequent app updates sometimes introduce bugs.” |
Overall, users praise Match Group’s innovation and large community, but criticism centers on pricing and customer service. These gaps could pressure retention if not addressed swiftly.
Risk Analysis
Below is a summary of key risks facing Match Group, Inc., categorized by likelihood and potential impact:
| Category | Description | Probability | Impact |
|---|---|---|---|
| Financial Health | Altman Z-Score in distress zone (0.65), indicating high bankruptcy risk | High | Severe |
| Leverage | Debt to assets at 89.06%, signaling heavy reliance on debt financing | High | High |
| Profitability | Negative ROE (-241.99%) despite favorable net margin and ROIC | Medium | Medium |
| Market Volatility | Beta of 1.315 reflects above-average stock price swings | Medium | Medium |
| Liquidity | Current ratio of 1.42 (neutral), adequate but not robust for downturns | Low | Low |
The most alarming risk is the distressed Altman Z-Score combined with excessive debt levels. Historically, companies with such financial strain face heightened default risk, especially in turbulent market cycles. However, a strong Piotroski score of 8 suggests operational resilience. Investors must weigh these conflicting signals carefully.
Should You Buy Match Group, Inc.?
Match Group, Inc. appears to be generating strong value creation supported by a slightly favorable moat despite declining profitability. The leverage profile raises caution with distress-level bankruptcy risk signals. Its overall B rating suggests moderate investment appeal amid contrasting financial strengths.
Strength & Efficiency Pillars
Match Group, Inc. reports a solid net margin of 17.59% and a favorable EBIT margin of 25.62%, underscoring operational efficiency. The company’s ROIC stands at 18.5%, comfortably above its WACC of 7.7%, confirming it as a clear value creator. Despite a negative ROE of -241.99%, the strong operating margins and ROIC suggest efficient use of capital in core operations. Interest coverage of 6.06x further supports manageable financial costs amid operational strength.
Weaknesses and Drawbacks
Match Group is currently in financial distress, as evidenced by its Altman Z-Score of 0.65, signaling a high bankruptcy risk. This solvency red flag overshadows its operational performance. Additionally, while the P/E ratio of 12.77 is moderate, the company’s debt-to-assets ratio at 89.06% is unfavorable, indicating heavy leverage. The recent seller dominance with a buyer percentage of 46.96% adds short-term market pressure, suggesting cautious sentiment.
Our Final Verdict about Match Group, Inc.
Despite operational efficiency and value creation, Match Group’s Altman Z-Score firmly places it in the distress zone. This solvency risk makes the stock highly speculative and too risky for conservative capital. Investors might consider waiting for clearer financial stability before exposure, as current leverage and bankruptcy risk overshadow profitability strengths.
Disclaimer: This content is for informational purposes only and does not constitute financial, investment, or other professional advice. Investing in financial markets involves a significant risk of loss, and past performance is not indicative of future results.
Additional Resources
- Decoding Match Group Inc (MTCH): A Strategic SWOT Insight – GuruFocus (Feb 27, 2026)
- Match Group Inc. (NASDAQ:MTCH) Given Average Recommendation of “Hold” by Analysts – MarketBeat (Feb 27, 2026)
- Tinder to Host First-Ever Product Event – Finviz (Feb 26, 2026)
- Match Group (NASDAQ: MTCH) files shelf registration to sell stock, debt and warrants – Stock Titan (Feb 26, 2026)
- Match Group (MTCH) Long-Term Estimates Reduced by TD Cowen – Yahoo Finance (Feb 13, 2026)
For more information about Match Group, Inc., please visit the official website: mtch.com