Home > Analyses > Financial Services > Mastercard Incorporated
Mastercard powers the flow of commerce that touches billions worldwide every day. It dominates the financial services sector with cutting-edge payment technologies and trusted brands like MasterCard, Maestro, and Cirrus. Renowned for innovation, it expands its footprint through digital identity, cyber intelligence, and open banking solutions. As fintech disrupts traditional models, I ask: do Mastercard’s strong fundamentals still justify its premium valuation and future growth potential?

Table of contents
Business Model & Company Overview
Mastercard Incorporated, founded in 1966 and headquartered in Purchase, New York, stands as a global leader in the Financial – Credit Services sector. It operates a cohesive ecosystem of payment processing and value-added services that connect consumers, merchants, and financial institutions worldwide. Mastercard’s core mission centers on enabling seamless, secure transactions across credit, debit, and prepaid platforms under its Mastercard, Maestro, and Cirrus brands.
The company’s revenue engine blends transaction processing with recurring services like cyber intelligence, analytics, and consulting. This diversified model drives growth across the Americas, Europe, and Asia. I see Mastercard’s robust network effects and proprietary data solutions as a formidable economic moat, positioning it to shape the future of digital payments globally.
Financial Performance & Fundamental Metrics
I analyze Mastercard Incorporated’s income statement, key financial ratios, and dividend payout policy to assess its overall financial health and growth prospects.
Income Statement
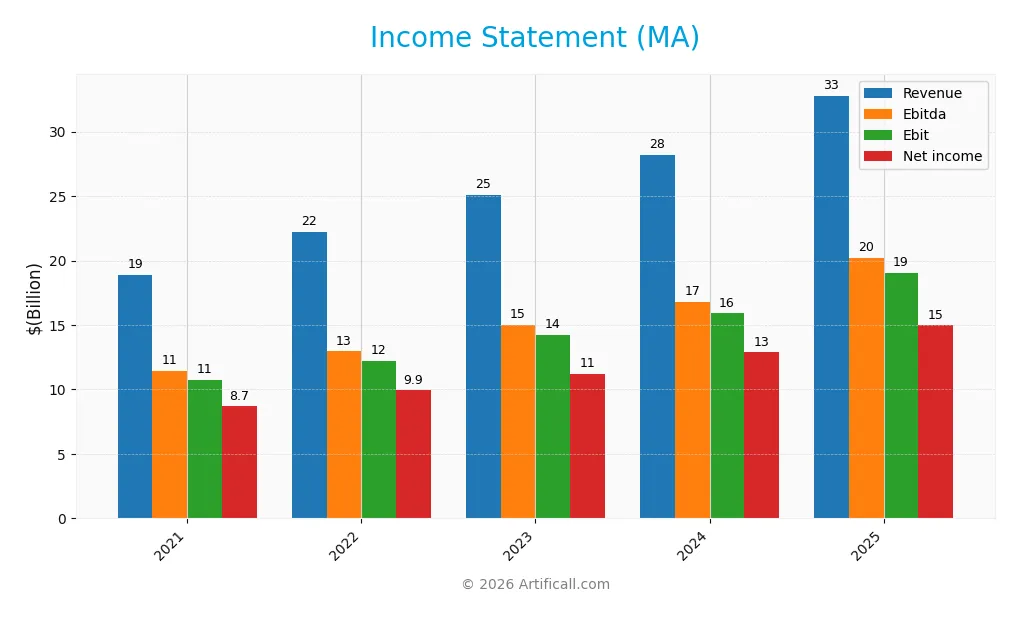
The following table summarizes Mastercard Incorporated’s key income statement figures for fiscal years 2021 through 2025, expressed in USD.
| 2021 | 2022 | 2023 | 2024 | 2025 | |
|---|---|---|---|---|---|
| Revenue | 18.9B | 22.2B | 25.1B | 28.2B | 32.8B |
| Cost of Revenue | 4.5B | 5.3B | 6.0B | 6.7B | 5.4B |
| Operating Expenses | 4.3B | 4.7B | 5.1B | 5.9B | 7.96B |
| Gross Profit | 14.4B | 17.0B | 19.1B | 21.5B | 27.4B |
| EBITDA | 11.5B | 13.0B | 15.0B | 16.8B | 20.2B |
| EBIT | 10.7B | 12.2B | 14.2B | 15.9B | 19.1B |
| Interest Expense | 0.43B | 0.47B | 0.58B | 0.65B | 0.72B |
| Net Income | 8.7B | 9.9B | 11.2B | 12.9B | 15.0B |
| EPS | 8.79 | 10.26 | 11.86 | 13.92 | 16.55 |
| Filing Date | 2022-02-11 | 2023-02-14 | 2024-02-13 | 2025-02-12 | 2026-02-11 |
Income Statement Evolution
Mastercard’s revenue rose 74% from 2021 to 2025, with a 16% increase in the last year alone. Net income grew similarly by 72% over five years, though net margin slightly declined by 0.77%. Gross and EBIT margins remain strong and stable, indicating efficient cost management despite rising operating expenses.
Is the Income Statement Favorable?
In 2025, Mastercard posted $32.8B revenue and $14.97B net income, reflecting a 45.65% net margin. EBIT margin at 58.1% and interest expense at 2.2% of revenue highlight solid profitability and manageable debt costs. While operating expenses grew proportionally with revenue, the overall fundamentals remain favorable, supported by robust margin profiles and earnings per share growth.
Financial Ratios
The following table presents key financial ratios for Mastercard Incorporated over the fiscal years 2021 to 2025:
| Ratios | 2021 | 2022 | 2023 | 2024 | 2025 |
|---|---|---|---|---|---|
| Net Margin | 46.0% | 44.7% | 44.6% | 45.7% | 45.6% |
| ROE | 119% | 158% | 162% | 199% | 193% |
| ROIC | 34% | 42% | 42% | 44% | 49% |
| P/E | 40.9 | 33.9 | 36.0 | 37.8 | 34.2 |
| P/B | 48.6 | 53.4 | 58.1 | 75.1 | 66.2 |
| Current Ratio | 1.29 | 1.17 | 1.17 | 1.03 | 1.03 |
| Quick Ratio | 1.29 | 1.17 | 1.17 | 1.03 | 1.03 |
| D/E | 1.90 | 2.23 | 2.26 | 2.81 | 2.46 |
| Debt-to-Assets | 37% | 36% | 37% | 38% | 35% |
| Interest Coverage | 23.4 | 26.0 | 24.4 | 24.1 | 26.9 |
| Asset Turnover | 0.50 | 0.57 | 0.59 | 0.59 | 0.61 |
| Fixed Asset Turnover | 9.90 | 11.1 | 12.2 | 13.2 | 14.2 |
| Dividend Yield | 0.49% | 0.57% | 0.54% | 0.50% | 0.54% |
Evolution of Financial Ratios
From 2021 to 2025, Mastercard’s Return on Equity (ROE) increased significantly, peaking at 193.46% in 2025, indicating strong profitability growth. The Current Ratio remained relatively stable near 1.03, suggesting consistent liquidity. Debt-to-Equity Ratio rose from 1.90 to 2.46, reflecting increased leverage but within manageable levels.
Are the Financial Ratios Fovorable?
Profitability ratios like net margin (45.65%) and ROE (193.46%) are favorable, supported by a strong return on invested capital (48.63%) well above WACC (7.46%). Liquidity is neutral to favorable with a current ratio of 1.03. Leverage is unfavorable given the debt-to-equity ratio of 2.46. Market valuation multiples (PE 34.21, PB 66.19) and dividend yield (0.54%) tilt unfavorable. Overall, the ratios are slightly favorable.
Shareholder Return Policy
Mastercard maintains a dividend payout ratio near 18-20%, with dividends per share rising steadily to $3.07 in 2025. Its dividend yield hovers around 0.5%, supported by strong free cash flow coverage and moderate share buyback activity, reflecting balanced capital allocation.
This approach aligns with sustainable long-term value creation by distributing consistent income while retaining significant cash flow for reinvestment. The payout remains conservative relative to profitability, reducing risks of unsustainable distributions or excessive repurchases.
Score analysis
The following radar chart visualizes Mastercard’s key financial scores to offer a comprehensive performance overview:
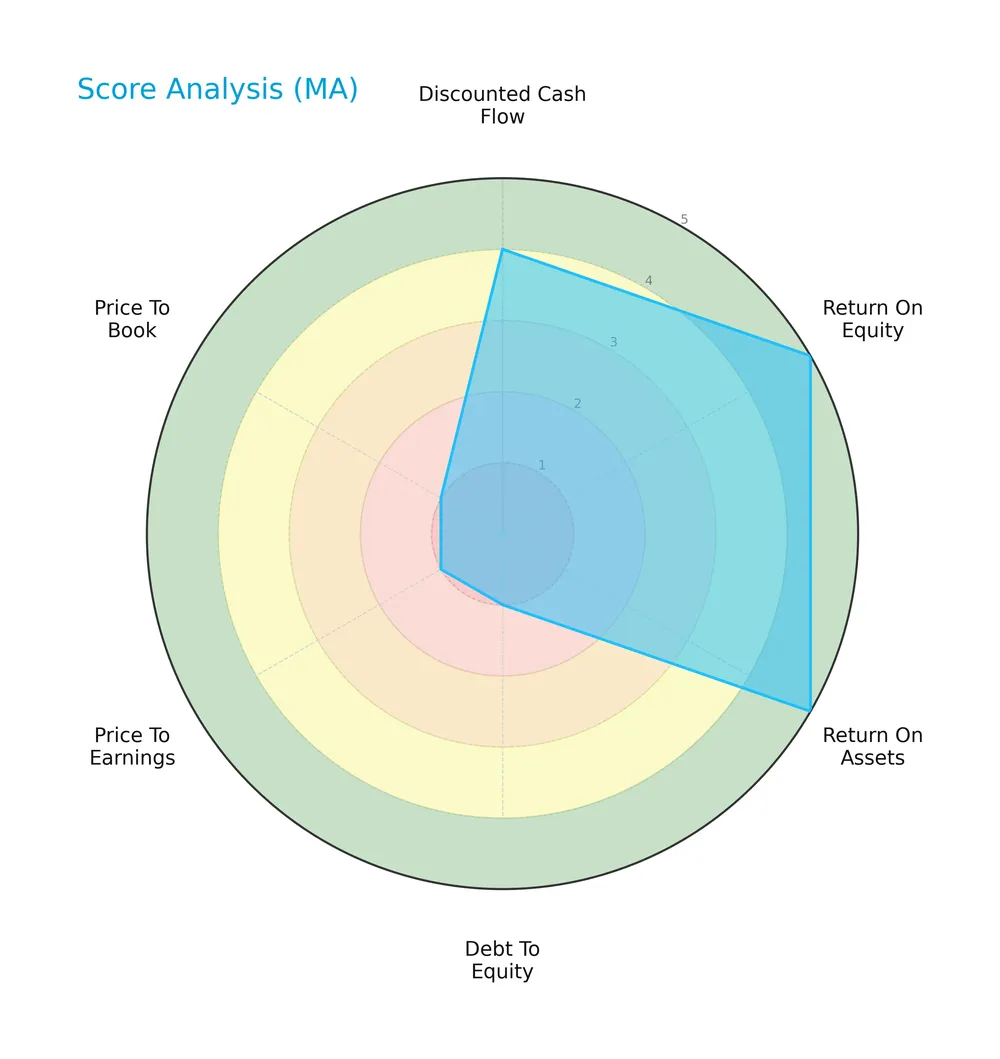
Mastercard scores very favorably on return on equity and assets (both 5), and discounted cash flow (4). However, valuation and leverage indicators are very unfavorable, with debt-to-equity, price-to-earnings, and price-to-book scores at 1.
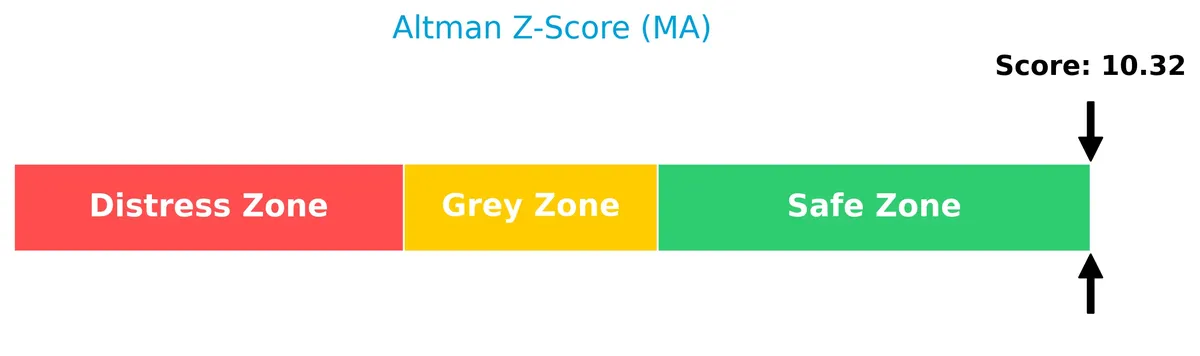
Analysis of the company’s bankruptcy risk
Mastercard’s Altman Z-Score indicates a very strong financial position, placing the company well within the safe zone:
Is the company in good financial health?
The Piotroski Score diagram highlights Mastercard’s robust financial health and operational efficiency:

With a Piotroski Score of 8, Mastercard demonstrates very strong financial strength, signaling solid profitability, liquidity, and low financial distress risk.
Competitive Landscape & Sector Positioning
This analysis examines Mastercard Incorporated’s strategic positioning within the financial services sector. It explores the company’s revenue by segment, key products, main competitors, and competitive advantages. I will assess whether Mastercard holds a sustainable competitive advantage over its peers.
Strategic Positioning
Mastercard maintains a diversified portfolio, splitting revenue between its core Payment Network (17.3B in 2024) and growing Value-Added Services (10.8B). Geographically, it balances exposure with strong international markets (15.8B) and significant North American revenue (12.4B), reflecting a broad global footprint.
Revenue by Segment
This pie chart illustrates Mastercard’s revenue distribution by segment for the full fiscal year 2024, highlighting the relative scale of its core business lines.
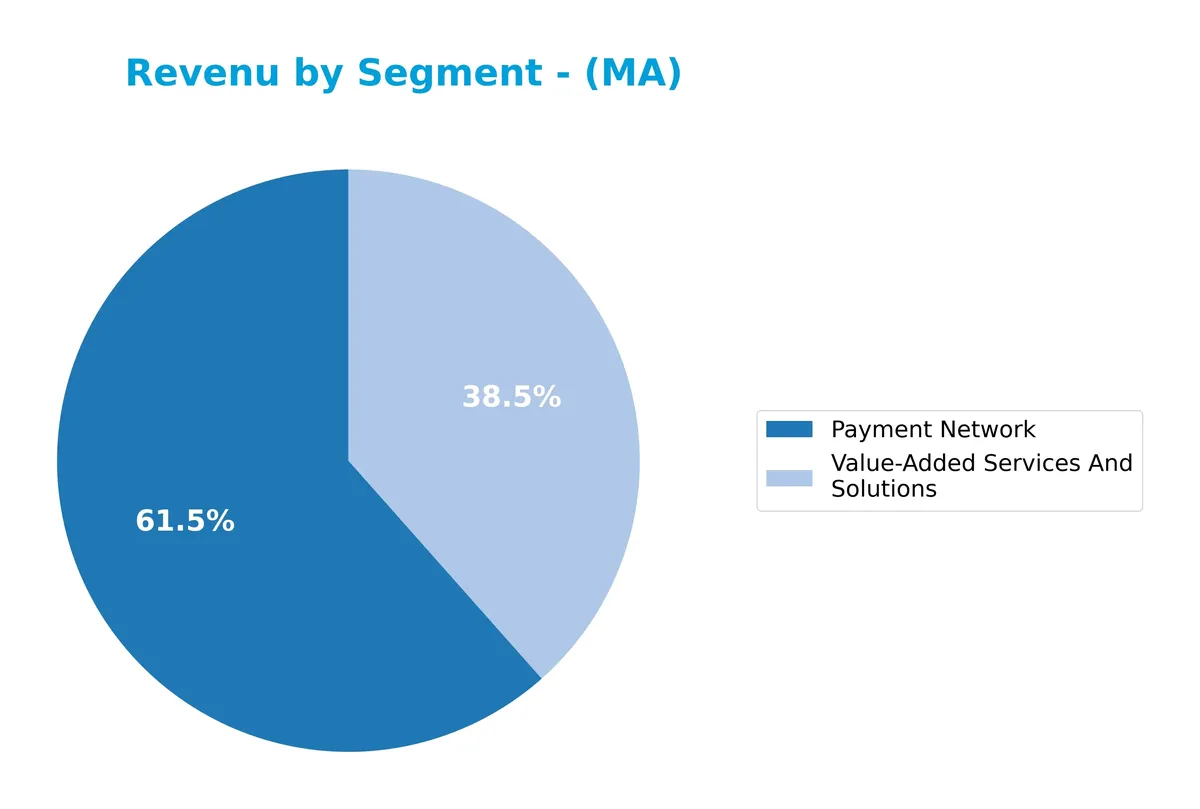
Mastercard’s Payment Network segment dominates with $17.3B in revenue, reflecting its critical role as the main driver of growth. Value-Added Services and Solutions contribute $10.8B, showing strong expansion and diversification. The business increasingly concentrates on these high-margin segments, signaling accelerated momentum and reduced reliance on legacy fee structures. This trend underscores Mastercard’s strategic evolution in payments technology and service innovation.
Key Products & Brands
The table below outlines Mastercard’s main products and services with their descriptions:
| Product | Description |
|---|---|
| Payment Network | Core payment processing including authorization, clearing, and settlement of transactions globally. |
| Value-Added Services and Solutions | Services such as cyber and intelligence solutions, analytics, consulting, loyalty programs, and digital identity. |
| MasterCard | The primary global brand for credit, debit, and prepaid payment products and solutions. |
| Maestro | Debit card brand enabling electronic payments worldwide. |
| Cirrus | Global ATM network allowing access to funds from deposit accounts. |
Mastercard focuses on scalable payment networks and value-added services. Its brands support diverse financial transactions, enhancing both consumer and merchant experiences worldwide.
Main Competitors
The sector includes 6 competitors; the table below lists the top 6 leaders by market capitalization:
| Competitor | Market Cap. |
|---|---|
| Visa Inc. | 672B |
| Mastercard Incorporated | 506B |
| American Express Company | 260B |
| Capital One Financial Corporation | 158B |
| PayPal Holdings, Inc. | 54B |
| Synchrony Financial | 32B |
Mastercard ranks 2nd among its 6 main competitors, holding 71% of Visa’s market cap. It stands above both the average market cap of the top 10 competitors (280B) and the sector median (209B). Mastercard leads American Express by a significant 40%, illustrating a strong position in the financial credit services industry.
Comparisons with competitors
Check out how we compare the company to its competitors:
Does Mastercard have a competitive advantage?
Mastercard demonstrates a clear competitive advantage, evidenced by a very favorable moat rating and a ROIC exceeding WACC by over 41%. The company shows a growing ROIC trend of nearly 45%, indicating sustained value creation and efficient capital use.
Looking ahead, Mastercard’s expansion into open banking, digital identity platforms, and value-added cyber and analytics services presents significant growth opportunities. Its strong foothold across international markets supports continued diversification and revenue growth beyond North America.
SWOT Analysis
This SWOT analysis highlights Mastercard’s core competitive position and challenges to guide strategic priorities.
Strengths
- strong global brand
- high ROIC far above WACC
- diversified payment solutions platform
Weaknesses
- elevated debt-to-equity ratio
- high valuation multiples
- net margin growth slightly negative
Opportunities
- expanding digital payments market
- growth in international markets
- innovation in open banking and cybersecurity
Threats
- intense competition from fintech disruptors
- regulatory scrutiny on fees
- macroeconomic volatility impacting transaction volumes
Mastercard’s strong moat and profitability support long-term value creation. However, its high leverage and valuation warrant caution. Strategic focus on innovation and global expansion can offset competitive and regulatory risks.
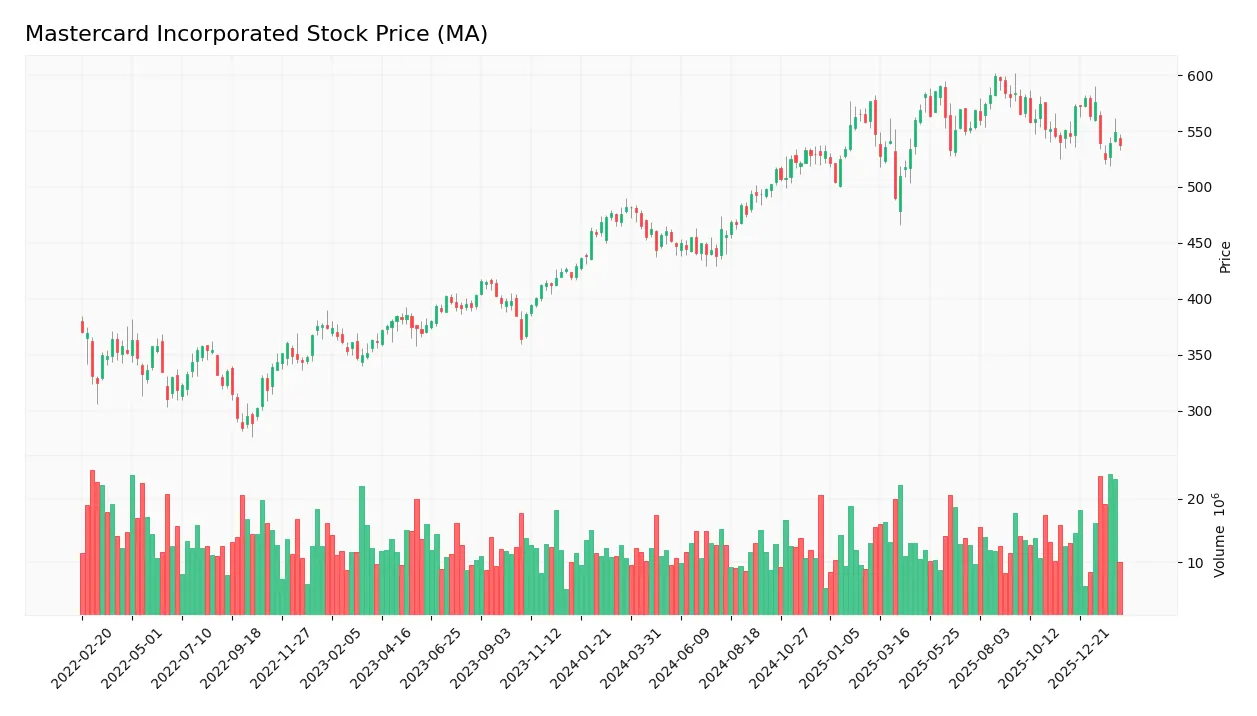
Stock Price Action Analysis
The weekly stock chart of Mastercard Incorporated displays price movements and volatility trends over the past 12 months:
Trend Analysis
Over the past 12 months, Mastercard’s stock rose 11.58%, indicating a bullish trend despite deceleration. The price ranged between 438.18 and 598.96. Recent three-month data shows a -2.37% decline, signaling a minor bearish correction with moderate volatility (std dev 17.17).
Volume Analysis
Trading volume has increased recently, with buyer volume at 115M versus seller volume at 74M, showing 60.77% buyer dominance. This buyer-driven activity suggests growing investor interest and positive market participation.
Target Prices
Analysts set a solid target consensus for Mastercard, signaling strong confidence in its growth prospects.
| Target Low | Target High | Consensus |
|---|---|---|
| 610 | 739 | 667 |
The target range reflects bullish sentiment, with a consensus price suggesting a meaningful upside from current levels.

Don’t Let Luck Decide Your Entry Point
Optimize your entry points with our advanced ProRealTime indicators. You’ll get efficient buy signals with precise price targets for maximum performance. Start outperforming now!
Analyst & Consumer Opinions
This section examines Mastercard Incorporated’s recent analyst ratings and consumer feedback to gauge market sentiment and reputation.
Stock Grades
Here are the latest verified stock grades for Mastercard Incorporated from reputable financial institutions:
| Grading Company | Action | New Grade | Date |
|---|---|---|---|
| JP Morgan | Maintain | Overweight | 2026-01-30 |
| RBC Capital | Maintain | Outperform | 2026-01-30 |
| Morgan Stanley | Maintain | Overweight | 2026-01-30 |
| Macquarie | Maintain | Outperform | 2026-01-30 |
| Raymond James | Maintain | Outperform | 2026-01-30 |
| TD Cowen | Maintain | Buy | 2026-01-30 |
| Wells Fargo | Maintain | Overweight | 2026-01-30 |
| Compass Point | Upgrade | Buy | 2026-01-13 |
| HSBC | Upgrade | Buy | 2025-12-08 |
| Tigress Financial | Maintain | Strong Buy | 2025-11-06 |
The consensus reveals a strong positive bias, with multiple firms maintaining or upgrading to buy and outperform ratings. The absence of sell ratings underscores broad institutional confidence.
Consumer Opinions
Mastercard consistently earns praise for its seamless payment solutions and global acceptance, yet some users voice concerns over fees and customer service responsiveness.
| Positive Reviews | Negative Reviews |
|---|---|
| “Easy to use worldwide with fast transactions.” | “High fees on some transactions.” |
| “Excellent fraud protection and security features.” | “Customer support is slow to respond.” |
| “Reliable payment processing with minimal downtime.” | “Occasional issues with disputed charges.” |
Overall, consumers appreciate Mastercard’s reliability and security. However, recurring complaints about fees and customer service suggest areas needing improvement.
Risk Analysis
Below is a summary table of Mastercard’s key risks, detailing their probability and potential impact:
| Category | Description | Probability | Impact |
|---|---|---|---|
| Valuation Risk | High P/E (34.2) and P/B (66.2) ratios signal potential overvaluation compared to sector averages. | High | High |
| Leverage Risk | Debt-to-equity ratio of 2.46 is elevated, increasing financial risk during economic downturns. | Medium | Medium |
| Dividend Yield | Low dividend yield (0.54%) may deter income-focused investors in a rising interest rate environment. | Medium | Low |
| Market Volatility | Beta of 0.82 suggests moderate sensitivity to market swings, slightly cushioning downside risk. | Medium | Medium |
| Competitive Risk | Intense competition in payment processing could pressure margins despite current strong moat. | Medium | High |
Mastercard’s valuation is the most critical risk. Its lofty multiples exceed those of the broader S&P 500, implying limited margin for error. Elevated leverage also raises caution, especially if economic conditions worsen. However, its strong Altman Z-Score (10.3) and robust Piotroski score (8) confirm solid financial health. I believe investors should weigh these risks against Mastercard’s high returns on equity (193%) and capital (49%), which historically support premium valuations.
Should You Buy Mastercard Incorporated?
Mastercard appears to be a robust value creator with a durable moat, evidenced by a growing ROIC well above WACC. Despite a challenging leverage profile flagged by unfavorable debt metrics, its overall B rating suggests a very favorable financial status.
Strength & Efficiency Pillars
Mastercard Incorporated exhibits robust profitability, with a net margin of 45.65% and an exceptional return on equity of 193.46%. The company’s return on invested capital (48.63%) significantly exceeds its weighted average cost of capital (7.46%), confirming Mastercard as a clear value creator. Operational efficiencies also shine through a strong EBIT margin of 58.1% and favorable interest coverage of 26.39, underscoring effective capital allocation and financial discipline. This combination of high margins and efficient capital use signals sustainable competitive advantages.
Weaknesses and Drawbacks
Despite strong fundamentals, Mastercard faces valuation headwinds with a lofty price-to-earnings ratio of 34.21 and an extreme price-to-book ratio of 66.19, indicating a premium price that may limit upside. The company’s debt-to-equity ratio stands at 2.46, flagged as unfavorable, raising concerns about leverage and potential financial flexibility. While liquidity ratios remain neutral to favorable, the modest current ratio of 1.03 warrants monitoring. These elevated multiples and leverage levels increase risk, especially if growth slows or market sentiment shifts.
Our Final Verdict about Mastercard Incorporated
Mastercard’s long-term fundamentals appear highly attractive, supported by strong profitability and value creation metrics. The overall bullish stock trend, combined with a recent buyer-dominant phase (60.77%), suggests positive investor sentiment. However, the current premium valuation and leverage caution imply that prospective investors might consider a wait-and-see approach for improved entry points. The profile may appear suitable for investors seeking growth but requires careful risk management given elevated multiples.
Disclaimer: This content is for informational purposes only and does not constitute financial, investment, or other professional advice. Investing in financial markets involves a significant risk of loss, and past performance is not indicative of future results.
Additional Resources
- Mastercard Incorporated $MA Shares Sold by Jensen Investment Management Inc. – MarketBeat (Feb 11, 2026)
- Mastercard Inc SEC 10-K Report – TradingView (Feb 11, 2026)
- Here’s What Analysts Are Saying About Mastercard Incorporated (MA) Post Earnings – Yahoo Finance (Feb 03, 2026)
- Mastercard Incorporated (NYSE:MA) Plans Quarterly Dividend of $0.87 – MarketBeat (Feb 11, 2026)
- Strong top-line growth drives analyst sentiment on Mastercard (MA) – MSN (Feb 08, 2026)
For more information about Mastercard Incorporated, please visit the official website: mastercard.com