Home > Analyses > Industrials > Masco Corporation
Masco Corporation transforms everyday living spaces with innovative home improvement and building products. It commands leadership through iconic brands like Delta and Behr, reshaping plumbing, paint, and decorative hardware markets. Masco’s reputation for quality and broad product portfolio drives deep customer loyalty and market influence. As the construction sector evolves, I explore whether Masco’s fundamentals sustain its current valuation and growth outlook in a competitive landscape.

Table of contents
Business Model & Company Overview
Masco Corporation, founded in 1929 and headquartered in Livonia, Michigan, leads the construction industry with a diverse ecosystem of home improvement and building products. Its portfolio spans plumbing fixtures, decorative architectural products, and specialty coatings, unified under well-known brands like DELTA, BEHR, and KILZ. This broad offering supports both residential and commercial markets, emphasizing innovation and quality to maintain a dominant market position.
Masco’s revenue engine balances durable hardware sales with recurring demand for coatings and decorative products. It sells through wholesalers, home centers, and online retailers across the Americas, Europe, and Asia, ensuring global reach. Its integrated product lines and brand strength create a durable economic moat, positioning Masco as a key architect in shaping the future of home improvement worldwide.
Financial Performance & Fundamental Metrics
I analyze Masco Corporation’s income statement, key financial ratios, and dividend payout policy to assess its core profitability and shareholder value creation.
Income Statement
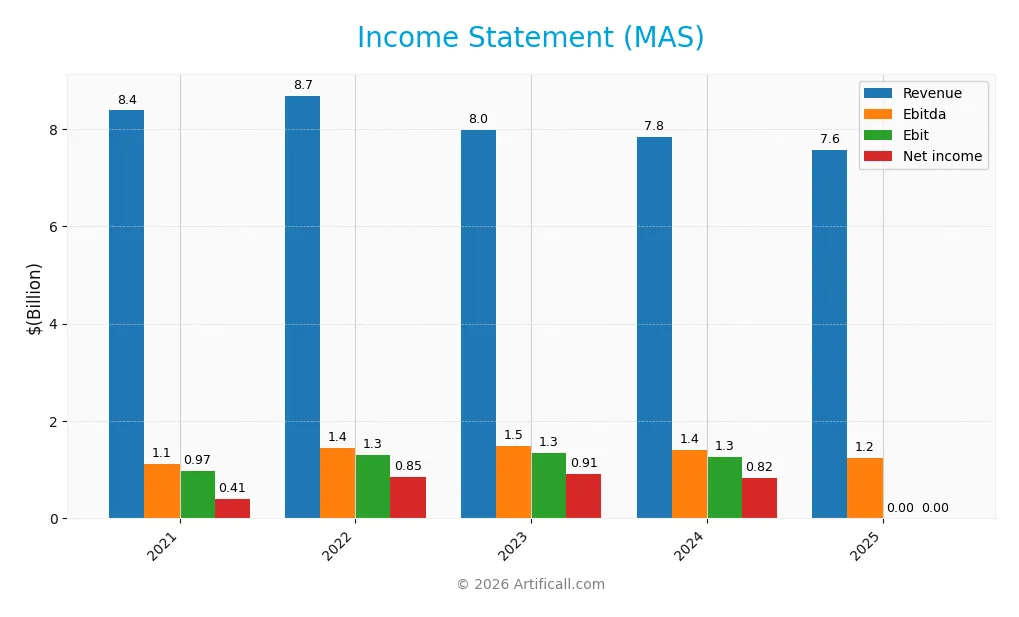
The table below presents Masco Corporation’s key income statement figures for fiscal years 2021 through 2025, reflecting its revenue and profitability trends.
| 2021 | 2022 | 2023 | 2024 | 2025 | |
|---|---|---|---|---|---|
| Revenue | 8.38B | 8.68B | 7.97B | 7.83B | 7.56B |
| Cost of Revenue | 5.51B | 5.97B | 5.13B | 4.99B | 4.88B |
| Operating Expenses | 1.46B | 1.42B | 1.49B | 1.47B | 1.43B |
| Gross Profit | 2.86B | 2.71B | 2.84B | 2.83B | 2.68B |
| EBITDA | 1.12B | 1.45B | 1.49B | 1.41B | 1.25B |
| EBIT | 966M | 1.30B | 1.34B | 1.26B | 0 |
| Interest Expense | 278M | 108M | 106M | 99M | 0 |
| Net Income | 408M | 846M | 908M | 822M | 0 |
| EPS | 1.63 | 3.65 | 4.04 | 3.77 | 0 |
| Filing Date | 2022-02-08 | 2023-02-09 | 2024-02-08 | 2025-02-11 | 2026-02-10 |
Income Statement Evolution
Over 2021-2025, Masco Corporation’s revenue declined by 9.7%, slipping from $8.4B to $7.6B. Gross profit followed suit, dropping by 5.4% over one year to $2.7B in 2025. Meanwhile, gross margins remained relatively stable at 35.4%. However, net income and EBIT plummeted to zero in 2025, marking a sharp deterioration in profitability and margin stability.
Is the Income Statement Favorable?
Masco’s 2025 income statement reveals unfavorable fundamentals. Despite a solid gross margin of 35.4%, the company reported zero EBIT and net income, a stark contrast to prior years. Interest expenses vanished, but this did not translate into profitability. The revenue contraction and margin collapse signal operational or structural challenges that undermine earnings quality and sustainability.
Financial Ratios
The table below presents key financial ratios for Masco Corporation (MAS) over the fiscal years 2021 to 2025, reflecting profitability, valuation, liquidity, leverage, efficiency, and dividend metrics:
| Ratios | 2021 | 2022 | 2023 | 2024 | 2025 |
|---|---|---|---|---|---|
| Net Margin | 4.9% | 9.7% | 11.4% | 10.5% | 0% |
| ROE | -2.3% | -1.8% | -7.2% | -2.9% | 0% |
| ROIC | 26.5% | 27.8% | 28.1% | 29.3% | 0% |
| P/E | 42.9 | 12.7 | 16.6 | 19.2 | 0 |
| P/B | -97.7 | -22.5 | -119.6 | -56.5 | 0 |
| Current Ratio | 1.76 | 1.56 | 1.68 | 1.75 | 0 |
| Quick Ratio | 1.14 | 0.91 | 1.08 | 1.15 | 0 |
| D/E | -17.7 | -7.2 | -25.8 | -11.5 | 0 |
| Debt-to-Assets | 57% | 66% | 61% | 64% | 0% |
| Interest Coverage | 5.1 | 12.0 | 12.7 | 13.8 | 0 |
| Asset Turnover | 1.50 | 1.67 | 1.49 | 1.56 | 0 |
| Fixed Asset Turnover | 7.73 | 6.99 | 5.73 | 5.81 | 0 |
| Dividend Yield | 1.21% | 2.39% | 1.71% | 1.61% | 0% |
Note: Zero values in 2025 indicate unavailable or unreported data for that year. Negative P/B and D/E ratios reflect negative equity or accounting nuances.
Evolution of Financial Ratios
Masco Corporation’s Return on Equity (ROE) declined to 0% in 2025 from negative values in previous years, indicating deteriorating profitability. The Current Ratio fell to 0, signaling worsening liquidity, while the Debt-to-Equity Ratio remained at 0, reflecting an unusual or non-disclosed capital structure. Profitability margins showed a sharp drop in 2025, breaking prior stability.
Are the Financial Ratios Fovorable?
In 2025, Masco’s financial ratios present a predominantly unfavorable picture. Profitability ratios like net margin, ROE, and ROIC stand at 0%, raising red flags. Liquidity ratios such as current and quick ratios are also unfavorable. However, debt-related metrics, including debt-to-equity and debt-to-assets ratios, are favorable. Efficiency and market value ratios remain weak, contributing to an overall unfavorable assessment.
Shareholder Return Policy
Masco Corporation maintains a consistent dividend policy with a payout ratio near 30%, yielding around 1.6%. Dividends per share have grown steadily, supported by free cash flow coverage and moderate share buybacks.
This balanced approach aligns with sustainable long-term value creation by preserving capital for operations and investment while rewarding shareholders. The policy reflects prudent capital allocation amid varying profit margins.
Score analysis
The radar chart below illustrates Masco Corporation’s key financial scores across several valuation and performance metrics:
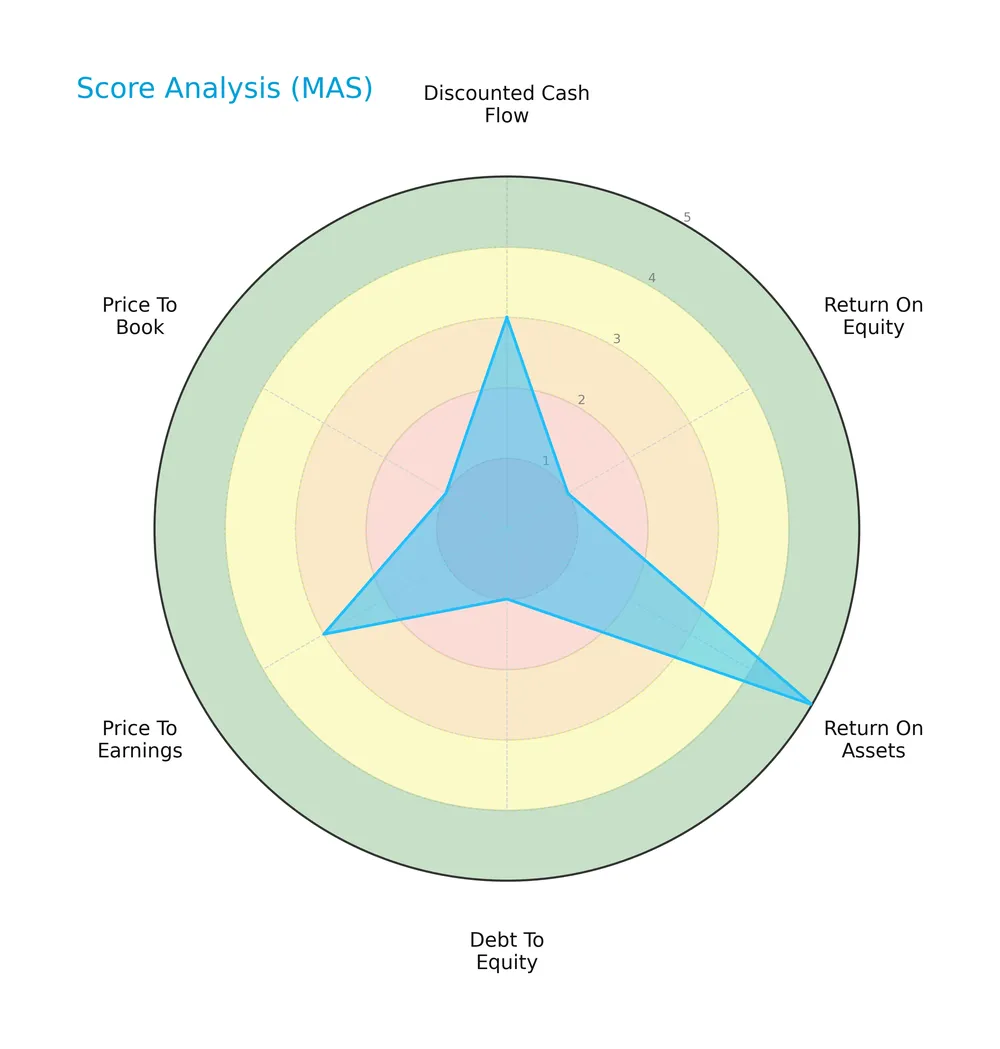
Masco’s discounted cash flow and price-to-earnings scores register moderate levels, reflecting a fair valuation. However, return on equity, debt to equity, and price to book scores are very unfavorable, indicating challenges in profitability and leverage. Return on assets stands out as very favorable, suggesting effective asset use despite other weaknesses.
Analysis of the company’s bankruptcy risk
Masco’s Altman Z-Score places it comfortably in the safe zone, indicating a low probability of bankruptcy and strong financial stability:

Is the company in good financial health?
The Piotroski Score diagram offers a snapshot of Masco’s financial health based on nine key criteria:

With a score of 6, Masco falls into the average category, suggesting moderate financial strength. This implies the company maintains reasonable profitability and efficiency, though there is room for improvement to reach a stronger financial position.
Competitive Landscape & Sector Positioning
This analysis explores Masco Corporation’s strategic positioning, revenue segments, key products, and main competitors in the construction industry. I will assess whether Masco holds a competitive advantage over its peers.
Strategic Positioning
Masco Corporation concentrates its portfolio in two main segments: Plumbing Products, generating around 5B annually, and Decorative Architectural Products, with roughly 2.6B in revenue. Geographically, it focuses heavily on North America, which accounts for nearly 79% of 2025 sales, maintaining a largely concentrated market exposure.
Revenue by Segment
This pie chart illustrates Masco Corporation’s revenue distribution by product segment for the fiscal year ending December 31, 2025.
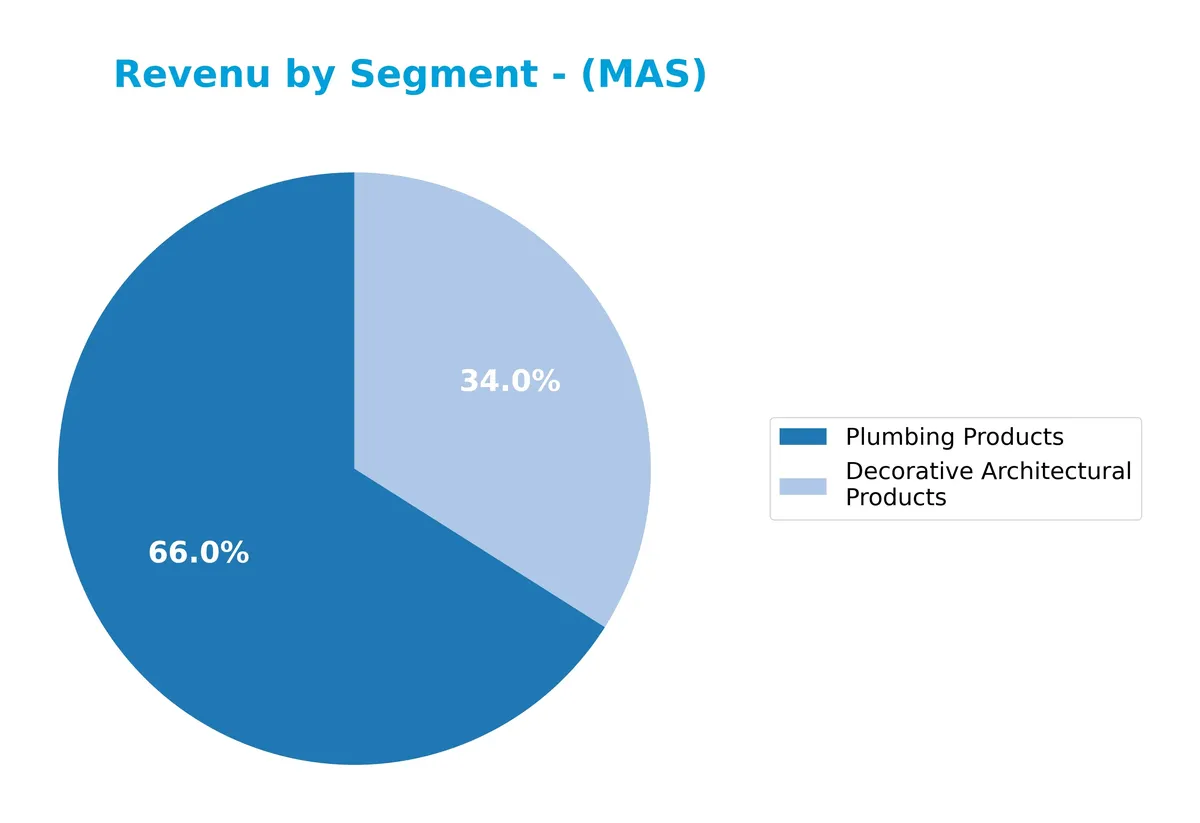
Masco’s revenue in 2025 is primarily driven by Plumbing Products at $5B, followed by Decorative Architectural Products at $2.6B. The Plumbing segment shows resilience despite slight fluctuations, while Decorative Architectural Products revenue has declined from prior years. The narrowing gap suggests a possible strategic shift or market pressures concentrating revenue in Plumbing, warranting close monitoring for concentration risk.
Key Products & Brands
Masco Corporation’s offerings span key home improvement and building product categories as follows:
| Product | Description |
|---|---|
| Plumbing Products | Faucets, showerheads, valves, bath hardware, sinks, toilets, acrylic tubs, spas, connected water products, thermoplastic solutions, PEX tubing, and other non-decorative plumbing components under brands like DELTA, BRIZO, PEERLESS, HANSGROHE, AXOR, KRAUS, and others. |
| Decorative Architectural Products | Paints, primers, stains, waterproofing products, cabinet and door hardware, decorative bath hardware, mirrors, lighting fixtures, ceiling fans, and LED lighting systems marketed under BEHR, KILZ, WHIZZ, LIBERTY, KICHLER, and ÉLAN among others. |
Masco focuses on plumbing and decorative architectural segments, generating most revenue from plumbing products. Its portfolio includes well-known brands recognized in construction and home improvement markets.
Main Competitors
The sector includes 6 competitors, with the table below listing the top 6 leaders by market capitalization:
| Competitor | Market Cap. |
|---|---|
| Trane Technologies plc | 88.3B |
| Johnson Controls International plc | 80.0B |
| Carrier Global Corporation | 45.1B |
| Lennox International Inc. | 17.5B |
| Masco Corporation | 13.4B |
| Builders FirstSource, Inc. | 11.6B |
Masco Corporation ranks 5th among its peers, with a market cap at 18.3% of the leader, Trane Technologies. The company remains below both the average market cap of the top 10 and the sector median. It holds an 8.26% market cap premium over its nearest competitor, Builders FirstSource, indicating a moderate gap above the lower tier.
Comparisons with competitors
Check out how we compare the company to its competitors:
Does MAS have a competitive advantage?
Masco Corporation does not currently present a clear competitive advantage based on available data. The company faces a declining return on invested capital trend and unfavorable income growth metrics.
Looking ahead, Masco’s diversified product portfolio across plumbing and decorative architectural segments provides opportunities to expand in North America and international markets. New product launches and market penetration could influence future competitiveness.
SWOT Analysis
This SWOT analysis highlights Masco Corporation’s key strategic factors to guide investment decisions.
Strengths
- Strong brand portfolio with diverse product lines
- Established market presence in North America
- Solid liquidity management indicated by favorable debt ratios
Weaknesses
- Declining revenue and profit margins
- Negative growth in key income metrics over 5 years
- Weak operational efficiency and profitability ratios
Opportunities
- Expansion in international markets
- Increasing demand for home improvement products
- Innovation in connected and sustainable product lines
Threats
- Intense competition in construction sector
- Economic slowdown affecting housing market
- Rising raw material and labor costs
Masco’s strong brand and market foothold face pressure from declining profitability and growth. Strategic focus should prioritize operational efficiency and international expansion to mitigate sector headwinds.
Stock Price Action Analysis
The weekly stock chart for Masco Corporation illustrates price movements and key levels over the past 12 months:
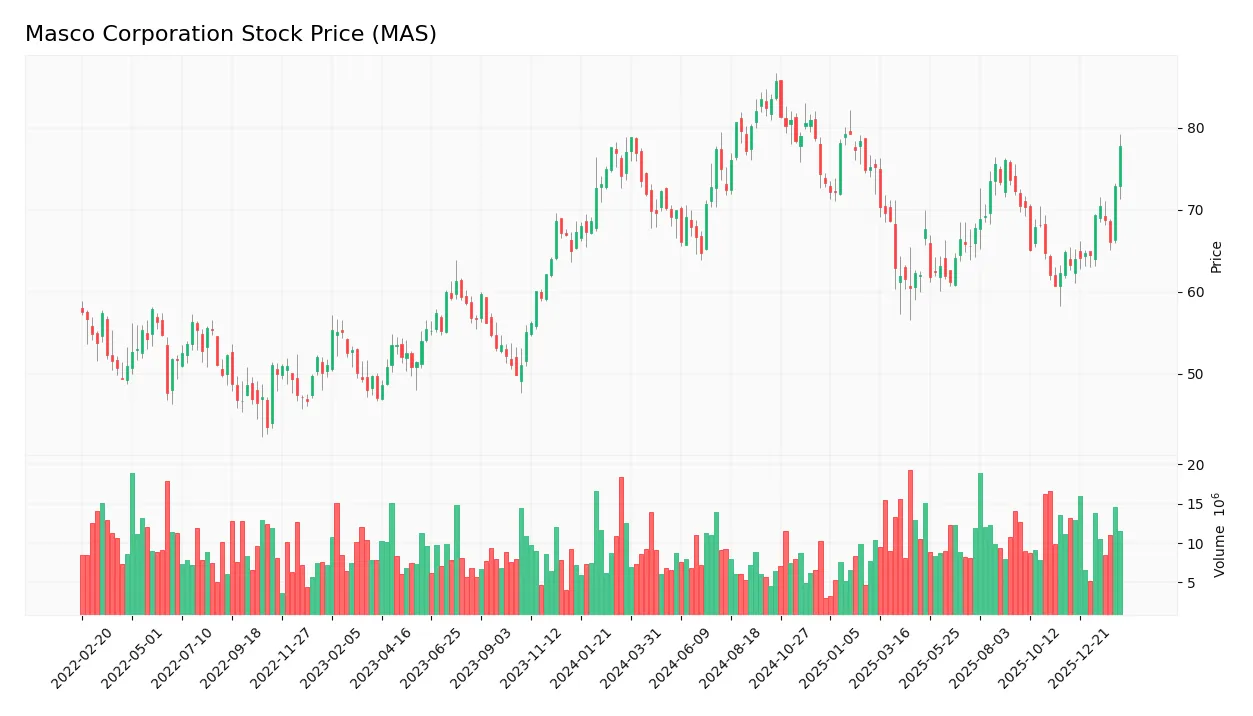
Trend Analysis
Over the past 12 months, MAS stock rose 0.93%, indicating a bullish trend by a narrow margin. The price accelerated, hitting a high of 85.71 and a low of 60.42, with a standard deviation of 6.52, reflecting moderate volatility.
Volume Analysis
In the last three months, trading volume increased with strong buyer dominance at 72%, signaling robust market participation and positive investor sentiment. Buyer volume significantly exceeded seller volume, confirming demand-driven activity.
Target Prices
Analysts set a clear target consensus for Masco Corporation, reflecting moderate upside potential.
| Target Low | Target High | Consensus |
|---|---|---|
| 67 | 84 | 77 |
The target range suggests analysts expect steady growth, with a consensus price around $77, indicating confidence in Masco’s strategic positioning.

Don’t Let Luck Decide Your Entry Point
Optimize your entry points with our advanced ProRealTime indicators. You’ll get efficient buy signals with precise price targets for maximum performance. Start outperforming now!
Analyst & Consumer Opinions
This section examines analyst ratings and consumer feedback to provide insight into Masco Corporation’s market perception.
Stock Grades
Here are the recent verified analyst grades for Masco Corporation from respected financial institutions:
| Grading Company | Action | New Grade | Date |
|---|---|---|---|
| Wells Fargo | Maintain | Overweight | 2026-01-14 |
| Citigroup | Maintain | Neutral | 2026-01-08 |
| Wells Fargo | Upgrade | Overweight | 2025-12-15 |
| Barclays | Downgrade | Equal Weight | 2025-12-08 |
| Argus Research | Maintain | Buy | 2025-11-05 |
| Wells Fargo | Maintain | Equal Weight | 2025-10-30 |
| Barclays | Maintain | Overweight | 2025-10-30 |
| Evercore ISI Group | Maintain | In Line | 2025-10-30 |
| RBC Capital | Maintain | Sector Perform | 2025-10-30 |
| UBS | Maintain | Buy | 2025-10-30 |
The consensus reflects a predominantly positive outlook with a majority of buy and overweight ratings. Downgrades and neutral stances appear limited, indicating steady confidence among analysts.
Consumer Opinions
Masco Corporation inspires mixed but insightful consumer sentiment, reflecting its broad market reach and product diversity.
| Positive Reviews | Negative Reviews |
|---|---|
| “Durable products that last long.” | “Customer service response times lag.” |
| “Innovative designs that improve homes.” | “Some items arrive damaged or defective.” |
| “Good value for the quality offered.” | “Limited color options in certain lines.” |
Overall, consumers praise Masco’s product durability and innovation. However, recurring issues with customer service and product condition on delivery temper satisfaction. Addressing these could enhance brand loyalty.
Risk Analysis
Below is a summary of key risks facing Masco Corporation, with likelihood and potential impact on business and stock value:
| Category | Description | Probability | Impact |
|---|---|---|---|
| Profitability Risk | Zero net margin and ROE signal weak profitability under current conditions. | High | High |
| Liquidity Risk | Very low current and quick ratios suggest potential short-term liquidity issues. | Medium | Medium |
| Leverage Risk | Favorable debt-to-equity and debt-to-assets ratios reduce bankruptcy risk. | Low | Low |
| Operational Risk | Unfavorable asset turnover metrics indicate inefficiency in asset use. | Medium | Medium |
| Dividend Risk | Dividend yield is unfavorable, risking investor income expectations. | Medium | Medium |
I observe that Masco’s biggest concerns are its lack of profitability and poor liquidity metrics, which historically weigh heavily in the construction sector during economic slowdowns. However, a strong Altman Z-score (4.43) places the company in a safe zone regarding bankruptcy risk. Investors should watch for improvements in operational efficiency and margin recovery to mitigate downside risks.
Should You Buy Masco Corporation?
Masco Corporation appears to be a financially stable company with robust operational efficiency and manageable leverage. While its declining ROIC trend suggests a weakening moat, the company’s overall rating of B- indicates a very favorable value creation profile amid average financial strength metrics.
Strength & Efficiency Pillars
Masco Corporation operates in a safe financial zone, supported by an Altman Z-score of 4.43, which signals strong solvency. However, profitability metrics show weaknesses: net margin and ROE both stand at 0%, reflecting operational challenges. The company’s ROIC data is unavailable, preventing a clear assessment of value creation versus cost of capital. Despite this, Masco maintains a favorable gross margin of 35.43%, indicating operational efficiency in core activities.
Weaknesses and Drawbacks
Masco faces significant headwinds from multiple unfavorable metrics. The company reports unfavorable net margin and ROE, both at 0%, signaling weak profitability. Debt-to-equity and liquidity ratios are also problematic, with current and quick ratios rated unfavorable, raising concerns about short-term financial flexibility. Valuation metrics appear moderate to very unfavorable, complicating the investment narrative. These factors increase risk, especially as operational earnings growth has been negative over recent periods.
Our Final Verdict about Masco Corporation
Masco’s profile may appear attractive due to its safe solvency status and strong buyer dominance recently (71.89%). However, persistent profitability weaknesses and mixed valuation metrics suggest caution. Despite a bullish overall trend, recent operational struggles and moderate Piotroski score (6) recommend a wait-and-see approach before committing capital. The company might be suitable for investors willing to tolerate risk while monitoring for operational improvements.
Disclaimer: This content is for informational purposes only and does not constitute financial, investment, or other professional advice. Investing in financial markets involves a significant risk of loss, and past performance is not indicative of future results.
Additional Resources
- Compared to Estimates, Masco (MAS) Q4 Earnings: A Look at Key Metrics – Yahoo Finance (Feb 10, 2026)
- Masco Stock Up on Q4 Earnings Beat, Sales Miss Estimates – TradingView (Feb 10, 2026)
- Masco hits 52-week high as earnings top estimates; $2B buyback, job cuts (MAS:NYSE) – Seeking Alpha (Feb 10, 2026)
- Masco Corp (MAS) Q4 2025 Earnings Call Highlights: Navigating Challenges with Strategic Growth Initiatives – GuruFocus (Feb 10, 2026)
- Masco: Q4 Earnings Snapshot – kare11.com (Feb 10, 2026)
For more information about Masco Corporation, please visit the official website: masco.com