Home > Analyses > Technology > Marvell Technology, Inc.
Marvell Technology powers the invisible backbone of modern connectivity, shaping how data flows across the globe. Renowned for its cutting-edge semiconductor solutions, Marvell excels in Ethernet controllers, processors, and storage products that drive cloud infrastructure and enterprise systems. The company’s relentless innovation and diversified portfolio position it as a tech titan. Yet, in a fiercely competitive sector, I ask: do Marvell’s fundamentals still justify its premium valuation and growth prospects?

Table of contents
Business Model & Company Overview
Marvell Technology, Inc. designs, develops, and sells a diverse portfolio of integrated circuits that power modern data infrastructure. Founded in 1995 and headquartered in Wilmington, Delaware, Marvell leads in semiconductors through its cohesive ecosystem of Ethernet solutions, processors, ASICs, and storage controllers. The company’s products integrate analog, mixed-signal, and digital signal processing technologies to drive connectivity and data storage efficiency worldwide.
Marvell’s revenue engine balances hardware sales with embedded system solutions, focusing heavily on storage controllers and network adapters that serve global markets in the Americas, Europe, and Asia. Its presence spans key technology hubs including China, India, and Taiwan. I see Marvell’s economic moat rooted in its broad technology stack, enabling it to shape the future of data-centric industries through innovation and scale.
Financial Performance & Fundamental Metrics
I analyze Marvell Technology’s income statement, key financial ratios, and dividend payout policy to assess its operational efficiency and shareholder value creation.
Income Statement
The table below summarizes Marvell Technology, Inc.’s key income statement figures for fiscal years 2022 through 2026, reflecting its financial performance and earnings per share trends.

| 2022 | 2023 | 2024 | 2025 | 2026 | |
|---|---|---|---|---|---|
| Revenue | 4.46B | 5.92B | 5.51B | 5.77B | 8.19B |
| Cost of Revenue | 2.40B | 2.93B | 3.21B | 3.39B | 4.01B |
| Operating Expenses | 2.41B | 2.75B | 2.86B | 3.10B | 2.86B |
| Gross Profit | 2.06B | 2.99B | 2.29B | 2.38B | 4.18B |
| EBITDA | 901M | 1.65B | 851M | 652M | 2.63B |
| EBIT | -344M | 256M | -547M | -705M | 1.34B |
| Interest Expense | 139M | 171M | 212M | 189M | 203M |
| Net Income | -421M | -164M | -933M | -885M | 2.67B |
| EPS | -0.53 | -0.19 | -1.08 | -1.02 | 3.10 |
| Filing Date | 2022-03-10 | 2023-03-09 | 2024-03-13 | 2025-03-12 | 2026-03-11 |
Income Statement Evolution
Marvell Technology’s revenue climbed 84% from 2022 to 2026, accelerating notably with a 42% jump in the latest year. Net income surged dramatically by over 700% across the period, turning positive after several years of losses. Gross and net margins expanded significantly, reflecting improved profitability and operational leverage.
Is the Income Statement Favorable?
The 2026 income statement shows strong fundamentals. Gross margin stands at a robust 51%, while EBIT margin recovered to 16%, marking a sharp turnaround from prior losses. Net margin at 33% highlights efficient cost control and favorable capital allocation. Interest expense remains low relative to revenue, underscoring prudent financial management. Overall, the income metrics indicate a solid financial position.
Financial Ratios
The following table summarizes Marvell Technology, Inc.’s key financial ratios from 2022 to 2026 to provide a clear view of its performance trends:
| Ratios | 2022 | 2023 | 2024 | 2025 | 2026 |
|---|---|---|---|---|---|
| Net Margin | -9.4% | -2.8% | -17.0% | -15.3% | 32.6% |
| ROE | -2.7% | -1.0% | -6.3% | -6.6% | 18.7% |
| ROIC | -1.5% | -2.2% | -2.9% | -3.9% | 6.0% |
| P/E | -135.1x | -224.7x | -62.5x | -110.4x | 25.4x |
| P/B | 3.62x | 2.35x | 3.93x | 7.27x | 4.75x |
| Current Ratio | 1.80 | 1.37 | 1.69 | 1.54 | 2.01 |
| Quick Ratio | 1.28 | 0.93 | 1.21 | 1.03 | 1.58 |
| D/E | 0.30 | 0.30 | 0.30 | 0.32 | 0.31 |
| Debt-to-Assets | 21.4% | 21.0% | 20.7% | 21.5% | 20.1% |
| Interest Coverage | -2.5x | 1.4x | -2.7x | -3.8x | 6.6x |
| Asset Turnover | 0.20 | 0.26 | 0.26 | 0.29 | 0.37 |
| Fixed Asset Turnover | 7.38x | 7.51x | 5.74x | 5.56x | 8.76x |
| Dividend Yield | 0.34% | 0.56% | 0.35% | 0.21% | 0.30% |
Evolution of Financial Ratios
Marvell Technology’s Return on Equity (ROE) improved significantly, reaching 18.66% in 2026 after years of negative returns. The Current Ratio steadily increased to 2.01, indicating enhanced liquidity. The Debt-to-Equity Ratio remained stable around 0.31, reflecting consistent leverage management. Profitability shifted from negative margins to a robust 32.58% net margin in 2026.
Are the Financial Ratios Favorable?
In 2026, Marvell shows a favorable liquidity position with a current ratio of 2.01 and a quick ratio of 1.58. Leverage metrics, including debt-to-equity at 0.31 and interest coverage at 6.61, are also favorable. Profitability is strong with a 32.58% net margin and 18.66% ROE. However, valuation ratios like P/E at 25.45 and P/B at 4.75 appear unfavorable, while asset turnover at 0.37 is low. Overall, the financial ratios lean favorable with some valuation concerns.
Shareholder Return Policy
Marvell Technology maintains a modest dividend payout ratio near 7.7%, with dividends per share stable around $0.24. The annual dividend yield hovers around 0.3%, supported by consistent free cash flow coverage and occasional share buybacks, reflecting disciplined capital allocation.
This balanced approach avoids excessive distributions or buybacks, supporting long-term shareholder value. Maintaining dividend payments alongside prudent buybacks signals a sustainable return policy aligned with Marvell’s profitability and cash flow generation.
Score analysis
The radar chart below illustrates the company’s key financial scores across various valuation and profitability metrics:

Marvell Technology scores very favorably on returns, with ROE and ROA at 5. However, its leverage and valuation metrics lag, showing unfavorable scores of 2 in debt-to-equity, P/E, and P/B ratios. Overall, the profile is moderate.
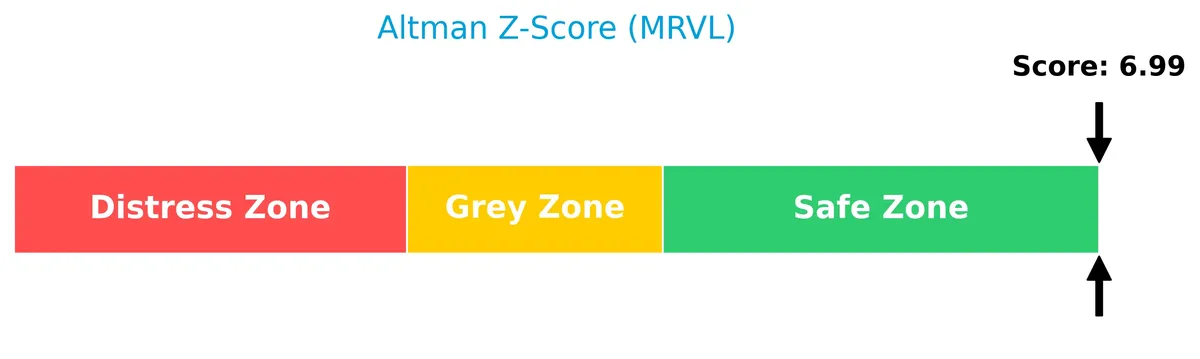
Analysis of the company’s bankruptcy risk
The Altman Z-Score places the company well within the safe zone, indicating a low risk of bankruptcy and strong financial stability:
Is the company in good financial health?
The Piotroski Score diagram highlights the company’s financial health based on profitability, leverage, and efficiency criteria:

With a score of 6, Marvell Technology demonstrates average financial strength. This suggests reasonable stability but room for improvement compared to stronger peers.
Competitive Landscape & Sector Positioning
This analysis explores Marvell Technology’s strategic positioning within the semiconductor sector, including revenue segmentation and product offerings. I will assess whether Marvell holds a competitive advantage over its main rivals based on these factors.
Strategic Positioning
Marvell Technology concentrates heavily on data center products, generating $6.1B in 2026, while maintaining smaller segments in automotive, carrier infrastructure, consumer, and enterprise networking. Geographically, it diversifies across China ($3B), Taiwan ($1.7B), the US ($1.2B), and other countries ($2.4B), reflecting a balanced global footprint.
Revenue by Segment
This pie chart illustrates Marvell Technology’s revenue distribution across key product segments for fiscal year 2026, highlighting shifts over recent years.

Data Center dominates Marvell’s revenue with $6.1B in 2026, showing strong acceleration from $4.2B in 2025. Other segments like Automotive, Carrier Infrastructure, and Consumer are either absent or significantly smaller this year, suggesting increasing concentration risk. Historically, these smaller segments contributed hundreds of millions, but the latest data indicates a strategic focus on Data Center, reflecting the company’s capital allocation toward high-margin growth drivers.
Key Products & Brands
Marvell Technology offers a diversified portfolio of semiconductor products across several key sectors:
| Product | Description |
|---|---|
| Ethernet Solutions | Includes controllers, network adapters, physical transceivers, and switches for data communication. |
| Processors | Single or multiple core processors, ASICs, and application processors for various applications. |
| Storage Controllers | Controllers for HDDs and SSDs supporting SAS, SATA, PCIe, NVMe, and NVMe over fabrics interfaces. |
| Fiber Channel Products | Host bus adapters and controllers for server and storage system connectivity. |
| Data Center Products | Semiconductor solutions primarily targeting data center infrastructure, generating $6.1B in 2026. |
| Enterprise Networking | Network components serving enterprise environments, with $626M revenue in 2025. |
| Carrier Infrastructure | Products supporting telecommunications infrastructure, $338M in revenue in 2025. |
| Automotive & Industrial | Semiconductor products for automotive and industrial applications, $322M revenue in 2025. |
| Consumer Electronics | Chips designed for consumer devices, contributing $316M in revenue in 2025. |
Marvell’s product mix spans essential semiconductor categories, with a dominant focus on data center solutions and expanding presence in networking, automotive, and consumer markets.
Main Competitors
Marvell Technology, Inc. competes among 38 companies in the semiconductor sector, with the table below showing the top 10 leaders by market capitalization:
| Competitor | Market Cap. |
|---|---|
| NVIDIA Corporation | 4.6T |
| Broadcom Inc. | 1.6T |
| Taiwan Semiconductor Manufacturing Company Limited | 1.6T |
| ASML Holding N.V. | 415B |
| Advanced Micro Devices, Inc. | 363B |
| Micron Technology, Inc. | 353B |
| Lam Research Corporation | 232B |
| Applied Materials, Inc. | 214B |
| QUALCOMM Incorporated | 185B |
| Intel Corporation | 173B |
Marvell Technology ranks 15th among 38 semiconductor peers, with a market cap at 1.8% of NVIDIA’s, the sector leader. It sits below the average top-10 market cap of $975B but remains above the sector median of $31B. The company enjoys a 39.15% market cap gap from its closest larger rival, highlighting a meaningful scale difference.
Comparisons with competitors
Check out how we compare the company to its competitors:
Does Marvell Technology have a competitive advantage?
Marvell Technology currently does not present a strong competitive advantage, as its ROIC remains below WACC, indicating value destruction despite improving profitability. The company’s margin and revenue growth are favorable, but it still sheds value relative to its capital cost.
Looking ahead, Marvell’s expanding product portfolio in Ethernet solutions, processors, and storage controllers offers growth opportunities across diverse geographic markets. Its growing ROIC trend suggests potential for future value creation if operational efficiency continues improving.
SWOT Analysis
This SWOT analysis distills Marvell Technology’s core strategic position by highlighting its internal capabilities and external challenges.
Strengths
- strong revenue growth of 42% YoY
- robust net margin at 32.6%
- diversified global presence with leading market share
Weaknesses
- ROIC below WACC signals value destruction
- relatively high PE and PB ratios suggest valuation risk
- low dividend yield may deter income investors
Opportunities
- expansion in high-growth Asian markets
- rising demand for advanced semiconductor solutions
- potential to improve ROIC and capital efficiency
Threats
- intense competition in semiconductor industry
- supply chain disruptions in Asia
- macroeconomic uncertainties impacting tech spending
Marvell’s strengths in profitability and growth provide a solid foundation. However, its value destruction warns of inefficient capital use. Strategic focus should target operational efficiency and market expansion to mitigate valuation and competitive risks.
Stock Price Action Analysis
The weekly stock chart for Marvell Technology, Inc. (MRVL) illustrates price movements and trend dynamics over the past 12 months:
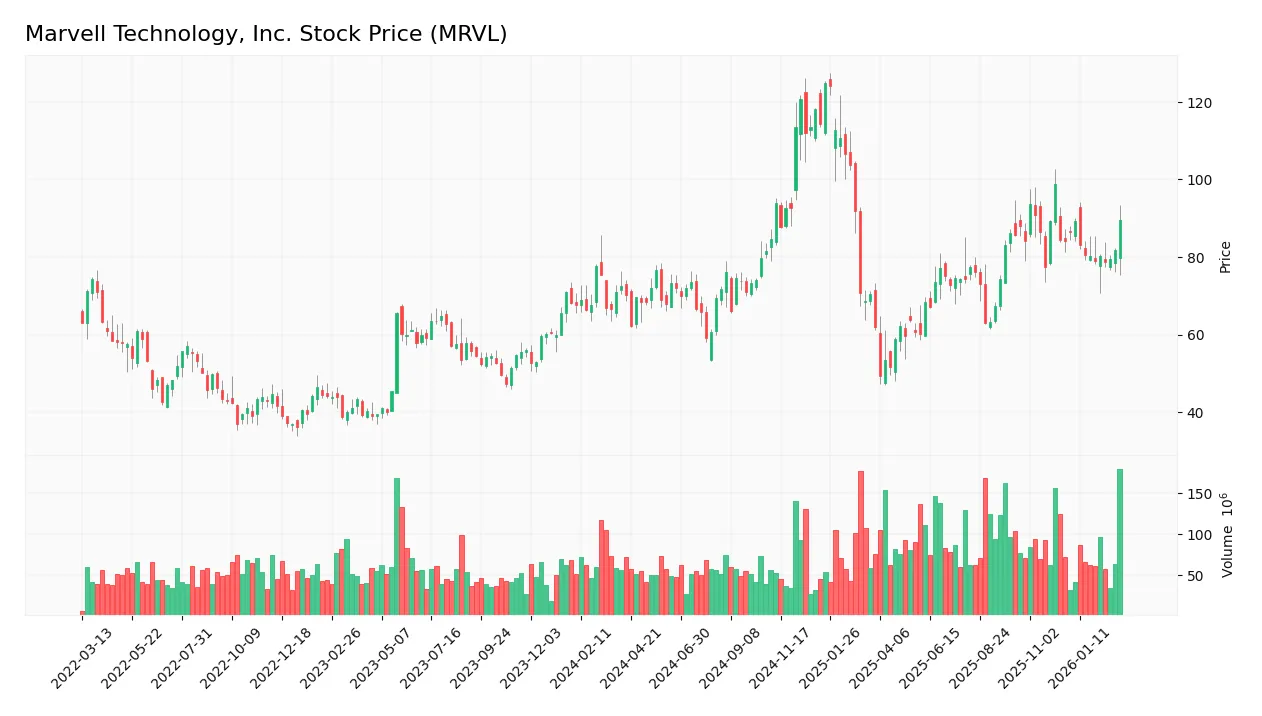
Trend Analysis
Over the past 12 months, MRVL’s stock price rose by 38.49%, signaling a bullish trend with clear acceleration. The price ranged from a low of 49.43 to a high of 124.76. Volatility is notable, reflected by a standard deviation of 16.27, indicating significant price fluctuations during this period.
Volume Analysis
In the last three months, trading volume has increased, with buyer volume at 548M versus seller volume at 449M. Buyers slightly dominate at 54.98%, suggesting growing investor confidence and higher market participation in this period.
Target Prices
Analysts set a clear target consensus for Marvell Technology, Inc. (MRVL), indicating a strong range of expectations.
| Target Low | Target High | Consensus |
|---|---|---|
| 85 | 164 | 120.68 |
The target prices reflect bullish sentiment, with analysts expecting MRVL’s shares to grow from current levels toward $120 on average. The wide range shows varied optimism on the company’s execution and sector dynamics.

Don’t Let Luck Decide Your Entry Point
Optimize your entry points with our advanced ProRealTime indicators. You’ll get efficient buy signals with precise price targets for maximum performance. Start outperforming now!
Analyst & Consumer Opinions
This section examines analyst ratings and consumer feedback regarding Marvell Technology, Inc. (MRVL) to provide balanced insights.
Stock Grades
Here are the latest verified stock grades for Marvell Technology, Inc. from leading financial institutions:
| Grading Company | Action | New Grade | Date |
|---|---|---|---|
| Citigroup | Maintain | Buy | 2026-03-06 |
| B of A Securities | Upgrade | Buy | 2026-03-06 |
| RBC Capital | Maintain | Outperform | 2026-03-06 |
| Stifel | Maintain | Buy | 2026-03-06 |
| Morgan Stanley | Maintain | Equal Weight | 2026-03-06 |
| Rosenblatt | Maintain | Buy | 2026-03-06 |
| Craig-Hallum | Maintain | Buy | 2026-03-06 |
| JP Morgan | Maintain | Overweight | 2026-03-06 |
| B. Riley Securities | Maintain | Buy | 2026-03-06 |
| KGI Securities | Upgrade | Outperform | 2026-03-06 |
The consensus across these firms leans strongly positive, with multiple upgrades and predominantly Buy or Outperform ratings. Morgan Stanley’s Equal Weight stands out as more cautious amid widespread optimism.
Consumer Opinions
Marvell Technology, Inc. draws mixed reactions from its user base, reflecting a blend of innovation praise and service concerns.
| Positive Reviews | Negative Reviews |
|---|---|
| Innovative products with strong performance | Customer support response times are slow |
| Reliable hardware that integrates well | Occasional software bugs reported |
| Competitive pricing in the semiconductor space | Some users find product documentation lacking |
Overall, consumers appreciate Marvell’s cutting-edge technology and value-driven pricing. However, recurring complaints about customer service and software glitches highlight areas needing urgent improvement.
Risk Analysis
Below is a table summarizing key risks for Marvell Technology, Inc., including their probability and potential impact:
| Category | Description | Probability | Impact |
|---|---|---|---|
| Market Volatility | High beta (1.99) exposes stock to wider price swings amid tech sector cycles | High | High |
| Valuation Risk | Elevated P/E (25.45) and P/B (4.75) ratios suggest stretched valuation | Medium | Medium |
| Competitive Risk | Semiconductors face intense competition and rapid innovation cycles | Medium | High |
| Financial Risk | ROIC (6.0%) below WACC (12.96%) signals potential value destruction | Medium | High |
| Debt Risk | Moderate debt-to-equity (0.31) but low debt score flags some leverage concerns | Low | Medium |
Marvell’s most pressing risks stem from its valuation and capital efficiency. Despite robust net margins (32.6%) and a safe Altman Z-Score (7.35), its ROIC trailing the cost of capital warns of potential shareholder value dilution. The company’s high beta signals vulnerability to market swings, demanding cautious position sizing.
Should You Buy Marvell Technology, Inc.?
Marvell Technology appears to be improving profitability with growing ROIC despite an overall slightly unfavorable moat reflecting value destruction. Its leverage profile seems manageable, supported by a strong Altman Z-score, yet some valuation metrics remain unfavorable. The company’s rating stands at a moderate B+.
Strength & Efficiency Pillars
Marvell Technology, Inc. exhibits robust profitability with a net margin of 32.58% and return on equity (ROE) at 18.66%, signaling strong operational efficiency. Its EBIT margin of 16.33% further validates effective cost control. However, the company is not a value creator as its ROIC stands at 6.0%, below the WACC of 12.96%, indicating it currently destroys shareholder value despite profitability gains. Still, Marvell’s consistent revenue and net income growth highlight improving fundamental performance.
Weaknesses and Drawbacks
Marvell carries valuation and leverage concerns, with an elevated P/E ratio of 25.45 and a price-to-book ratio of 4.75, reflecting a premium market valuation that may pressure returns. Although debt-to-equity is favorable at 0.31, the higher WACC suggests costly capital. The asset turnover ratio of 0.37 is weak, signaling inefficient asset utilization. While liquidity ratios are solid, the dividend yield is minimal at 0.3%, limiting income appeal. These factors introduce valuation risk and operational efficiency challenges.
Our Final Verdict about Marvell Technology, Inc.
Marvell’s financial health is solidly within the safe zone with an Altman Z-Score of 7.35, dismissing bankruptcy concerns. Despite a bullish long-term stock trend and accelerating momentum, the company is shedding value relative to its cost of capital. The profile might appear attractive for investors focused on growth but suggests caution regarding valuation and capital efficiency. Overall, Marvell could merit consideration for those seeking exposure to a fundamentally improving technology firm with moderate risk.
Disclaimer: This content is for informational purposes only and does not constitute financial, investment, or other professional advice. Investing in financial markets involves a significant risk of loss, and past performance is not indicative of future results.
Additional Resources
- Generate Investment Management Ltd Buys New Holdings in Marvell Technology, Inc. $MRVL – MarketBeat (Mar 28, 2026)
- Marvell Technology, Inc. Reports Fourth Quarter and Fiscal Year 2026 Financial Results – Marvell (Mar 05, 2026)
- Why Marvell Technology, Inc. (NASDAQ:MRVL) Could Be Worth Watching – Yahoo Finance (Mar 26, 2026)
- Insider Sell: Sandeep Bharathi Sells Shares of Marvell Technology Inc (MRVL) – GuruFocus (Mar 28, 2026)
- Wealth Enhancement Advisory Services LLC Grows Stake in Marvell Technology, Inc. $MRVL – MarketBeat (Mar 28, 2026)
For more information about Marvell Technology, Inc., please visit the official website: marvell.com