Home > Analyses > Basic Materials > Martin Marietta Materials, Inc.
Martin Marietta shapes the backbone of modern infrastructure by supplying essential construction materials that build cities and connect communities. As a dominant force in aggregates, cement, and asphalt, it powers everything from highways to high-rises. Its reputation for quality and innovation sets industry standards. Yet, with market dynamics shifting, I ask: do Martin Marietta’s fundamentals still justify its premium valuation and growth prospects in 2026?

Table of contents
Business Model & Company Overview
Martin Marietta Materials, Inc., founded in 1939 and headquartered in Raleigh, NC, stands as a dominant player in the construction materials sector. It operates a comprehensive ecosystem of natural resource-based products, including aggregates, ready mixed concrete, asphalt, and specialty cements. This diverse portfolio supports infrastructure, residential, and industrial markets, reinforcing its vital role across multiple construction-related industries.
The company’s revenue engine balances heavy materials with specialty chemical products, serving industries from steel production to environmental applications. Its footprint spans the Americas, Europe, and Asia, delivering critical inputs for global infrastructure projects. Martin Marietta’s competitive advantage lies in its integrated supply chain and industry expertise, creating a robust economic moat that shapes construction’s evolving landscape.
Financial Performance & Fundamental Metrics
I analyze Martin Marietta Materials, Inc.’s income statement, key financial ratios, and dividend payout policy to assess its core financial health and shareholder value creation.
Income Statement
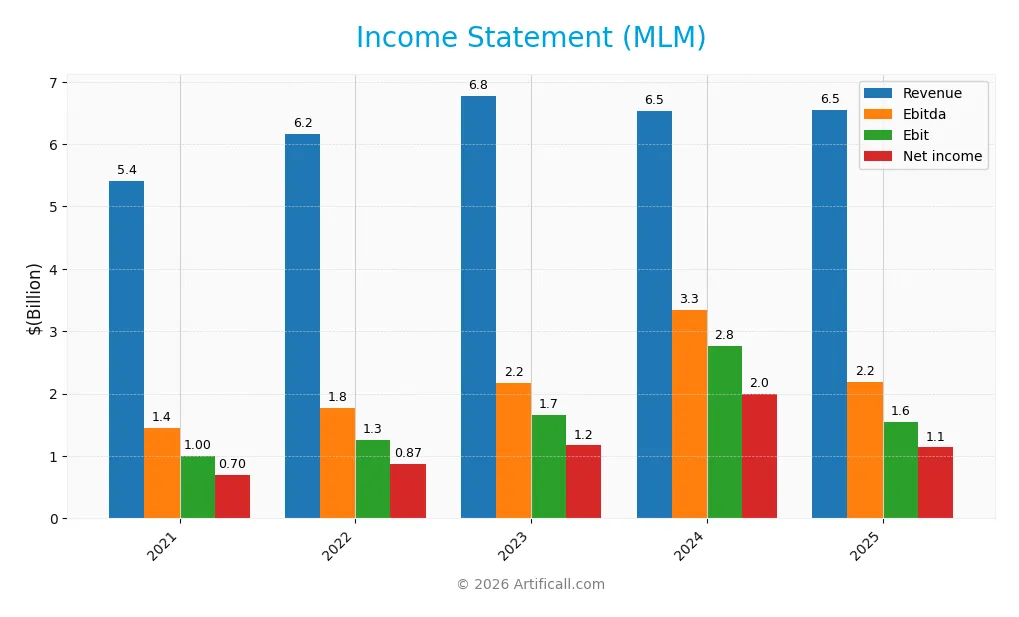
The table below summarizes Martin Marietta Materials, Inc.’s key income statement figures for the fiscal years 2021 through 2025, reflecting revenue trends and profitability metrics.
| 2021 | 2022 | 2023 | 2024 | 2025 | |
|---|---|---|---|---|---|
| Revenue | 5.41B | 6.16B | 6.78B | 6.54B | 6.54B |
| Cost of Revenue | 4.07B | 4.74B | 4.75B | 4.66B | 4.59B |
| Operating Expenses | 375M | 216M | 427M | -829M | 440M |
| Gross Profit | 1.35B | 1.42B | 2.02B | 1.88B | 1.96B |
| EBITDA | 1.45B | 1.77B | 2.17B | 3.34B | 2.19B |
| EBIT | 998M | 1.26B | 1.66B | 2.77B | 1.55B |
| Interest Expense | 143M | 169M | 165M | 169M | 229M |
| Net Income | 703M | 867M | 1.17B | 1.99B | 1.14B |
| EPS | 11.26 | 13.91 | 18.88 | 32.50 | 18.85 |
| Filing Date | 2022-02-22 | 2023-02-24 | 2024-02-23 | 2025-02-21 | 2026-02-19 |
Income Statement Evolution
Martin Marietta Materials’ revenue grew 21% from 2021 to 2025, but growth slowed to 0.1% in 2025. Gross profit and net income expanded significantly over the period, with net income up 62%. Margins improved, reflected in a gross margin near 30%, and net margin rising to 17.4%, indicating enhanced operational efficiency despite recent headwinds.
Is the Income Statement Favorable?
In 2025, MLM reported $6.54B in revenue and $1.14B in net income, yielding a solid 17.4% net margin. EBIT margin stands at 23.7%, while interest expense remains manageable at 3.5% of revenue. However, one-year growth metrics show sharp declines in EBIT (-44%) and net margin (-43%), signaling near-term pressure. Overall fundamentals remain favorable but warrant caution given recent margin compression.
Financial Ratios
The following table summarizes key financial ratios for Martin Marietta Materials, Inc. over the past five fiscal years, illustrating profitability, valuation, liquidity, leverage, and efficiency:
| Ratios | 2021 | 2022 | 2023 | 2024 | 2025 |
|---|---|---|---|---|---|
| Net Margin | 13% | 14% | 17% | 31% | 17% |
| ROE | 11% | 12% | 15% | 21% | 11% |
| ROIC | 6% | 7% | 9% | 12% | 7% |
| P/E | 39.1 | 24.3 | 26.4 | 15.9 | 33.0 |
| P/B | 4.21 | 2.94 | 3.84 | 3.35 | 3.74 |
| Current Ratio | 2.69 | 1.99 | 3.35 | 2.50 | 3.57 |
| Quick Ratio | 1.69 | 1.39 | 2.50 | 1.40 | 2.36 |
| D/E | 0.85 | 0.76 | 0.59 | 0.61 | 0.53 |
| Debt-to-Assets | 38% | 36% | 31% | 32% | 28% |
| Interest Coverage | 6.8 | 7.1 | 9.7 | 16.0 | 6.6 |
| Asset Turnover | 0.38 | 0.41 | 0.45 | 0.36 | 0.35 |
| Fixed Asset Turnover | 0.80 | 0.92 | 1.03 | 0.62 | 0.61 |
| Dividend Yield | 0.54% | 0.76% | 0.56% | 0.60% | 0.52% |
Percentages are rounded to whole numbers for clarity. Debt-to-Equity (D/E) and Debt-to-Assets ratios reflect moderate leverage, while liquidity metrics indicate a strong current position in recent years.
Evolution of Financial Ratios
Martin Marietta’s Return on Equity (ROE) showed fluctuations, peaking in 2024 before declining to 11.33% in 2025. The Current Ratio improved steadily from about 2.0 in 2022 to 3.57 in 2025, signaling enhanced short-term liquidity. Debt-to-Equity ratio trended downward from 0.85 in 2021 to 0.53 in 2025, indicating moderate deleveraging. Profitability remained stable but softened in 2025.
Are the Financial Ratios Fovorable?
In 2025, profitability is mixed: net margin at 17.37% is favorable, yet ROE and ROIC remain neutral against a WACC of 8.4%. Liquidity shows a strong quick ratio of 2.36, but a high current ratio of 3.57 is marked unfavorable, possibly signaling inefficient asset use. Leverage is moderate with debt-to-equity at 0.53, deemed neutral. Market valuation ratios like P/E at 33.02 and P/B at 3.74 appear elevated and unfavorable. Overall, the financial ratios skew slightly unfavorable.
Shareholder Return Policy
Martin Marietta Materials maintains a consistent dividend payout ratio near 17%, with dividends per share rising from $2.37 in 2021 to $3.27 in 2025. The annual yield remains modest at about 0.5%, supported by share buybacks and coverage from free cash flow, which exceeded dividends plus capex by 78% in 2025.
This balanced approach aligns with sustainable long-term value creation by preserving capital for reinvestment while returning cash to shareholders. However, the relatively low dividend yield and ongoing buybacks warrant monitoring to ensure distributions remain sustainable amid market cycles and capital needs.
Score analysis
Here is a radar chart illustrating Martin Marietta Materials, Inc.’s key financial scores across valuation, profitability, and leverage metrics:
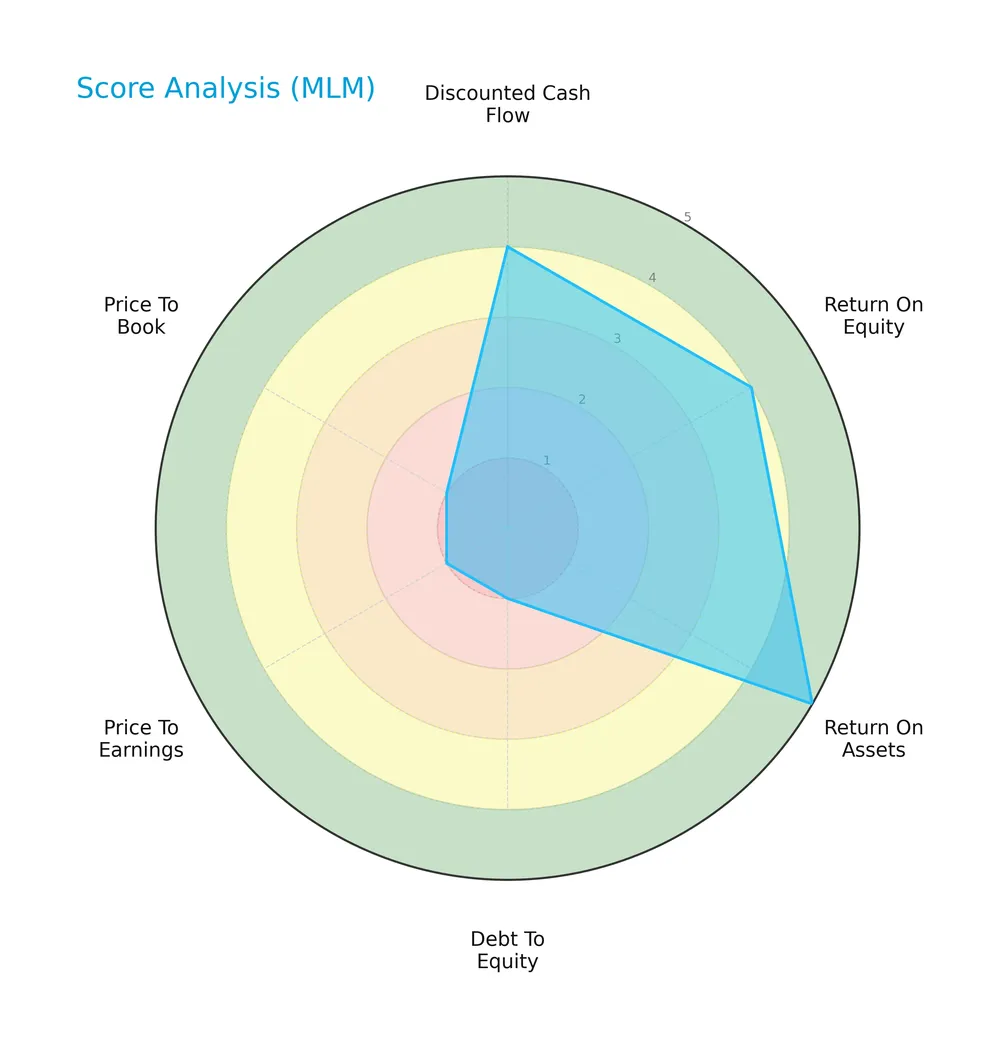
The company scores favorably in discounted cash flow (4), return on equity (4), and very favorably on return on assets (5). However, it shows very unfavorable scores in debt to equity (1), price to earnings (1), and price to book (1), indicating valuation and leverage concerns.
Analysis of the company’s bankruptcy risk
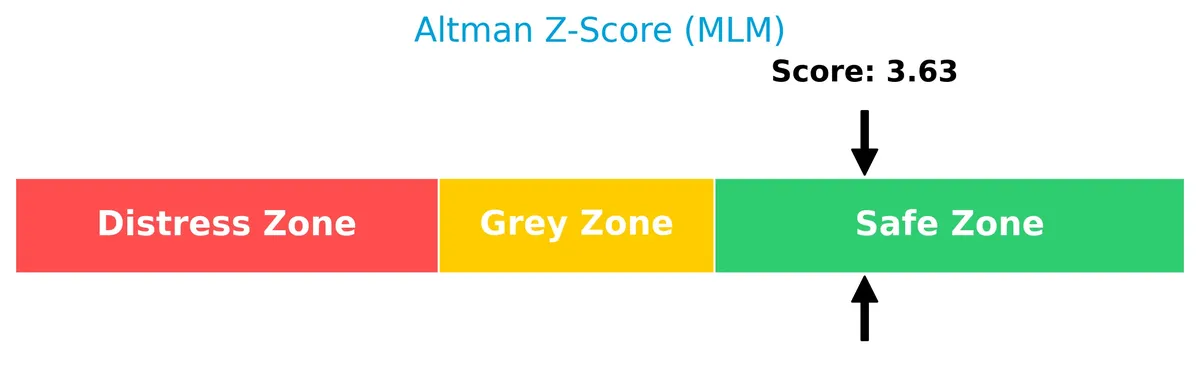
Martin Marietta Materials, Inc. is in the safe zone according to the Altman Z-Score, signaling low bankruptcy risk and solid financial stability:
Is the company in good financial health?
The Piotroski Score diagram below highlights the company’s financial strength and operational efficiency:

With a strong Piotroski Score of 7, the company demonstrates solid profitability, liquidity, and efficiency, reflecting robust financial health.
Competitive Landscape & Sector Positioning
This sector analysis examines Martin Marietta Materials, Inc.’s strategic positioning, revenue segments, and key products within construction materials. I will assess whether the company holds a competitive advantage over its main industry rivals.
Strategic Positioning
Martin Marietta Materials focuses primarily on building materials, generating over 5.7B in 2025, with a smaller magnesia specialties segment. Its geographic exposure concentrates on the U.S., notably the Southeast and West regions, reflecting a predominantly domestic and product-concentrated strategy.
Revenue by Segment
This pie chart illustrates Martin Marietta Materials, Inc.’s revenue distribution by business segment for the fiscal year 2025, highlighting the relative contribution of each segment.
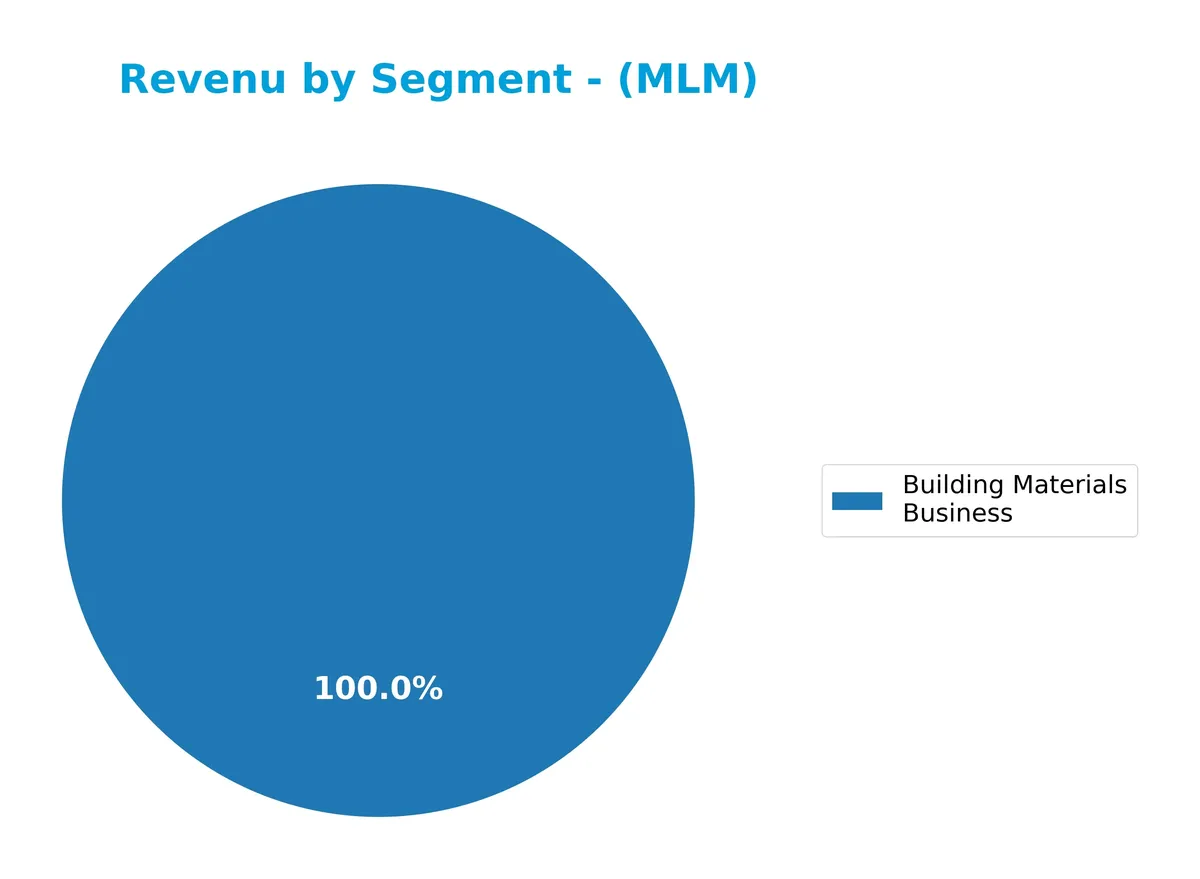
The Building Materials Business dominates Martin Marietta’s revenue, generating $5.7B in 2025. This segment has shown a slight decline from $6.2B in 2024, indicating a recent slowdown. Other segments like Magnesia Specialties are no longer reported, signaling a strategic concentration on core operations. The overall trend reflects a focus on the Building Materials Business as the primary growth driver, with potential risks tied to this concentration.
Key Products & Brands
Martin Marietta Materials’ main products and brands reflect its focus on construction and industrial materials:
| Product | Description |
|---|---|
| Building Materials Business | Includes crushed stone, sand, gravel, ready-mixed concrete, asphalt, paving products, and cement for infrastructure and construction markets. |
| Magnesia Specialties | Produces magnesia-based chemicals for industrial, agricultural, environmental uses, and dolomitic lime for steel production and soil stabilization. |
Martin Marietta’s portfolio centers on essential construction aggregates and specialty chemicals. The building materials segment dominates revenue, supporting diverse infrastructure and industrial applications.
Main Competitors
There are 3 main competitors in the Construction Materials industry; below is the top 3 by market capitalization:
| Competitor | Market Cap. |
|---|---|
| CRH plc | 85B |
| Vulcan Materials Company | 39B |
| Martin Marietta Materials, Inc. | 38B |
Martin Marietta ranks 3rd among its competitors with a market cap at 48.81% of CRH plc, the sector leader. The company sits below the average market cap of the top 10 but remains above the sector median. It trails Vulcan Materials by approximately 6.52%, indicating a narrow gap with its closest rival.
Comparisons with competitors
Check out how we compare the company to its competitors:
Does MLM have a competitive advantage?
Martin Marietta Materials currently lacks a strong competitive advantage, as its ROIC falls below WACC, indicating value destruction despite improving profitability. The company’s gross margin near 30% and net margin above 17% remain favorable but do not offset the capital inefficiency.
Looking ahead, MLM’s diverse product range and geographic presence in the Southeast and West groups offer growth opportunities. Expansion into infrastructure and environmental markets could support future margin improvements, though capital allocation remains a critical watchpoint.
SWOT Analysis
This SWOT analysis highlights Martin Marietta Materials, Inc.’s key strategic factors to guide investment decisions.
Strengths
- strong market position in construction materials
- favorable gross and net margins near 30% and 17%
- solid Altman Z-Score indicating financial safety
Weaknesses
- declining recent EBIT and EPS growth over one year
- high PE and PB ratios signal overvaluation
- slightly unfavorable ROIC vs WACC shows value destruction
Opportunities
- growing infrastructure spending in US boosts demand
- expanding product mix including specialty chemicals
- rising ROIC trend suggests improving operations
Threats
- cyclical nature of construction sector risks revenue dips
- commodity price volatility impacts margins
- competitive pressure from peers with better capital efficiency
Martin Marietta’s financial strength and market footprint create a solid foundation. However, recent profitability declines and valuation premiums warrant caution. Strategic focus should target operational efficiency and capital allocation to convert growth opportunities amid sector cyclicality.
Stock Price Action Analysis
The weekly stock chart for Martin Marietta Materials, Inc. (MLM) over the past 12 weeks shows notable price movement and volatility patterns:
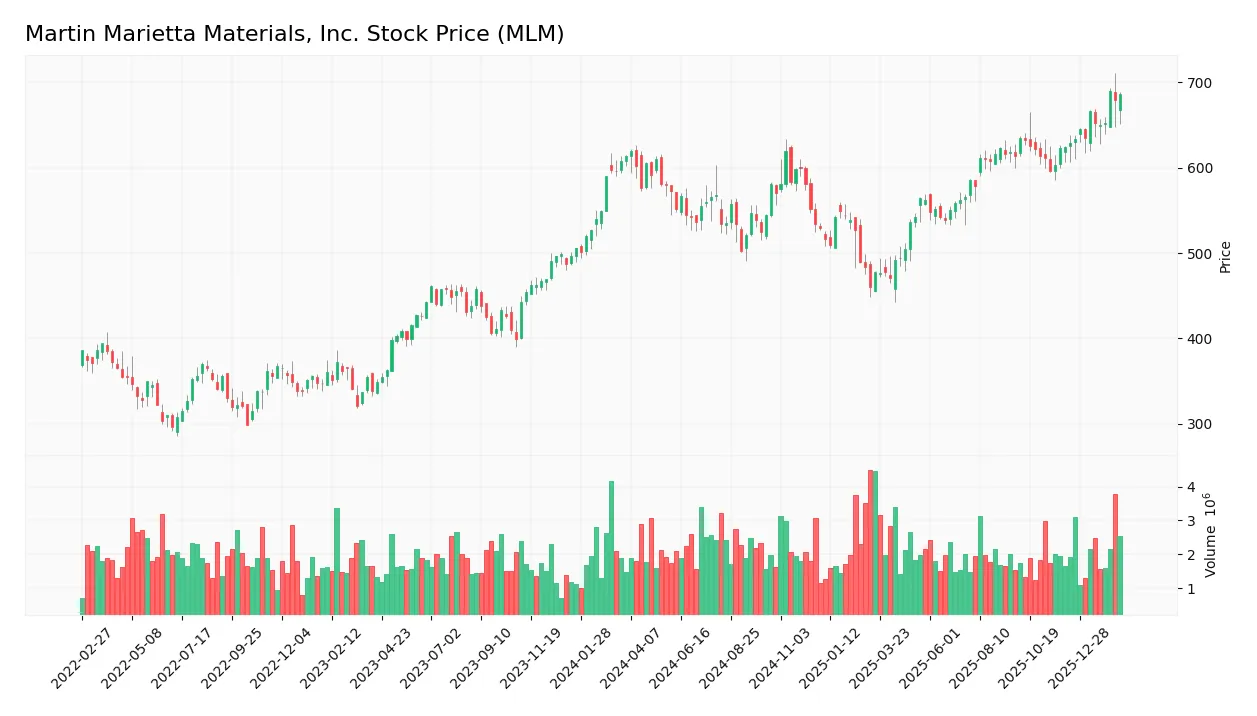
Trend Analysis
Over the past 12 weeks, MLM’s stock price increased by 11.73%, indicating a bullish trend with acceleration. The price ranged from a low of 460.39 to a high of 690.0. Volatility remains elevated with a standard deviation of 50.63, reflecting active trading.
Volume Analysis
In the last three months, trading volume is increasing with buyer dominance at 63.92%. Buyers accounted for 16.18M shares versus 9.13M sellers, signaling strong buyer-driven activity. This trend suggests growing investor confidence and heightened market participation.
Target Prices
The consensus target price for Martin Marietta Materials, Inc. reflects moderate upside potential.
| Target Low | Target High | Consensus |
|---|---|---|
| 575 | 735 | 685.5 |
Analysts expect the stock to trade between 575 and 735, with a consensus near 685.5, signaling confidence in steady growth ahead.

Don’t Let Luck Decide Your Entry Point
Optimize your entry points with our advanced ProRealTime indicators. You’ll get efficient buy signals with precise price targets for maximum performance. Start outperforming now!
Analyst & Consumer Opinions
This section examines the latest analyst ratings and consumer feedback regarding Martin Marietta Materials, Inc. (MLM).
Stock Grades
Here are the latest verified stock grades for Martin Marietta Materials, Inc., reflecting analyst viewpoints as of early 2026:
| Grading Company | Action | New Grade | Date |
|---|---|---|---|
| Citigroup | Maintain | Buy | 2026-02-13 |
| Stephens & Co. | Maintain | Overweight | 2026-02-13 |
| RBC Capital | Maintain | Sector Perform | 2026-02-13 |
| Jefferies | Maintain | Buy | 2026-02-12 |
| Wells Fargo | Maintain | Equal Weight | 2026-02-12 |
| Wells Fargo | Maintain | Equal Weight | 2026-01-29 |
| Loop Capital | Downgrade | Hold | 2026-01-28 |
| DA Davidson | Downgrade | Neutral | 2026-01-14 |
| Citigroup | Maintain | Buy | 2026-01-08 |
| Morgan Stanley | Maintain | Overweight | 2025-12-22 |
The consensus remains positive, with a majority of Buy and Overweight ratings. Some downgrades to Hold and Neutral suggest cautious views amid mixed sector performance.
Consumer Opinions
Martin Marietta Materials, Inc. receives mixed but insightful feedback from its customer base, reflecting its position in the building materials sector.
| Positive Reviews | Negative Reviews |
|---|---|
| Consistent product quality and reliability. | Delivery delays during peak demand. |
| Responsive and knowledgeable customer service. | Pricing occasionally higher than peers. |
| Strong commitment to sustainability efforts. | Limited product availability in some regions. |
Overall, consumers praise Martin Marietta for product quality and service responsiveness. However, delivery timing and pricing remain areas for improvement. These reflect typical challenges in supply chain management within construction materials.
Risk Analysis
Below is a summary of key risks facing Martin Marietta Materials, Inc., including their likelihood and potential impact:
| Category | Description | Probability | Impact |
|---|---|---|---|
| Valuation Risk | Elevated P/E (33) and P/B (3.74) ratios suggest potential overvaluation. | High | Medium |
| Operational Risk | Low asset turnover (0.35) may indicate inefficiencies in asset utilization. | Medium | Medium |
| Financial Leverage | Debt-to-equity ratio shows unfavorable leverage; risk if interest rates rise. | Medium | High |
| Market Volatility | Beta of 1.14 implies sensitivity to market swings, increasing price volatility. | High | Medium |
| Dividend Yield | Low dividend yield (0.52%) limits income appeal for yield-focused investors. | Medium | Low |
The most pressing risks are valuation and leverage concerns. Martin Marietta trades at a premium to the sector, raising vulnerability to market corrections. Despite a safe Altman Z-Score (3.63) and strong Piotroski score (7), its debt levels require monitoring amid rising interest rates. Operational inefficiencies could also constrain growth. Investors should weigh these factors carefully.
Should You Buy Martin Marietta Materials, Inc.?
Martin Marietta Materials, Inc. appears to be a profitable company with improving operational efficiency but shows a slightly unfavorable moat due to value destruction despite rising ROIC. Supported by a manageable leverage profile, it suggests a moderate B rating with prudent risk considerations.
Strength & Efficiency Pillars
Martin Marietta Materials, Inc. posts a robust net margin of 17.37%, reflecting operational discipline. Its return on equity stands at a modest 11.33%, while return on invested capital (ROIC) is 6.87%, narrowly trailing its weighted average cost of capital (WACC) at 8.4%. This gap indicates the company currently sheds value rather than creates it. However, I note improving ROIC trends, signaling potential for enhanced future profitability despite the current shortfall.
Weaknesses and Drawbacks
The company faces valuation headwinds with a high price-to-earnings ratio of 33.02 and a price-to-book ratio of 3.74, suggesting a premium that may limit upside. Its current ratio is 3.57, flagged as unfavorable, implying potential liquidity management concerns despite a favorable quick ratio of 2.36. Asset turnover metrics remain weak, which could pressure returns. These factors, combined with slightly unfavorable leverage metrics, caution against overextension in a cyclical materials sector.
Our Final Verdict about Martin Marietta Materials, Inc.
The company exhibits solid operational margins and a bullish long-term price trend with accelerating momentum. Recent buyer dominance at 63.92% supports near-term confidence. However, the slight value destruction and premium valuation advise prudence. Martin Marietta may appear attractive for investors focusing on growth potential but suggests a measured approach for those seeking margin of safety.
Disclaimer: This content is for informational purposes only and does not constitute financial, investment, or other professional advice. Investing in financial markets involves a significant risk of loss, and past performance is not indicative of future results.
Additional Resources
- Is It Too Late To Consider Buying Martin Marietta Materials, Inc. (NYSE:MLM)? – Yahoo Finance (Feb 16, 2026)
- Martin Marietta Materials Declares Quarterly Cash Dividend of $0.83 per Share – Quiver Quantitative (Feb 19, 2026)
- Bear of the Day: Martin Marietta Materials (MLM) – The Globe and Mail (Feb 19, 2026)
- Martin Marietta Stock Gained 30% Last Year. Could the Infrastructure Supercycle Push It Higher in 2026? – TIKR.com (Feb 20, 2026)
- Decoding Martin Marietta Materials Inc (MLM): A Strategic SWOT I – GuruFocus (Feb 20, 2026)
For more information about Martin Marietta Materials, Inc., please visit the official website: martinmarietta.com