Marsh & McLennan Companies, Inc. fundamentally shapes how organizations understand and manage risk, strategy, and human capital in an increasingly complex world. As a powerhouse in insurance brokerage and consulting, MMC commands a leading position with flagship services that span risk management, insurance broking, and specialized consulting solutions. Renowned for innovation and trusted expertise, the company influences global markets and client decisions daily. The key question for investors now is whether MMC’s robust fundamentals continue to support its current valuation and future growth prospects.

Table of contents
Company Description
Marsh & McLennan Companies, Inc., founded in 1871 and headquartered in New York City, is a global professional services firm specializing in insurance broking and risk management. The company operates through two main segments: Risk and Insurance Services, offering risk advice, insurance broking, and catastrophe modeling, and Consulting, delivering health, wealth, career, and management consulting. Serving diverse clients worldwide, MMC holds a leading position in the financial services industry. Its strength lies in integrating risk solutions with consulting expertise, shaping the future of risk and human capital management.
Fundamental Analysis
This section presents an overview of Marsh & McLennan Companies, Inc.’s income statement, key financial ratios, and dividend payout policy to inform investment decisions.
Income Statement
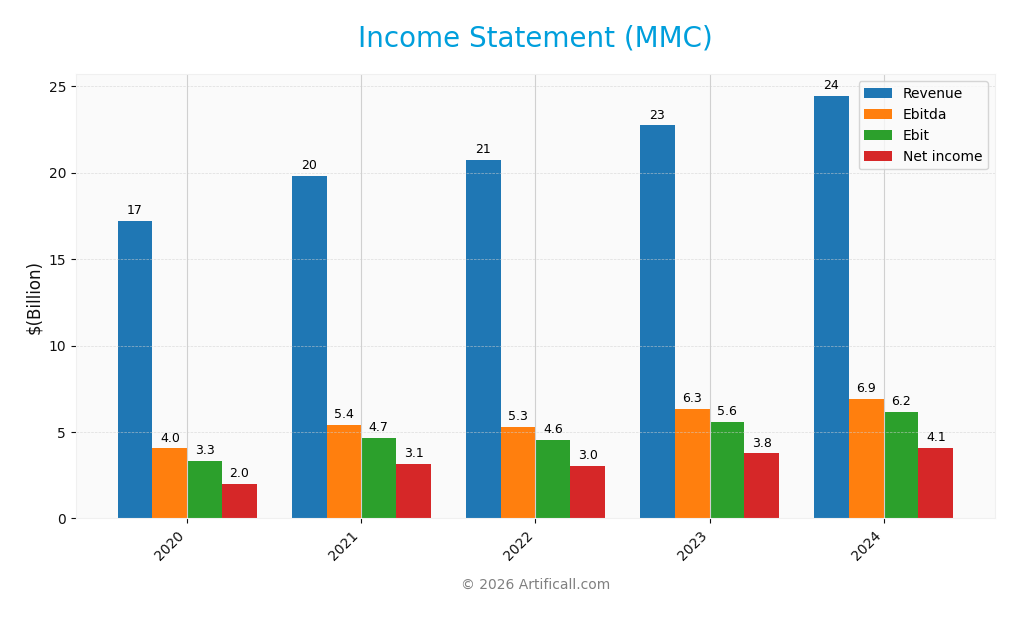
The following table summarizes Marsh & McLennan Companies, Inc.’s key income statement figures for fiscal years 2020 through 2024, reflecting revenue, expenses, profits, and earnings per share.
| 2020 | 2021 | 2022 | 2023 | 2024 | |
|---|---|---|---|---|---|
| Revenue | 17.2B | 19.8B | 20.7B | 22.7B | 24.5B |
| Cost of Revenue | 10.1B | 11.4B | 12.1B | 13.1B | 14.0B |
| Operating Expenses | 4.0B | 4.1B | 4.4B | 4.4B | 4.6B |
| Gross Profit | 7.1B | 8.4B | 8.6B | 9.6B | 10.5B |
| EBITDA | 4.0B | 5.4B | 5.3B | 6.3B | 6.9B |
| EBIT | 3.3B | 4.7B | 4.6B | 5.6B | 6.2B |
| Interest Expense | 515M | 444M | 469M | 578M | 700M |
| Net Income | 2.0B | 3.1B | 3.1B | 3.8B | 4.1B |
| EPS | 3.98 | 6.20 | 6.11 | 7.60 | 8.25 |
| Filing Date | 2021-02-17 | 2022-02-16 | 2023-02-13 | 2024-02-12 | 2025-02-10 |
Income Statement Evolution
Between 2020 and 2024, Marsh & McLennan Companies, Inc. (MMC) experienced steady revenue growth of 42%, reaching $24.5B in 2024. Net income doubled over this period to $4.06B, with net margin improving by 41.8% to 16.6%. Gross and EBIT margins also showed favorable trends, reflecting efficient cost management and expanding profitability despite moderate revenue growth deceleration in the last year.
Is the Income Statement Favorable?
The 2024 income statement highlights robust fundamentals with a gross margin of 42.8% and an EBIT margin of 25.3%, both rated favorable. Operating expenses grew in line with revenue, supporting sustainable margin expansion. Interest expense remained low at 2.86% of revenue. Earnings per share rose 8.6%, underscoring effective profitability. Overall, 85.7% of income statement metrics are favorable, indicating a strong financial position.
Financial Ratios
The table below presents key financial ratios of Marsh & McLennan Companies, Inc. (MMC) for the fiscal years 2020 to 2024, highlighting profitability, valuation, liquidity, leverage, and efficiency metrics.
| Ratios | 2020 | 2021 | 2022 | 2023 | 2024 |
|---|---|---|---|---|---|
| Net Margin | 12% | 16% | 15% | 17% | 17% |
| ROE | 22% | 29% | 29% | 31% | 30% |
| ROIC | 8% | 12% | 20% | 13% | 12% |
| P/E | 29.4 | 28.0 | 27.1 | 24.9 | 25.7 |
| P/B | 6.5 | 8.0 | 7.8 | 7.7 | 7.8 |
| Current Ratio | 1.24 | 1.24 | 0.47 | 1.10 | 1.13 |
| Quick Ratio | 1.24 | 1.24 | 0.47 | 1.10 | 1.13 |
| D/E | 1.49 | 1.20 | 1.28 | 1.27 | 1.64 |
| Debt-to-Assets | 41% | 38% | 40% | 32% | 39% |
| Interest Coverage | 6.0 | 9.7 | 9.1 | 9.1 | 8.3 |
| Asset Turnover | 0.52 | 0.58 | 0.62 | 0.47 | 0.43 |
| Fixed Asset Turnover | 6.3 | 7.3 | 8.5 | 9.4 | 10.4 |
| Dividend Yield | 1.6% | 1.2% | 1.4% | 1.4% | 1.4% |
Evolution of Financial Ratios
From 2020 to 2024, Marsh & McLennan Companies, Inc. saw a steady improvement in Return on Equity (ROE), rising from 22.1% to 30.4%, indicating stronger profitability. The Current Ratio remained relatively stable around 1.1 to 1.2, reflecting consistent short-term liquidity. Conversely, the Debt-to-Equity Ratio increased from about 1.2 in 2021 to 1.64 in 2024, signaling a rise in leverage over the period.
Are the Financial Ratios Favorable?
In 2024, profitability ratios such as net margin (16.6%) and ROE (30.4%) were favorable, supported by a solid return on invested capital (11.56%). Liquidity metrics showed a neutral current ratio of 1.13 but a favorable quick ratio at the same level. Leverage was less favorable with a high debt-to-equity ratio of 1.64, while the interest coverage ratio of 8.83 was favorable. Market valuation ratios, including a price-to-earnings ratio of 25.74 and price-to-book ratio of 7.83, were unfavorable, resulting in an overall slightly favorable assessment.
Shareholder Return Policy
Marsh & McLennan Companies, Inc. maintains a consistent dividend payout ratio near 37%, with dividend per share rising from $1.86 in 2020 to $3.08 in 2024 and an annual yield around 1.45%. The company also supports returns through share buybacks, funded comfortably by free cash flow.
This balanced approach, combining dividends with buybacks and supported by solid cash flow coverage, suggests a shareholder return policy designed for sustainable long-term value. However, investors should monitor payout stability alongside leverage and cash flow trends.
Sector Analysis
This section provides an overview of Marsh & McLennan Companies, Inc.’s sector, covering strategic positioning, revenue by segment, key products, main competitors, competitive advantages, and a SWOT analysis. I will assess whether Marsh & McLennan holds a competitive advantage relative to its peers in the financial services industry.
Strategic Positioning
Marsh & McLennan Companies, Inc. operates a diversified portfolio with two main segments: Risk and Insurance Services ($15.4B in 2024) and Consulting ($9.1B). Geographically, it balances exposure across the US ($11.7B), UK ($3.6B), and other areas ($9.3B), reflecting a broad global footprint.
Revenue by Segment
This pie chart displays Marsh & McLennan Companies, Inc.’s revenue distribution by segment for the fiscal year 2024.
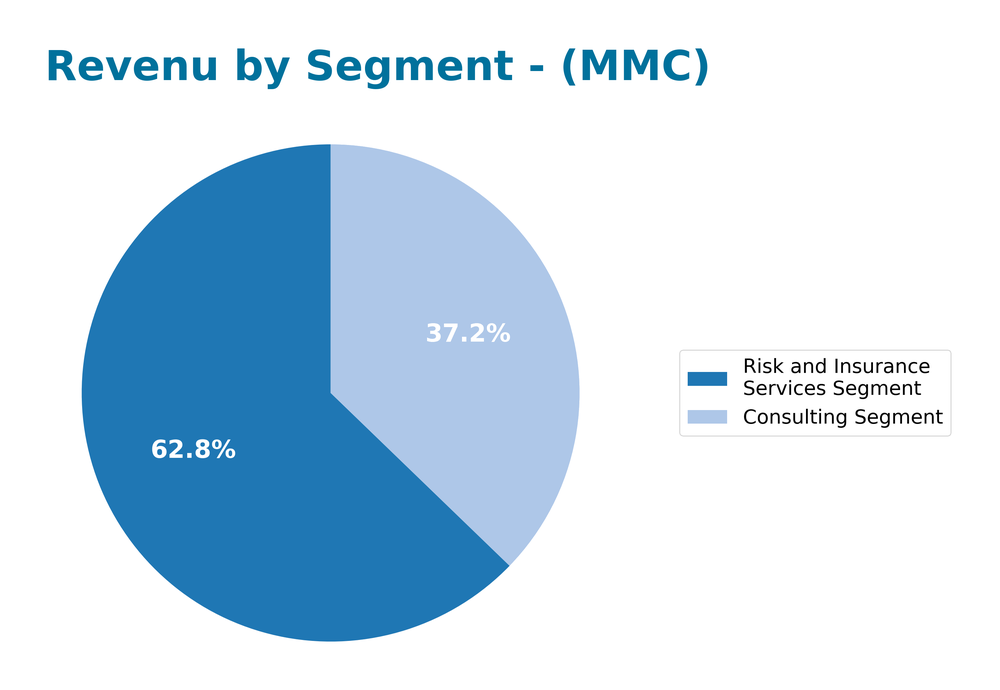
In 2024, the Risk and Insurance Services segment led with $15.4B in revenue, marking a clear growth from $14.1B in 2023. The Consulting segment followed with $9.1B, also showing steady expansion. The consistent increase in both segments indicates balanced growth, though the Risk and Insurance Services segment remains the primary driver, highlighting a concentration in this business area.
Key Products & Brands
The table below outlines Marsh & McLennan Companies, Inc.’s principal products and brands with their respective business descriptions:
| Product | Description |
|---|---|
| Risk and Insurance Services | Provides risk management advice, risk transfer, control and mitigation solutions, insurance and reinsurance broking, catastrophe and financial modeling, and insurance program management services. Serves businesses, public entities, insurers, associations, and private clients. |
| Consulting | Offers health, wealth, and career consulting services, plus specialized management, economic, and brand consulting solutions. |
Marsh & McLennan Companies operates two main segments: Risk and Insurance Services delivering comprehensive risk management and insurance solutions, and Consulting providing diverse advisory services in health, wealth, career, and management consulting.
Main Competitors
The table below lists the main competitors by market capitalization in the financial services sector related to insurance and risk management:
| Competitor | Market Cap. |
|---|---|
| CME Group Inc. | 97.2B |
| Bank of Montreal | 95.4B |
| Mizuho Financial Group, Inc. | 93.0B |
| The Bank of Nova Scotia | 92.9B |
| Intercontinental Exchange, Inc. | 91.7B |
| Moody’s Corporation | 89.7B |
| Marsh & McLennan Companies, Inc. | 89.8B |
| Brookfield Asset Management Ltd. | 86.2B |
| Aon plc | 74.4B |
| Arthur J. Gallagher & Co. | 65.7B |
Among these, CME Group and major banks such as Bank of Montreal and Mizuho Financial Group lead in market cap, while Marsh & McLennan Companies holds a solid position close to Moody’s within this competitive group.
Does MMC have a competitive advantage?
Marsh & McLennan Companies, Inc. (MMC) presents a competitive advantage, evidenced by a ROIC exceeding its WACC by 5.15% and a growing ROIC trend of over 40%, indicating efficient capital use and value creation. The company’s income statement shows favorable margins, with a 42.78% gross margin and 16.6% net margin, supporting its profitability and stability within the insurance brokerage and consulting sectors.
Looking ahead, MMC’s diverse services in risk management and consulting position it well for expanding opportunities in global markets, including significant recent revenue growth in the United States and other geographic areas. Its ongoing focus on risk advisory and insurance solutions supports a positive outlook for sustained competitive positioning amid evolving client needs.
SWOT Analysis
This SWOT analysis highlights the key internal and external factors impacting Marsh & McLennan Companies, Inc. to guide investment decisions.
Strengths
- strong profitability with 16.6% net margin
- durable competitive advantage with growing ROIC
- diversified global presence, especially in US and UK
Weaknesses
- relatively high debt-to-equity ratio (1.64)
- elevated price-to-book ratio (7.83)
- moderate revenue growth rate (7.57% last year)
Opportunities
- expanding insurance and consulting demand worldwide
- digital transformation in risk management services
- potential market share gains in emerging markets
Threats
- intense competition in insurance brokerage and consulting
- regulatory changes impacting financial services
- economic downturns affecting client budgets
Overall, MMC demonstrates solid financial health and a strong competitive moat with increasing profitability, though valuation appears stretched. The company should focus on leveraging global growth opportunities while managing leverage and navigating regulatory risks carefully.
Stock Analysis
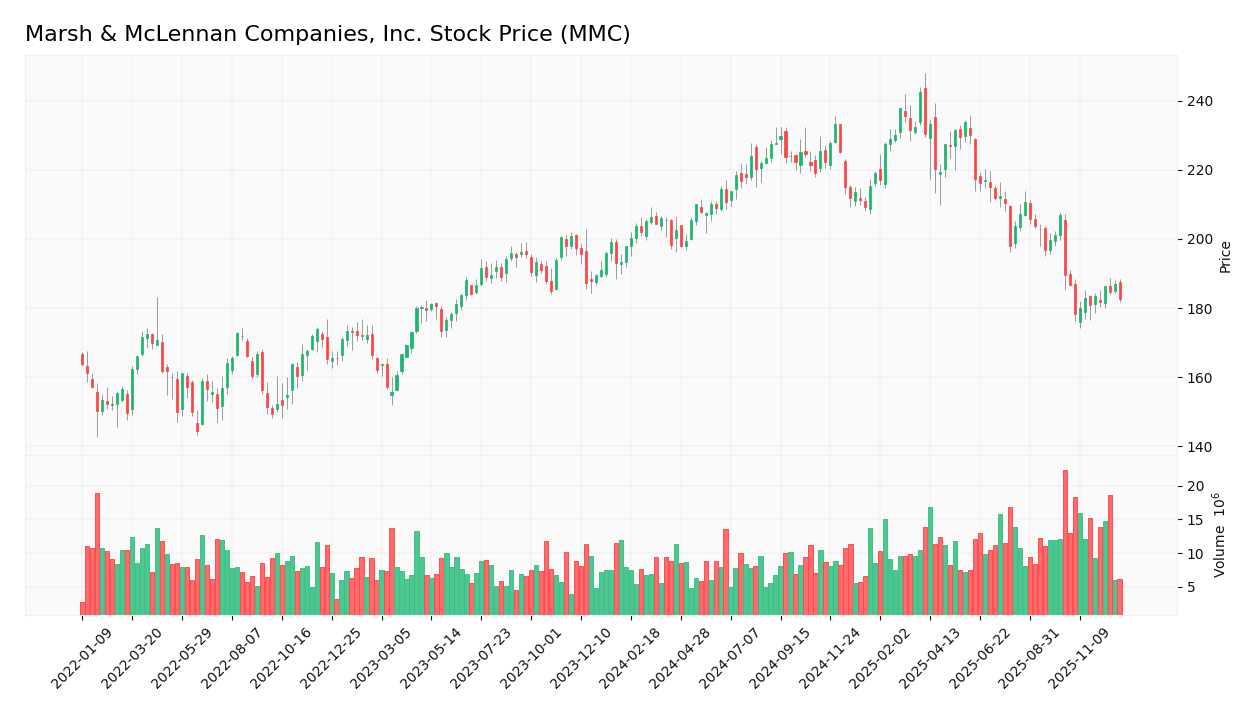
Marsh & McLennan Companies, Inc. (MMC) has experienced a notable bearish trend over the past year, marked by accelerating price declines and significant volatility between a high of 242.39 and a low of 178.15, reflecting heightened trading dynamics and investor caution.
Trend Analysis
Over the past 12 months, MMC’s stock price fell by 7.8%, indicating a clear bearish trend. The acceleration in the downtrend is supported by a high volatility measure of 14.96 standard deviation. The stock reached a peak of 242.39 and a trough of 178.15, confirming persistent downward pressure.
Volume Analysis
In the last three months, trading volume has been increasing but dominated by sellers, with buyer participation at 35.01%. This seller dominance amid rising volume suggests cautious or negative investor sentiment, reflecting stronger selling pressure and a possible continuation of the bearish momentum.
Target Prices
The target price consensus for Marsh & McLennan Companies, Inc. (MMC) reflects a moderately bullish outlook from analysts.
| Target High | Target Low | Consensus |
|---|---|---|
| 257 | 190 | 216.5 |
Analysts expect MMC’s stock price to range between 190 and 257, with an average consensus target of approximately 216.5, indicating potential upside from current levels.
Analyst Opinions
This section provides an in-depth analysis of Marsh & McLennan Companies, Inc.’s ratings, scores, and grades to inform investor understanding.
Ratings analysis
Marsh & McLennan holds a B+ rating, reflecting a very favorable overall evaluation. Key financial metrics such as return on equity and assets score very favorably at 5, while discounted cash flow is rated at 4. However, valuation ratios like price-to-book score poorly at 1, indicating mixed financial signals.
The ratings are generally very favorable with some moderate and one very unfavorable aspect, showing a balanced but positive outlook overall.
Scores analysis
The company’s Altman Z-Score is 2.71, placing it in the grey zone, suggesting a moderate bankruptcy risk. The Piotroski Score is 5, categorized as average, indicating moderate financial health and investment potential based on profitability, leverage, and efficiency criteria.
Stock Grades
Here is an overview of the latest stock ratings for Marsh & McLennan Companies, Inc. from recognized financial institutions:
| Grading Company | Action | New Grade | Date |
|---|---|---|---|
| Citigroup | Maintain | Neutral | 2025-12-04 |
| Barclays | Upgrade | Overweight | 2025-11-20 |
| B of A Securities | Downgrade | Underperform | 2025-11-03 |
| TD Cowen | Maintain | Hold | 2025-11-03 |
| Goldman Sachs | Upgrade | Neutral | 2025-10-20 |
| Wells Fargo | Maintain | Equal Weight | 2025-10-17 |
| Evercore ISI Group | Maintain | Outperform | 2025-10-17 |
| Keefe, Bruyette & Woods | Upgrade | Market Perform | 2025-10-17 |
| JP Morgan | Upgrade | Overweight | 2025-10-09 |
| UBS | Maintain | Buy | 2025-10-08 |
The ratings show a mixed but generally positive trend, with several upgrades moving toward overweight and outperform recommendations. While a few cautious stances remain, the overall sentiment from top-tier analysts suggests growing confidence in Marsh & McLennan’s prospects.
Consumer Opinions
Consumer sentiment about Marsh & McLennan Companies, Inc. (MMC) reflects a mix of appreciation for its expertise and some concerns about service consistency.
| Positive Reviews | Negative Reviews |
|---|---|
| “Expert risk management advice that helped our business grow confidently.” | “Customer service response times can be slow during peak periods.” |
| “Comprehensive insurance solutions tailored to our specific needs.” | “Some pricing options felt less competitive compared to other firms.” |
| “Strong industry reputation and knowledgeable consultants.” | “Occasional delays in policy updates and claims processing.” |
Overall, consumers praise MMC for its professional expertise and tailored solutions, while recurring complaints focus on service speed and pricing competitiveness. This suggests solid core strengths but room for improvement in customer experience.
Risk Analysis
The following table summarizes key risks associated with Marsh & McLennan Companies, Inc. (MMC), considering their likelihood and potential impact on investment outcomes.
| Category | Description | Probability | Impact |
|---|---|---|---|
| Market Valuation | Elevated P/E (25.74) and P/B (7.83) ratios suggest the stock may be overvalued. | Medium | High |
| Leverage Risk | Debt-to-equity ratio of 1.64 indicates significant leverage, increasing financial risk. | Medium | Medium |
| Bankruptcy Risk | Altman Z-Score of 2.71 places MMC in the “grey zone,” implying moderate bankruptcy risk. | Low-Medium | High |
| Economic Sensitivity | As a financial services firm, economic downturns could reduce demand for consulting and insurance services. | Medium | Medium |
| Operational Risk | Asset turnover of 0.43 is unfavorable, indicating potential inefficiencies in asset use. | Medium | Medium |
Among these, the most critical risks stem from valuation and moderate bankruptcy risk, as indicated by the high price multiples and the Altman Z-Score in the grey zone. While the company shows strong profitability and return on equity, investors should be cautious about the elevated leverage and overvaluation which could amplify downside in volatile markets.
Should You Buy Marsh & McLennan Companies, Inc.?
Marsh & McLennan Companies, Inc. shows a positive return on invested capital of 11.56% versus a WACC of 6.41%, indicating value creation and a growing profitability trend. The company has a moderate net debt to EBITDA ratio of 2.81, reflecting manageable leverage. Its overall rating is very favorable with a B+ score, suggesting solid financial strength despite some moderate risks.
Favorable signals
Marsh & McLennan Companies, Inc. demonstrates several favorable financial elements. The income statement reveals strong profitability with a gross margin of 42.78%, an EBIT margin of 25.27%, and a positive net margin of 16.6%. Growth metrics, including gross profit growth at 8.56% and EBIT growth at 10.28%, also show healthy expansion. From a ratios perspective, the company has a solid return on equity of 30.43%, a return on invested capital (ROIC) of 11.56% that exceeds the weighted average cost of capital (WACC) at 6.41%, indicating value creation, and a favorable interest coverage ratio of 8.83.
Unfavorable signals
On the downside, the company faces some challenges. The price-to-earnings ratio of 25.74 and price-to-book ratio of 7.83 are considered unfavorable, suggesting potential overvaluation. The debt-to-equity ratio stands at 1.64, which is moderately high, and the asset turnover ratio is low at 0.43, implying less efficient use of assets. The Altman Z-Score of 2.71 places the company in the grey zone, signaling moderate bankruptcy risk. Furthermore, the stock is currently in a bearish overall trend with a price decline of 7.8% and recent seller volume significantly exceeding buyer volume.
Conclusion
While Marsh & McLennan Companies, Inc. exhibits favorable income statement performance and creates value with a strong ROIC above WACC, some valuation concerns and debt levels temper the outlook. The bearish stock trend combined with recent seller dominance might signal caution, and it could be more prudent to wait for renewed buyer interest before considering a long-term position. Overall, the company’s financial strength suggests it may appear favorable for long-term investors, but current market signals imply a cautious stance.
Disclaimer: This article is not financial advice. Each investor is responsible for their own investment decisions.
Additional Resources
- Crash in Marquette Co. marsh leads to arrest of 3 on drug charges – Channel 3000 (Jan 03, 2026)
- Michigan State WR Nick Marsh sets first two transfer portal visits: Top 25 player to see Indiana, Notre Dame – 247Sports (Jan 02, 2026)
- IU football transfer portal names to know: Michigan State WR Nick Marsh – The Daily Hoosier (Jan 02, 2026)
- A third school, from the Big Ten, is entering the mix for Nick Marsh – Spartans Wire (Jan 02, 2026)
- Obituary information for Edna Mary “Kitty” Marsh – Snyder Funeral Homes (Dec 31, 2025)
For more information about Marsh & McLennan Companies, Inc., please visit the official website: mmc.com